Practice Essentials
Acute respiratory distress syndrome (ARDS) was first described by Ashbaugh and colleagues in 1967. [1] The authors reported the condition as an acute onset of severe respiratory distress, cyanosis (hypoxemia) that is refractory to oxygen therapy, diffuse abnormalities on chest radiographs, and decreased lung compliance. Imaging has become increasingly important for diagnostic, monitoring, and investigative purposes. Techniques include radiography, computed tomography, positron emission tomography, ultrasound, and electrical impedance tomography. [2]
ARDS is a serious inflammatory disorder with a high mortality, reportedly ranging from 40-46%. Depending on patient age and population, ARDS in the ICU ranges from 4-9%. [3, 4]
(A chest radiograph depicting acute respiratory distress syndrome is provided below.)
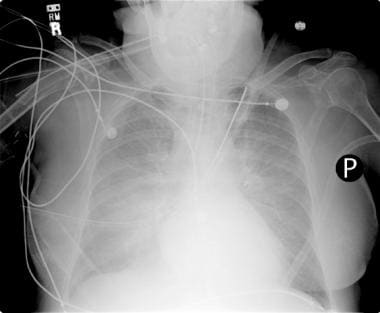
 Anteroposterior (AP) portable chest radiograph in a patient who had been in respiratory failure for 1 week with the diagnosis of acute respiratory distress syndrome. This image shows an endotracheal tube, a left subclavian central venous catheter in the superior vena cava, and bilateral patchy opacities in mostly the middle and lower lung zones.
COVID-19
Patients who have COVID-19 have been found to be at risk for ARDS, with risk factors including age 65 years or older, neutrophilia, and organ or coagulation dysfunction. In one study of 201 patients in Wuhan, China, with COVID-19, 84 developed ARDS and 44 of those died. In patients who developed ARDS, 50 of 84 presented with dyspnea and had comorbidities such as hypertension (23 of 84) and diabetes (16 of 84). [5] (See the Computed Tomography section below for COVID-19 chest images and findings.)
See Acute Respiratory Distress Syndrome: A Complex Clinical Condition, a Critical Images slideshow, for more information on this life-threatening condition characterized by acute respiratory failure, hypoxemia, and pulmonary edema.
According to the American-European Consensus Conference (AECC) the definition of ARDS is as follows [6] :
-
Acute onset of symptoms
-
The ratio of the alveolar partial pressure of oxygen (PaO2) to the fraction of inspired oxygen (FIO2) of 200 mm Hg or less
-
Bilateral infiltrates on chest radiographs
-
Pulmonary arterial wedge pressure of 18 mm Hg or less or no clinical signs of left atrial hypertension
The radiographic abnormalities of ARDS reflect the leakage of fluid with a high protein content into the alveolar spaces because of alveolar epithelial injury, or diffuse alveolar damage. ARDS is a syndrome that is defined by its clinical features. The condition may result from intrathoracic or extrathoracic events of various etiologies, such as inflammatory, infectious, vascular, or traumatic etiologies. Determining the causative event may be clinically important for proper treatment. [7, 8, 9, 10, 11]
ARDS is a syndrome that commonly begins after exposure to a known risk factor. Why some people develop ARDS and others do not is still unknown. The risk factors for ARDS include primary pulmonary etiologies (eg, aspiration, pneumonia, toxic inhalation, pulmonary contusion) and extrapulmonary etiologies (eg, sepsis, pancreatitis, multiple blood transfusions, trauma, use of drugs such as heroin). Sometimes, ARDS is not only a reaction to another event but also the result of a known cause, such as an acute interstitial pneumonia (AIP) or a severe, extensive, infectious pneumonia.
The ARDS Definition Task Force in Berlin [12, 13] decided on a new and improved definition of ARDS using 3 mutually exclusive categories of ARDS based on the degree of hypoxemia:
-
Mild: PaO2/FIO2 ≤ 300 mm Hg but > 200 mm Hg
-
Moderate: PaO2/FIO2 ≤ 200 mm Hg but > 100 mm Hg
-
Severe: PaO2/FIO2 ≤100 mm Hg
This Berlin definition of Acute Respiratory Distress Syndrome outlines stages of mild, moderate, and severe ARDS as associated with increased mortality and increased median duration of mechanical ventilation in survivors and was found to be more predictive than the prior AECC definition. [12, 13]
Mild, moderate, and severe ARDS were associated with increased mortality rates (27%, 32%, and 45%, respectively; P< .001) and increased median duration of mechanical ventilation in survivors (5, 7, and 9 days; P< .001). [12, 13]
Four ancillary variables for severe ARDS, to include radiographic severity, respiratory system compliance (≤40 mL/cm water), positive end-expiratory pressure (≥10 cm water), and corrected expired volume per minute (≥10 L/min), were not predictive, and it was decided to drop them from the definition. [12, 13]
Radiography
Chest radiograph findings of ARDS vary widely depending on the stage of the disease. The most common chest radiograph findings are bilateral, predominantly peripheral, somewhat asymmetrical consolidation with air bronchograms. Septal lines and pleural effusions, however, are uncommon. Differential diagnosis considerations include pneumonias such as those due to aspiration, diffuse alveolar hemorrhage, and pulmonary edema of any cause. [14, 15, 16]
(See the images below.)
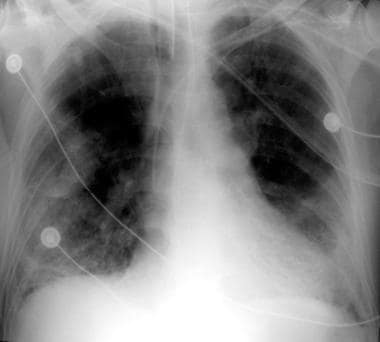
 Portable chest radiograph in a patient with acute respiratory distress syndrome. The condition evolved over approximately 1 week.
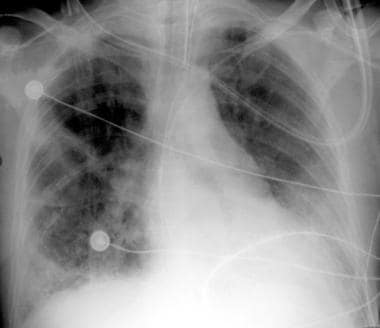
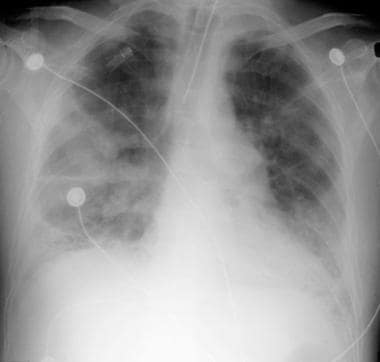 Portable chest radiograph in a patient with acute respiratory distress syndrome. The condition evolved over approximately 1 week.
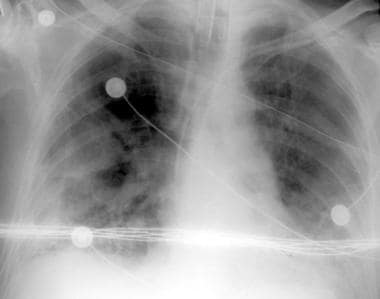
 Portable chest radiograph in a patient with acute respiratory distress syndrome. The condition evolved over approximately 1 week.
 Portable chest radiograph. This image shows bilateral opacities that are suggestive of ARDS.
Early findings on the chest radiograph include normal or diffuse alveolar opacities (consolidation), which are often bilateral and which obscure the pulmonary vascular markings. Later, these opacities progress to more extensive consolidation that is diffuse, and they are often asymmetrical. Again, effusions and septal lines are not usually seen on chest radiographs of patients affected by ARDS, although these findings are commonly seen in patients with congestive heart failure (CHF). Radiographic findings tend to stabilize (part of the clinical definition of ARDS); if further radiographic worsening occurs after 5-7 days, another disease process should be considered.
Chest radiograph correlation with the pulmonary pathologic findings is useful because steroids may be helpful at the beginning of the fibrotic process in ARDS. [11] In the early exudative phase, chest radiographs show 3 general findings: (1) a bilateral, whiteout appearance; (2) asymmetric consolidations; and (3) a central bat-wing, consolidative appearance. [17]
In the fibrotic phase, chest radiographs may have an interstitial appearance, which is not necessarily due to fibrosis, because this finding may completely resolve in many patients who survive. Pathologic specimens have been analyzed, and the findings of severe lung fibrosis do not correlate with any specific portable chest radiograph findings, including reticular patterns. Computed tomography (CT) scans provide more detailed and more reliable information in areas of consolidation and fibrosis.
If the patient survives, most radiographic abnormalities improve after 10-14 days. The speed and degree of this improvement vary widely from complete resolution before the patient's discharge from the intensive care unit (ICU) to gradual improvement over several months. Factors that affect the speed of recovery are not known, but they may be related to other medical factors (eg, patient's age, underlying disease states) that may have caused the onset of ARDS in the first place.
Therapy for ARDS can affect the chest radiograph appearance. To improve oxygenation, the clinician may place the patient in the prone position. However, large clinical trials have failed to prove that there is any mortality benefit from prone positioning.
The initial chest radiograph in ARDS patients who have been treated with partial liquid ventilation with perflubron shows opacification in 60-100% of the lung fields; the lateral image reveals a gravity-dependent distribution. Findings of residual perflubron can linger for as long as 138 days, but its levels usually are minimal after 3 weeks. (The radiograph of a patient who was treated with perflubron is provided below.) [7, 8, 9, 18, 19, 20, 21]
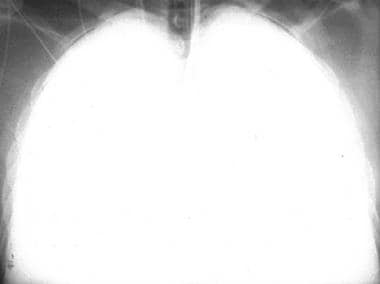 Chest radiograph in a patient with acute respiratory distress syndrome (ARDS). The patient was treated with perflubron, which is used for partial liquid ventilation.
Mechanical ventilation with positive end-expiratory pressure (PEEP) is another common therapy in ARDS. [22] Chest radiograph findings when PEEP is applied vary from no change to apparent hyperinflation. Higher levels of PEEP may result in barotraumatic changes, which include vesicular rarefactions, pulmonary interstitial emphysema (lucent streaks toward the hilus), radiolucent halos around vessels, pneumatocele formation, subpleural emphysema as manifested by blebs or lucent lines on the chest radiograph, pneumothorax, mediastinal emphysema, and extrathoracic gas collection. [23] When PEEP is initially applied or increased, lung opacities may appear to improve; or if PEEP is reduced, the opacities may appear to worsen, despite the fact that the clinical signs are stable or contrary to improvement or worsening of these opacities on radiographs.
The AECC definition of ARDS is usually used in investigations of the syndrome. Several entities can mimic ARDS, and attempts to exclude these diseases are important. Lung injury scores are sometimes used in clinical trials, and the chest radiograph interpretation can be weighted 50% or more in these scores. For this reason, some investigators have questioned the reproducibility of chest radiograph readings between clinicians. High interobserver variability in chest radiograph interpretations occurs, even between experts. On the other hand, the chest radiographs are very accurate in the diagnosis of ARDS, with rates as high as 84%. The accuracy of the chest radiograph reading is stage dependent, and observer disagreement is highest in the early disease phases. Accuracy of the clinical diagnosis is also dependent on the pathologic stage.
Computed Tomography
The diffuse and often nonspecific consolidation that is depicted on chest radiographs in patients with ARDS is, in fact, heterogeneous on CT scans. Also, CT scans show that the parenchymal consolidation in ARDS is in the gravity-dependent areas of the lung. [24] Therefore, the disease is not as diffuse as the chest radiograph findings alone suggest. [25, 26, 27, 28, 29] (See the images below.)
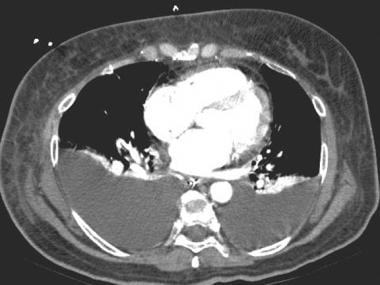 Computed tomography scan in a patient with suspected acute respiratory distress syndrome (ARDS). This image was obtained at the cardiac level with mediastinal window settings and shows bilateral pleural effusions instead of diffuse bilateral lung consolidation. In addition, the presence of some compression atelectasis in the lower lobes is observed.
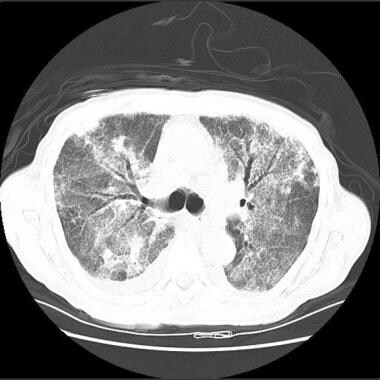 High-resolution computed tomography scan in a patient with acute respiratory distress syndrome. This image demonstrates a small right pleural effusion, consolidation with air-bronchograms, and some ground-glass-appearing opacities. The findings indicate an alveolar process, in this case, alveolar damage.
A review of chest CT scans in 74 patients with ARDS revealed the following findings [24] :
-
Bilateral abnormalities in almost all the patients, predominantly dependent abnormalities (86%)
-
Patchy abnormalities (42%)
-
Homogeneous abnormalities (23%)
-
Ground-glass attenuation (8%)
-
Mixed ground-glass appearance and consolidation (27%)
-
Basilar predominant abnormalities (68%)
-
Areas of consolidation with air bronchograms (89%)
CT scan findings in the study also provided additional information relative to the chest radiographs in 66% of the patients that directly affected treatment in 22% of the patients. [24]
On CT scans, ARDS that is due to pulmonary disease tends to be asymmetrical, with a mix of consolidation and ground-glass opacification, whereas ARDS that is due to extrapulmonary causes has predominantly symmetric ground-glass opacification. CT scans of ARDS patients with AIP tend to have more symmetric consolidations, more basilar distribution, and more honeycombing (26%) than those patients without AIP (8%). [30] In patients with ARDS from either cause, pleural effusions and air bronchograms are common, and Kerley B lines and pneumatoceles are uncommon.
If a patient is placed in the prone position, as they sometimes are in an attempt to improve oxygenation, the consolidations shift over time to the anterior portions of the lung parenchyma, which are now in the gravity-dependent portions of the lung. [31] Because of a lack of positive outcome data, logistics, and possible complications of this procedure, it is not often used. In one study, CT scanning was performed on a cohort of patients about to be placed in the prone position. [32] Although good evaluation of the patients' pathologic lung changes were seen, the authors were unable to select out any findings that would predict which patients eventually responded to prone-position ventilation.
CT scanning can be used to detect the pathologic features and complications of ARDS that are occult on chest radiographs largely because the diffuse consolidations of ARDS obscure other findings, which include the following: pleural abnormalities (eg, pneumothorax), parenchymal disease (eg, nodules, focal opacities, interstitial emphysema), and mediastinal disease (eg, enlarged lymph nodes). In one study, pneumothorax was missed on supine chest radiographs and detected with CT scans in one third of the patients. Also, the position of a thoracostomy tube can be better delineated with CT scanning so that the need for repositioning can be determined.
In a study of the use of CT in 204 cases of ARDS, results obtained from CT scans led to changes in management in 26.5% of cases. The most common pathologic findings of the lung parenchyma were consolidations (94.1% of cases) and ground-glass opacities (85.3%), along with pleural effusions (80.4%), mediastinal lymphadenopathy (66.7%), signs of right ventricular strain and pulmonary hypertension (53.9%), pericardial effusion (37.3%), emphysema of the chest wall (12.3%), pneumothorax (11.8%), emphysema of the mediastinum (7.4%), and pulmonary embolism (2.5%). [33]
In the later stages of ARDS, CT scanning is more reliable than the chest radiograph in the detection of suspected fibrosis as the changes that accompany fibrosis become more apparent. Findings that are suggestive of fibrosis and better visualized on CT scans include traction bronchiectasis, lobular distortion, intralobular lines, and in advanced cases, cystic lung destruction (also called honeycombing).
ARDS therapies can also alter the CT scan appearance. The use of perflubron in partial liquid ventilation causes a gravity-dependent patchy or homogeneously white appearance on CT scans. The movement of perflubron out of the lungs has been documented and may occur because of hematogenous spread. Extrapulmonary perflubron may also be present in the lymph nodes, pleural space, mediastinum, and retroperitoneum.
CT scanning has also been used to evaluate patients who survive ARDS. In one study, 6-10 months after ARDS patients were discharged from the hospital, CT images of their chests revealed more ventral than dorsal pulmonary fibrosis in 87% patients. [34] The extent of the fibrotic changes correlated with the severity of ARDS as well as the duration of mechanical ventilation during which high peak pressures (>30 mm Hg) or high oxygen levels (>70%) were used.
COVID-19
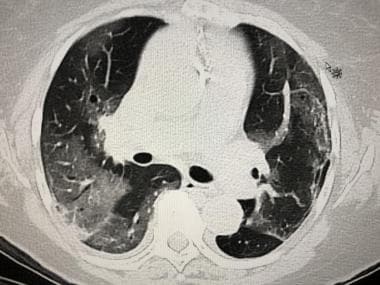
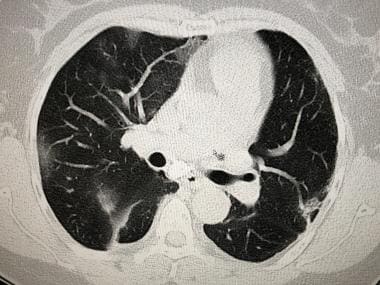
CT scan of the chest has been found to be useful in the diagnosis of COVID-19. Findings include peripheral predominant ground-glass infiltrates. A review of 53 patients with SARS-Coronavirus-2 infections who received CT chest imaging described the findings as follows: 47 cases (88.7%) had findings of COVID-19 infection, and the other 6 (11.3%) were normal. Of the 47 cases, 78.7% involved both lungs, and 93.6% had peripheral infiltrates distributed along the subpleural area. All cases showed ground-glass opacity (GGO), 59.6% of which were round, and 40.4% of which were patchy. Other imaging features included crazy-paving pattern (89.4%), consolidation (63.8%), and air bronchogram (76.6%). Air bronchograms were observed within GGO (61.7%) and consolidation (70.3%). Neither enlarged mediastinal lymph nodes nor pleural effusion were present. Thirty-three patients (62.3%) were followed an average interval of 6.2 ± 2.9 days. The lesions increased in 75.8% and resorbed in 24.2% of patients. [38]
(See the COVID-19 images below.)
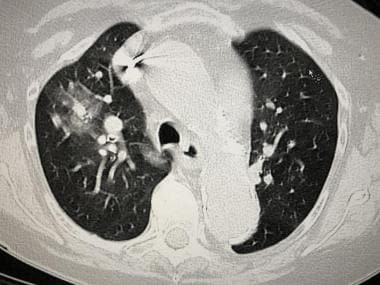 CT scan of an 82-year-old woman with proven SARS-coronavirus-2 (COVID-19), soon after which she developed full ARDS.
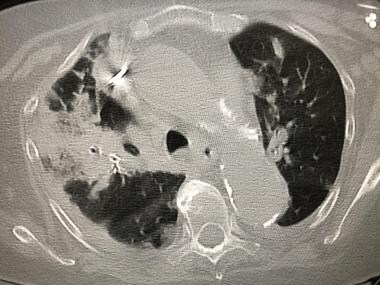 CT scan of an 82-year-old woman with proven SARS-coronavirus-2 (COVID-19), soon after which she developed full ARDS. This is 7 days after the prior chest CT scan shown in the preceding image.
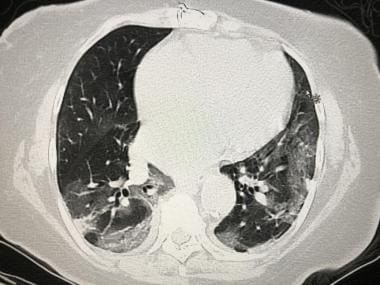 CT scan of a 79-year-old woman with SARS-coronavirus-2 (COVID-19), soon after which she developed full ARDS.
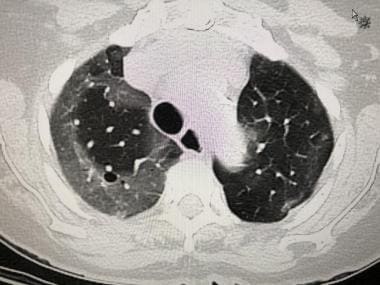 CT scan of a 79-year-old woman with proven SARS-coronavirus-2 (COVID-19), soon after which she developed full ARDS.
 CT scan of a 79-year-old woman with proven SARS-coronavirus-2 (COVID-19), soon after which she developed full ARDS.
 CT scan of a 60-year-old woman with proven SARS-coronavirus-2 (COVID-19), soon after which she developed ARDS.
Ultrasonography
Leblanc et al found that lung contusion extent assessed by lung ultrasound on admission was predictive of the occurrence of ARDS within 72 hours (AUC-ROC = 0.78 [95 % CI 0.64-0.92]). They determined that the extent of lung contusion on LUS correlated well with CT scan measurements. An LUS (lung ultrasound) score of 6 out of 16 was the best threshold to predict ARDS, with a 58% [95 % CI 36-77] sensitivity and a 96% [95 % CI 76-100] specificity. [35]
Nuclear Imaging
Positron emission tomography (PET) scanning has been used in studies of extravascular lung density (EVD) and pulmonary vascular permeability with the pulmonary transcapillary escape rate (PTCER). [36, 37] In studies, patients with ARDS had a PTCER and EVD that were higher than those of healthy control subjects, and the findings were most dramatic in the early phase of ARDS. The PTCER remained elevated in patients with ARDS, even after the EVD had returned to normal levels.
The PTCER can be used to estimate capillary permeability by watching for the accumulation of injected gallium-68 (68Ga) citrate, which is attached to native transferrin, in the lung parenchyma. ARDS is a noncardiogenic pulmonary edema condition; therefore, fluid and protein are translocated across the lung vascular endothelium into the interstitium. These measures are used only in experimental studies, not in routine clinical situations.
-
Anteroposterior (AP) portable chest radiograph in a patient who had been in respiratory failure for 1 week with the diagnosis of acute respiratory distress syndrome. This image shows an endotracheal tube, a left subclavian central venous catheter in the superior vena cava, and bilateral patchy opacities in mostly the middle and lower lung zones.
-
Portable chest radiograph in a patient with acute respiratory distress syndrome. The condition evolved over approximately 1 week.
-
Portable chest radiograph in a patient with acute respiratory distress syndrome. The condition evolved over approximately 1 week.
-
Portable chest radiograph in a patient with acute respiratory distress syndrome. The condition evolved over approximately 1 week.
-
Photomicrograph from a patient with acute respiratory distress syndrome (ARDS). This image shows ARDS in the exudative stage. Note the hyaline membranes and loss of alveolar epithelium in this early stage of ARDS.
-
Photomicrograph from a patient with acute respiratory distress syndrome (ARDS). This image shows ARDS in the early proliferative stage. Note the type 2 pneumocytic proliferation, with widening of the septa and interstitial fibroblast proliferation.
-
Photomicrograph from a patient with acute respiratory distress syndrome (ARDS). This image shows ARDS in the late proliferative stage. Note the extensive fibroblast proliferation, with incorporation of the hyaline membranes.
-
Chest radiograph in a patient with acute respiratory distress syndrome (ARDS). The patient was treated with perflubron, which is used for partial liquid ventilation.
-
Portable chest radiograph. This image shows bilateral opacities that are suggestive of ARDS.
-
Computed tomography scan in a patient with suspected acute respiratory distress syndrome (ARDS). This image was obtained at the cardiac level with mediastinal window settings and shows bilateral pleural effusions instead of diffuse bilateral lung consolidation. In addition, the presence of some compression atelectasis in the lower lobes is observed.
-
High-resolution computed tomography scan in a patient with acute respiratory distress syndrome. This image demonstrates a small right pleural effusion, consolidation with air-bronchograms, and some ground-glass-appearing opacities. The findings indicate an alveolar process, in this case, alveolar damage.
-
CT scan of a 60-year-old woman with proven SARS-coronavirus-2 (COVID-19), soon after which she developed ARDS.
-
CT scan of a 79-year-old woman with proven SARS-coronavirus-2 (COVID-19), soon after which she developed full ARDS.
-
CT scan of a 79-year-old woman with proven SARS-coronavirus-2 (COVID-19), soon after which she developed full ARDS.
-
CT scan of a 79-year-old woman with SARS-coronavirus-2 (COVID-19), soon after which she developed full ARDS.
-
CT scan of an 82-year-old woman with proven SARS-coronavirus-2 (COVID-19), soon after which she developed full ARDS.
-
CT scan of an 82-year-old woman with proven SARS-coronavirus-2 (COVID-19), soon after which she developed full ARDS. This is 7 days after the prior chest CT scan shown in the preceding image.


