Practice Essentials
Sturge-Weber syndrome (SWS), which is also known as encephalotrigeminal angiomatosis, is a congenital disorder caused by the persistence of the transitory primordial sinusoidal plexus stage of vessel development. SWS is usually sporadic and characterized by a vascular malformation, with capillary or venous malformation, or both, that involves the face, choroid of the eye, and leptomeninges. The facial vascular malformation has a predilection for the distribution of the first division of the trigeminal nerve. The hallmark of SWS is a facial cutaneous venous dilation, also referred to as a nevus flammeus or port-wine stain (PWS). [1, 2]
In addition to the vascular meningeal malformation, an underlying atrophy of the cerebral hemisphere is often present. The disease process is usually unilateral. Most patients (80%) have epilepsy, and more than 50% have a mental deficiency. [1, 2]
Glaucoma is the main ophthalmic complication in patients with SWS, with an incidence of 30-60%. [3]
A somatic mutation in the G-α q gene, which has been identified in both the port wine stain and the affected brain, has been proposed to be the underlying cause of the SWS vascular abnormalities. [4, 5]
The radiologic diagnosis of SWS is usually made with a high index of clinical suspicion. A study by Pedespan et al showed that early diagnosis of SWS is possible with contrast-enhanced MRI performed in asymptomatic infants younger than 3 months with a facial PWS. [6]
Studies have shown consistently higher glutamate-to-creatine (GLU/CR) ratios in the affected hemisphere of children with unilateral SWS. In addition, high asymmetries of mean GLU/Cr ratios have been shown to be associated with frequent seizures, and areas with high GLU have shown increased (but also decreased) interictal glucose metabolism on positron emission tomography. According to the authors, these findings lend support to the role of excess GLU in SWS-associated epileptogenesis and suggest that anti-glutamatergic treatment may be useful to alleviate seizures in these patients. [7, 8]
Imaging modalities
Examinations for SWS include plain skull radiography, computed tomography (CT) scanning, magnetic resonance imaging (MRI), angiography, and nuclear medicine studies. [9, 10, 11, 12] CT scanning is more sensitive than plain skull radiography and MRI in the detection subcortical calcifications. However, MRI with contrast is probably the best imaging test. It is superior to CT in the demonstration of abnormal myelination, and it is more sensitive in the demonstration of leptomeningeal enhancement, particularly in the presence of dense cortical calcification on CT scans. In addition, orbital associated malformations are well depicted on contrast-enhanced orbital MRI. [13, 14, 15, 16]
CT is the best modality to detect calcifications, as well as to show other changes such as cortical atrophy and leptomeningeal enhancement. However, CT requires ionizing radiation, which is not recommended in children. Therefore, MRI of the brain with contrast is the recommended imaging modality of choice. The most common locations are occipital and posterior parietal/temporal lobes. In the early phase of disease, MRI shows transient hyperperfusion with accelerated myelin maturation, leptomeningeal enhancement, and restricted diffusion if there is an acute ischemic event. In the late phase, the increased T2 signal is seen in the region of gliosis, with decreased pial enhancement and cortical atrophy. [1]
On MRI, gyriform calcifications are best seen on T2* or susceptibility-weighted images and appear as areas of signal loss along the gyri in a serpentine pattern. Patients who have cutaneous and ocular manifestations but a normal brain MRI at 1 year of age are unlikely to have future brain involvement. Choroidal angiomas can be seen on MRI as increased enhancement along the posterior choroid layer of the globe. [1]
Gyriform calcifications can be seen on skull radiographs, known as the tram-track sign. [1]
Calcification may not be detectable in individuals younger than 2 years. Other causes of gyriform intracranial calcification cannot always be differentiated from those found in SWS.
MRI is expensive, it is less widely available, and patients may experience claustrophobia. MRI is contraindicated in patients with certain types of cardiac pacemakers and ferromagnetic prostheses.
Klippel-Trenaunay-Weber syndrome and Wyburn-Mason syndrome may cause similar angiographic appearances.
Cerebral perfusion defects and areas of hypometabolism are seen with positron emission tomography (PET) in a variety of epileptogenic foci.
In a study by Jimenez-Legido et al of transcranial Doppler (TCD) ultrasonography to monitor the degree of hemodynamic involvement and its progression in patients with SWS, the percentage of middle cerebral artery (MCA) velocity asymmetry was positively correlated with the clinical severity score and with seizure frequency. The authors concluded that TCD may provide a noninvasive method to assess the severity of blood flow abnormalities at baseline and a method to monitor children for progressive changes over time. [17]
Intervention
Cerebral lobectomy may be considered in some patients. In cases with severe drug-refractory focal epilepsy caused by SWS, promising results have been achieved with hemispherectomy. [18]
Devlin and associates described the clinical course and outcomes in 33 children who underwent hemispherectomy and concluded that the optimal timing of surgery with respect to age at presentation and the influence of the underlying pathology are only slowly emerging. At surgery, their patients were aged 0.33-17 years. [19]
Vining and associates from Johns Hopkins hospital reported their experience with 58 children after hemispherectomy. They concluded that early surgery relieves the burden of constant seizures and allows the child to return to a more normal life. [20] Kossoff et al concluded that the patient's age at surgery does not have an adverse effect on either seizure or cognitive outcomes. [21]
Radiography
Plain skull radiographs may show ipsilateral skull-table and orbital thickening, elevation of the sphenoid wing and petrous ridge, and enlargement of ipsilateral paranasal sinuses and mastoid air cells due to underlying ipsilateral cerebral atrophy.
Plain radiographs of the skull in older children and adults may reveal asymmetry, with a smaller hemicranium on the ipsilateral side. Rarely, ipsilateral enlargement of the hemicranium occurs secondary to the vascular malformation. [22] The most striking feature is the presence of tramline gyriform patterns of intracranial calcification in the subcortical region, primarily in the parietal and occipital regions. The gyriform pattern known as "railroad track appearance" is demonstrated in the image below. [23]
Calcification usually affects children older than 2 years, although calcification has been described in neonates. The calcification is bilateral in 20% of patients. The increased sensitivity of CT allows earlier demonstration of calcifications.
 Plain lateral skull radiograph demonstrates the typical gyriform pattern of cortical calcification (arrows) in the occipital region.
Computed Tomography
CT scans show the tramline gyriform calcification of apposing gyri that underlies the contrast-enhancing leptomeningeal vascular malformation. Cortical enhancement may be difficult to appreciate on CT when cortical calcification is dense. The subjacent white matter may be hypoattenuating on CT scans. The ipsilateral choroid plexus may be enlarged. Enlarged transcortical (medullary) veins are frequently associated with an enlarged choroid glomus. [24]
Other features on CT scans include ipsilateral cortical atrophy, enlargement of the ipsilateral ventricle, and loss of volume of the ipsilateral cranial cavity. [25] Occasionally, the hemicranium is enlarged on the ipsilateral side, with associated enlargement of the cerebrospinal fluid (CSF) space. [26]
CT scanning is more sensitive than skull radiography and MRI in the detection subcortical calcifications, and detection is sometimes possible in patients younger than 2 years. [23]
(See the images below.)
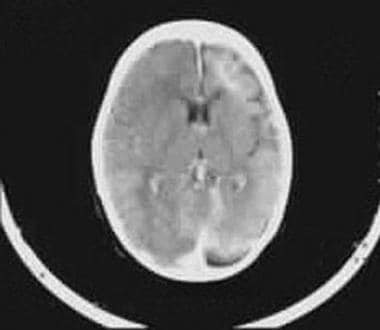 Contrast-enhanced CT scan shows intense enhancement of the angiomatous malformation and atrophy of the ipsilateral hemisphere.
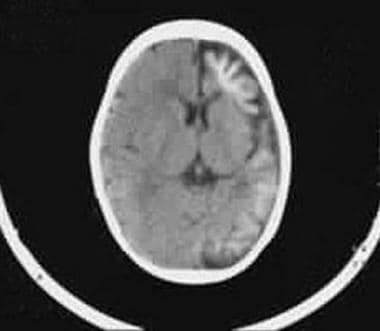 Axial nonenhanced CT scan shows left hemiatrophy of the cerebral cortex and typical gyral calcification.
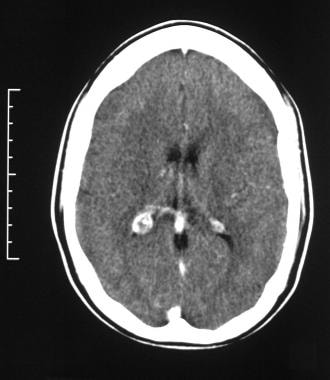 Axial contrast-enhanced CT scan through the occipital horns of the lateral ventricles shows right cerebral atrophy and an enlarged right choroid plexus in a patient with Sturge-Weber syndrome.
Magnetic Resonance Imaging
MRI reveals a pial, enhancing, angiomatous malformation (see the image below), often in the occipital or posterior temporoparietal region ipsilateral to the facial angioma. [13, 15, 27]
 Axial T1-weighted gadolinium-enhanced MRI in a 5-year-old child with a right-sided facial nevus and a history of focal fits. Image shows intense pial enhancement due to angiomatous malformation and subjacent cerebral atrophy.
MRI also demonstrates atrophy of the cerebral hemisphere (see the image below) subjacent to the leptomeningeal angioma, with small gyri and enlarged adjacent sulci. [28] Subtle atrophy is frequently more obvious on MRIs than on CT scans. On T2-weighted images, the angioma appears as a hyperintense leptomeningeal thickening. In patients with choroidal angiomas, high-resolution, T1-weighted, fat-suppressed, enhanced images show choroidal enhancement.
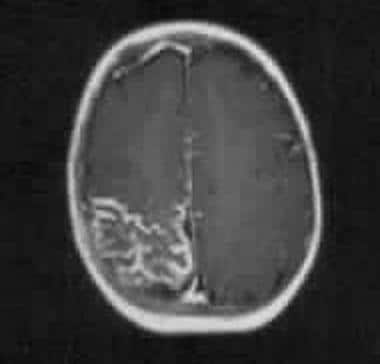
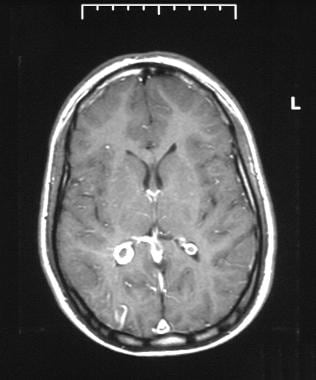 Axial T1-weighted gadolinium-enhanced MRI through the occipital horns of the lateral ventricles in a patient with Sturge-Weber syndrome. MRI shows right cerebral atrophy, an enhancing right occipital cortex, and an enlarged right choroid plexus.
Gadolinium enhancement improves visualization of the angiomatous malformation. Calcification in the underlying cortex is not as evident as on CT scans, but it does not mask enhancement of the underlying angiomatous malformation, which can be a problem with CT. As in contrast-enhanced CT, the glomus of the choroid plexus may be enlarged, and enlarged draining transcortical veins may be present in the involved cerebral hemisphere. The overlying superficial cortical veins are reduced in size and number, with a prominent deep collateral venous system.
Abnormally low signal intensity from the involved cortex may result from dystrophic calcification or from abnormal iron deposition in the cortex. Abnormal myelination has been described in association with SWS; myelination may be delayed or deficient in some patients and accelerated in others.
In a retrspective study of 60 patients with SWS, Pasquini and colleagues reported the presence of asymmetric cavernous sinus (CS) enlargement in 11.6% of patients. A finding of asymmetric CS enlargement, along with brain atrophy and deep venous dilatation, was associated with neurologic deficits. [29]
Susceptibility-weighted imaging (SWI) is a 3-dimensional, gradient-echo MRI technique with phase post-processing. SWI is useful in accentuating the paramagnetic properties of blood products, intravascular venous deoxygenated blood, and extravascular blood products. It is effective in the presence of other substances, such as iron, calcification, and air. [30]
SWI has been used for a variety of pediatric neurologic disorders, including vascular malformations such as cavernous angiomas, telangiectasias, and pial angiomas associated with SWS, as well as for the depiction of calcification in intracranial lesions. SWI has the potential to provide additional diagnostic and prognostic information that may improve the care and outcome of affected children.
Quantitative brain MR spectroscopy (MRS) and diffusion tensor imaging (DTI) have been used in the characterization of SWS. Differences have been recorded between the abnormal cerebral cortex and the normal contralateral normal cerebral cortex. A choline increase and N -acetylaspartate decrease are observed in a pathologic cortex, while an unaffected cerebral cortex shows no change in the DTI parameters. These changes in the pathologic cortical gray matter in SWS patients probably reflect neuronal loss or dysfunction and demyelination as a result of recurrent seizures. [31, 32]
Physiologic alterations in SWS can be assessed by using MR perfusion imaging (PWI) and proton spectroscopic imaging (MRSI). PWI changes in SWS indicate cerebral hypoperfusion predominantly due to impaired venous drainage, with only the most severely affected regions showing arterial perfusion deficiency. The severity of cerebral hypoperfusion correlates well with neuronal loss/dysfunction, which is reflected in the severity of neurologic symptoms and disability. The highest correlation is found with the degree of hemiparesis. These parameters may be useful in quantifying disease severity. [33]
Blood-oxygen-level-dependent (BOLD) MR venography has been shown to identify leptomeningeal internal veins in a 4-month-old with SWS when other MR sequences failed to show any abnormality. Follow-up MRI after the first seizure at the age of 12 months demonstrated strong leptomeningeal enhancement, while BOLD venography revealed abnormal medullary and subependymal veins, as well as deep venous structures. At the time of the second MR scan, signs of cerebral atrophy and calcifications were apparent on CT. The report showed that BOLD venography may allow early diagnosis of venous anomalies in SWS. [34]
Gadolinium-based contrast agents have been linked to the development of nephrogenic systemic fibrosis (NSF) or nephrogenic fibrosing dermopathy (NFD). The disease has occurred in patients with moderate to end-stage renal disease after being given a gadolinium-based contrast agent to enhance MRI or MRA scans. NSF/NFD is a debilitating and sometimes fatal disease. Characteristics include red or dark patches on the skin; burning, itching, swelling, hardening, and tightening of the skin; yellow spots on the whites of the eyes; joint stiffness with trouble moving or straightening the arms, hands, legs, or feet; pain deep in the hip bones or ribs; and muscle weakness.
Degree of confidence
Although MRI is not as good as CT scanning in the depiction of calcification, it is superior to CT in the demonstration of abnormal myelination. MRI is much more sensitive in the demonstration of leptomeningeal enhancement, particularly when dense cortical calcification exists on CT scans. Choroidal lesions are well depicted on high-resolution, contrast-enhanced orbital MRIs.
SWS must be differentiated from other neurocutaneous disorders, although correlation of the intracranial findings with the clinical characteristics is usually diagnostic. Statistically, most patients with facial capillary malformations (port-wine stains) do not have SWS. In addition, some patients with classic intracranial findings of SWS have no facial abnormalities.
Nuclear Imaging
Abnormal cerebrovenous drainage is associated with ischemia, hypoxia, and glucose deprivation, which can account for progressive neurologic deterioration in SWS. Single-photon emission CT (SPECT) scanning, technetium-99m (99mTc) hexamethylpropyleneamine oxime (HMPAO) scanning, and fluorodeoxyglucose (FDG) positron emission tomography (PET) scans show diminished perfusion and reduced glucose metabolism in the affected cerebral hemisphere. [35]
Approximately 50% of patients with SWS are found to have bihemispheric disease when they are examined with functional imaging, with abnormal perfusion and glucose metabolism being revealed. Widespread abnormalities of cerebral perfusion and glucose metabolism might explain the high prevalence of developmental delay associated with SWS. Hypoperfusion of the involved cerebral hemisphere usually appears in patients older than 1 year.
SPECT scanning depicts cerebral blood flow asymmetry in infants with SWS, which tends to shift with age. The cortex involved in the vascular malformation is hyperperfused during the first year of life, before the first seizures occur. The characteristic hypoperfusion appears after 1 year of age, even in patients without epilepsy. [14, 36]
Degree of confidence
Tc-99m HMPAO imaging is a useful addition to the examination when delineation of the full extent of the abnormality is of particular relevance (eg, before surgery). Tc-99m imaging is more likely to depict areas of hypoperfusion, which represent ischemic regions; these areas may act as epileptogenic foci and may not be detected with CT scanning or MRI.
Cerebral perfusion defects and areas of hypometabolism are seen on PET scans in epileptogenic foci secondary to multiple underlying abnormalities.
Angiography
Although SWS is usually categorized with venous malformations, it is an extensive capillary and venous malformation that affects 1 or sometimes both cerebral hemispheres. Cerebral angiograms show early capillary blush in the areas involved with the pial vascular malformation associated with abnormally large veins in the subependymal and periventricular regions. Enlarged deep medullary veins that drain deep to the subependymal veins are present.
The superficial cortical veins in the region of the dystrophic calcification have markedly slow flow as a result of venous thrombosis, but most of the cortical veins are largely absent on the affected side. Rarely, high-flow shunting of arteriovenous malformations are seen.
Venous drainage occurs via bizarre, enlarged deep medullary veins into the deep venous system or via a few patent, enlarged cortical veins into the dural venous sinus. The deep veins and dural venous sinus are often not visualized in these patients. Whether the absent veins are congenitally aplastic or occluded as a result of thrombosis is not certain.
Some authorities advocate antiplatelet therapy in SWS, believing that clinical exacerbations may be the result of progressive venous thrombosis, although this has never been clearly documented with conventional angiography. However, progressive dural venous occlusion has been documented with magnetic resonance venography in an infant with SWS, although no luminal thrombus was evident on spin-echo images. So far, observations in SWS do little to clarify the issue of congenital versus acquired abnormality of the intracranial venous system.
Other vascular abnormalities seen with SWS include arterial occlusion (rare), segmental venous ectasia, and absent or luminal irregularities and deformities of the deep veins.
Zhao et al evaluated the episcleral vasculature in corneal limbus with optical coherence tomography angiography (OCTA) in normal control patients, port-wine stain (PWS) patients, and Sturge-Weber syndrome (SWS) patients. Each patient underwent slit-lamp examination, applanation tonometry, and OCTA. Slit-lamp and OCTA images demonstrated dense dilated episcleral vessels in PWS and SWS patients, particularly in the SWS group. Quantitative analysis of OCTA scans showed that the episcleral vessel density in controls, PWS, and SWS groups were 25.03% ± 1.47%, 28.28% ± 1.96%, and 33.59% ± 3.00%, respectively. This noninvasive technique, according to the authors, may serve as a more precise and reliable approach to conventional slit-lamp examination for assessing episcleral vascular patterns and providing quantitative measurement of vascular anomalies. [3, 37]
Degree of confidence
In light of an appropriate history, the angiographic appearances of SWS can be fairly characteristic, although the role of angiography in the management of SWS is decreasing. However, in patients with medically unresponsive seizures, resection of brain deep to the angioma is sometimes undertaken. In these patients, the identification of large diploic vessels by using angiography can help avoid a difficult craniotomy.
Klippel-Trenaunay-Weber syndrome and Wyburn-Mason syndrome may cause similar angiographic appearances.
-
Plain lateral skull radiograph demonstrates the typical gyriform pattern of cortical calcification (arrows) in the occipital region.
-
Contrast-enhanced CT scan shows intense enhancement of the angiomatous malformation and atrophy of the ipsilateral hemisphere.
-
Axial nonenhanced CT scan shows left hemiatrophy of the cerebral cortex and typical gyral calcification.
-
Axial T1-weighted gadolinium-enhanced MRI in a 5-year-old child with a right-sided facial nevus and a history of focal fits. Image shows intense pial enhancement due to angiomatous malformation and subjacent cerebral atrophy.
-
Axial contrast-enhanced CT scan through the occipital horns of the lateral ventricles shows right cerebral atrophy and an enlarged right choroid plexus in a patient with Sturge-Weber syndrome.
-
Axial T1-weighted gadolinium-enhanced MRI through the occipital horns of the lateral ventricles in a patient with Sturge-Weber syndrome. MRI shows right cerebral atrophy, an enhancing right occipital cortex, and an enlarged right choroid plexus.
-
Plain radiographs of the skull in a 16-year-old male adolescent shows asymmetry of the skull with a smaller hemicranium on the affected side. Note the underlying tramline gyriform intracranial calcification in the subcortical occipital region.