Practice Essentials
More than 90% of all pulmonary embolisms arise from thrombi within the large deep veins of the legs, typically the popliteal vein and the larger veins above it. [1, 2, 3] The pathophysiologic consequences of thromboembolism in the lung largely depend on the cardiopulmonary status of the patient and on the size of the embolus, which, in turn, dictates the size of the occluded pulmonary artery. Three primary influences predispose a patient to thrombus formation, forming the so-called Virchow triad: (1) endothelial injury, (2) stasis or turbulence of blood flow, and (3) blood hypercoagulability. [1, 2, 3]
Pulmonary embolism (PE) is a common cardiovascular emergency. Estimated lifetime prevalence has been estimated to be up to 5%. Approximately 20% of individuals with PE die before diagnosis or on the first day after their diagnosis. [4, 5, 6] The prevalence among hospitalized patients in the United States has been estimated to be around 0.4%. [7] The true prevalence of venous thromboembolism is underestimated, as many cases are not apparent clinically. Unsuspected PE can be found on up to 3.4% of inpatient and 0.9% of outpatient CT scans. [8] In oncologic patients, PE frequency has been reported to be as high as 3.9%. [9] The incidence of pulmonary embolism has increased in strong correlation with increased use of pulmonary CT angiography (CTA). [10]
Mortality attributable to PE is approximately 2-6% in patients with hemodynamically stable PE and 30% or more in patients presenting with hemodynamic instability. [11] Overall mortality has not changed with the shift to CTA for PE diagnosis; however, the case-fatality rate decreased from 5.7% to 3.3%. [10] The case-fatality rate decrease suggests that the recent shift from ventilation-perfusion (V/Q) scintigraphy to pulmonary CTA has been associated with a less fatal spectrum of embolic disease.
Wang et al studied the trends in imaging for suspected PE across US Health Care systems from 2004 through 2016 (overall, 3.6 to 4.8 million enrollees and 52,343,517 person-years of follow-up data) and found that chest CT use increased by 66.3% (average annual growth, 4.4% per year), CTPA use increased by 450% (average annual growth, 16.3% per year), and V/Q scan use decreased by 47.1% (decreasing by 4.9% per year). [4, 5, 6]
(Images depicting clots in the pulmonary arterial system are provided below.)
 Computed tomography angiogram in a 53-year-old man with acute pulmonary embolism. This image shows an intraluminal filling defect that occludes the anterior basal segmental artery of the right lower lobe. Also present is an infarction of the corresponding lung, which is indicated by a triangular, pleura-based consolidation (Hampton hump).
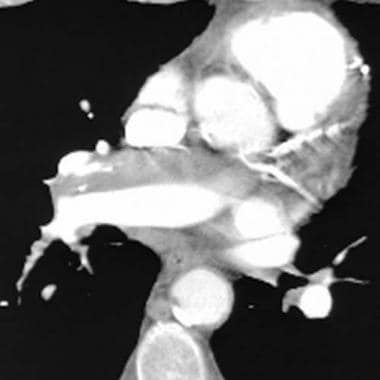
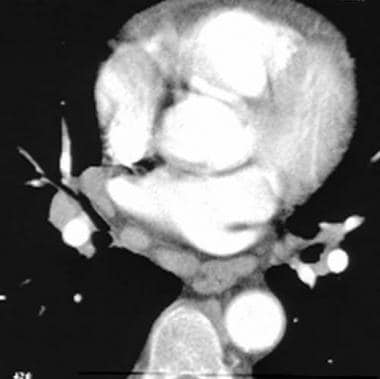
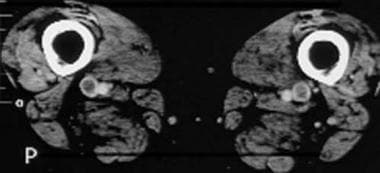
 Computed tomography angiography in a young man who experienced acute chest pain and shortness of breath after a transcontinental flight. This image demonstrates a clot in the anterior segmental artery in the left upper lung (LA2) and a clot in the anterior segmental artery in the right upper lung (RA2).
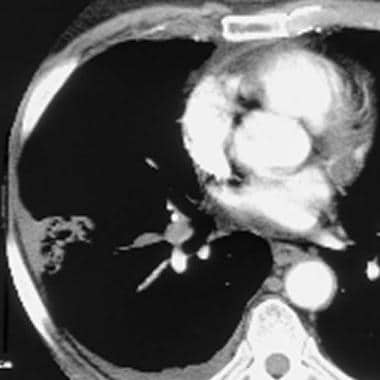
 Computed tomography angiogram in a 69-year-old man with known pulmonary arterial hypertension and a history of chronic pulmonary embolism. This image shows an eccentric mural thrombus with punctate calcification along the anterior wall of the right lower interlobar artery.
Preferred examination
Imaging has played an important role in the diagnosis of PE. For many years, ventilation-perfusion (V/Q) scintigraphy has been the main imaging modality for the evaluation of patients with suspected PE. However, with the advent and widespread availability of faster computed tomography (CT) scanners, CT scanning has emerged as another important diagnostic test for the evaluation of not only PE but also deep venous thrombosis (DVT) in select patients.
In patients with possible PE, chest radiographic findings may indicate whether lung scanning (V/Q) or helical CT scanning should be the next method of evaluation. If the chest radiograph is normal, V/Q findings may be diagnostic; if the chest radiograph is abnormal, helical CT should be performed. [3, 12, 13] A quantitative D-dimer assay is reported to have high negative predictive value and may be effective for excluding the need for pulmonary CTA in select cases. [14] It has been show that using a clinical decision rule with D-dimer level improved pulmonary CTA and better identified positive findings for pulmonary embolism. [15, 16, 17, 18, 19, 20, 21]
Conventional pulmonary angiography is invasive, time consuming, and more expensive than other tests. The role of conventional angiography is limited to patients in whom other results are nondiagnostic or the clinical suspicion is high. [22, 23, 24] Catheter pulmonary angiography has a role in intervention and management only. [25]
In patients with suspected DVT, the workup should start with leg ultrasonography. [25]
The American College of Radiology (ACR) imaging guidelines for suspected PE in patients with a positive D-dimer result or high pretest probability note that multidetector CT pulmonary angiography (CTPA) is highly sensitive and specific. Ultrasound examination is indicated if there are signs and symptoms of deep venous thrombosis. [26]
Limitations of techniques
V/Q findings may be nondiagnostic.
Iodinated contrast agents are needed for helical CT pulmonary angiography, and their use may not be possible in patients with impaired renal function or a severe allergy to the contrast material.
Small (subsegmental) emboli may be missed with CT angiography. Compared with CT scanning, conventional pulmonary angiography requires more expertise and support staff. Conventional angiography is also invasive, time consuming, more expensive, and less widely available. In addition, a chronic central mural thrombus that is easily seen with CT scanning may be missed on pulmonary angiography. [27]
Radiography
Chest radiographs are abnormal in most cases of PE, but the findings are nonspecific. Common radiographic abnormalities include atelectasis, pleural effusion, parenchymal opacities, and elevation of a hemidiaphragm. The classic radiographic findings of pulmonary infarction include a wedge-shaped, pleura-based, triangular opacity with an apex pointing toward the hilus (Hampton hump) or decreased vascularity (Westermark sign). These findings are suggestive of PE but are infrequently observed.
A prominent central pulmonary artery (knuckle sign), cardiomegaly (especially on the right side of the heart), and pulmonary edema are other findings. In the appropriate clinical setting, these findings could be consistent with acute cor pulmonale. A normal-appearing chest radiograph in a patient with severe dyspnea and hypoxemia but without evidence of bronchospasm or a cardiac shunt is strongly suggestive of PE. Generally, chest radiographs cannot be used to conclusively prove or exclude PE; however, radiography and electrocardiography may be useful for establishing alternative diagnoses.
Computed Tomography
Technical advances in CT scanning, including the development of multidetector-array scanners, have led to the emergence of CT scanning as an important diagnostic technique in suspected PE. [28, 29] Contrast-enhanced CT scanning is increasingly used as the initial radiologic study in the diagnosis of PE, especially in patients with abnormal chest radiographs in whom scintigraphic results are more likely to be nondiagnostic. [3, 12, 13] (See the image below.)
Computed tomography angiogram in a 69-year-old man with known pulmonary arterial hypertension and a history of chronic pulmonary embolism. This image shows an eccentric mural thrombus with punctate calcification along the anterior wall of the right lower interlobar artery.
CT scanning shows emboli directly, as does pulmonary angiography, and it is also noninvasive, cheaper, and widely available. CT scanning is the only test that can provide significant additional information related to alternative diagnoses; this is a clear advantage of CT scanning over either pulmonary angiography or scintigraphy. [30]
Because DVT and PE are part of the same disease process, CT venography can easily be performed after CT pulmonary angiography, without the administration of additional contrast material. [24, 31, 32] This study requires only a few extra minutes and allows "one-stop imaging" for PE and DVT.
The technique for CT pulmonary angiography with single-section helical CT involves the following parameters: 3-mm collimation, 2-mm reconstruction interval, pitch of 2, and an average acquisition time of 24 seconds. Iodinated contrast medium is administered as a bolus with an automated injector. Generally, a large volume (100-150 mL) of contrast material is administered at a high flow rate (4 mL/s) for good-quality diagnostic opacification of vessels. [33] Newer third-generation dual-source CT scanners can be used with a high pitch technique that leads to improved image quality with a similar radiation dose. [34]
CT venograms can be acquired 3-4 minutes after the start of the administration of contrast material. The new multidetector-row CT (MDCT) scanners are considerably faster, allowing the performance of thin-section (1.25-mm) helical CT pulmonary angiography during a shorter breath hold (15-17 seconds). With introduction of dual-source CT technology, ECG-gated CTA of the chest may become practical and help provide clinicians with cardiac functional information. Some studies have suggested that pulmonary CTA be preformed in the resting expiratory position, as this allows for improved contrast opacification of the pulmonary arteries and may lead to improved sensitivity of CTPE [35]
In a study by Foti et al in which the diagnostic accuracy of venous-phase dual-energy CT (VP-DECT) was compared with standard CT angiography in the identification of PE, the sensitivity and specificity of the per-patient analysis of VP-DECT images were 90% and 100%, respectively. [36]
Using data from PIOPED (Prospective Investigation of Pulmonary Embolism Diagnosis) II and III, Cronin and Dwamena observed that for a positive test result, multiple-level likelihood ratios were considerably higher for MR pulmonary angiography than for multidetector CT pulmonary angiography. However, they noted that both a positive MRPA and a positive MDCTPA have likelihood ratios greater than 10 and therefore can confirm the presence of PE. Performing venography reduced the likelihood ratio for a positive and negative test for both MDCTPA and MRPA. [37]
Efforts should be made to minimize the radiation dose by using all available equipment-specific dose reduction techniques.
When a PE is identified, it is characterized as acute or chronic. An embolus is acute if it is situated centrally within the vascular lumen or if it occludes a vessel (vessel cutoff sign; see the image below). Acute PE commonly causes distention of the involved vessel.
Computed tomography angiogram in a 53-year-old man with acute pulmonary embolism. This image shows an intraluminal filling defect that occludes the anterior basal segmental artery of the right lower lobe. Also present is an infarction of the corresponding lung, which is indicated by a triangular, pleura-based consolidation (Hampton hump).
An embolus is chronic if (1) it is eccentric and contiguous with the vessel wall (see the image below), (2) it reduces the arterial diameter by more than 50%, (3) evidence of recanalization within the thrombus is present, and (4) an arterial web is present.
Computed tomography angiography in a young man who experienced acute chest pain and shortness of breath after a transcontinental flight. This image demonstrates a clot in the anterior segmental artery in the left upper lung (LA2) and a clot in the anterior segmental artery in the right upper lung (RA2).
A PE is further characterized as central or peripheral, depending on the location or the arterial branch involved.
Central vascular zones include the following:
-
The left and right main pulmonary arteries
-
The anterior trunk
-
The right and left interlobar arteries
-
The left upper lobe trunk
-
The right middle lobe artery
-
The right and left lower lobe arteries
Peripheral vascular zones include the following:
-
The segmental and subsegmental arteries of the right upper lobe
-
The right middle lobe
-
The right lower lobe
-
The left upper lobe
-
The lingula
-
The left lower lobe
There is ongoing research in the field of postprocessing of CT scan data for acute PE, one dealing with the detection of perfusion defects as an adjunct to transverse CT scans for detection of small peripheral PE and another focusing on the automatic computer-aided detection of endoluminal clots.
Degree of confidence
In most cases, when spiral CT scan findings are positive for PE, the emboli are multiple, with intraluminal filling defects observed in the larger central arteries and in the segmental and subsegmental vessels. [38] An apparent filling defect in a single segmental or (especially) subsegmental vessel can be challenging. One should consider all the pitfalls, especially those related to volume-averaging artifacts, before diagnosing an isolated subsegmental embolus. The emboli are often bilateral and more common in the arteries to the lower lobes.
The sensitivity of spiral CT scanning in the evaluation of central PE is as high as 100%. However, it is reportedly variable and lower (see the table below). Also, the reported incidence of isolated subsegmental PEs varies from 5% in the Prospective Investigation of Pulmonary Embolism Diagnosis (PIOPED) study to 36% in another study. [13] Moreover, the true significance of small emboli has not been proven conclusively. Small thromboemboli may have clinical significance in patients with limited cardiopulmonary reserve.
Pulmonary angiography demonstrates subsegmental vessels in more detail than does CT scanning, although the superimposition of the small vessels remains a limiting factor. As a result, the interobserver agreement rate for isolated subsegmental PE is only 45%. [39]
Investigators have reported uneventful clinical outcomes in patients (with a negative predictive value of 99%) in whom CT scans were interpreted as negative for PE and who were not treated with anticoagulation or catheter-directed pharmacologic thrombolysis. The outcome was similar to the outcomes of patients with clinically suspected PE but without emboli on pulmonary arteriograms. This finding indicates that, although some small emboli may be missed at helical CT scanning, the subsequent morbidity rate with PE does not appear to be high.
The new MDCT scanners are considerably faster, allowing the performance of thin-section (1.25-mm) helical CT pulmonary angiography during a shorter breath hold (15-17 seconds). The segmental and subsegmental vessels are better demonstrated, findings are easier to interpret, and interobserver agreement is improved with this technique.
Although MDCT increases diagnostic capabilities, the large amount of data (a thin-section 16-detector row CT pulmonary angiography results in 500-600 axial slices) generated puts a substantial strain on any image analysis and archiving system. Development of dedicated algorithms for computer-aided detection and greater use of maximum intensity projection reconstruction techniques may be helpful in the future for identification of pulmonary emboli in large-volume MDCT data sets.
Table. Accuracy of helical CT* pulmonary angiography (Open Table in a new window)
Reference |
No. of Patients |
Sensitivity, % |
Specificity, % |
Collimation and Anatomic level |
Remy-Jardin et al [40] |
42 |
100 |
96 |
5 mm, segmental |
Goodman et al [41] |
20 |
86 |
92 |
5 mm, segmental |
Remy-Jardin et al [30] |
75 |
91 |
78 |
3 and 5 mm, segmental |
Mayo et al [42] |
142 |
87 |
95 |
3 mm, segmental |
Garg et al [43] |
54 |
67 |
100 |
3 mm, subsegmental |
Drucker et al [44] |
47 |
53-60 |
81-97 |
5 mm, segmental |
*Single-slice CT scanners. The accuracy with newer MDCT scanners is reported to be higher. |
||||
The pitfalls of CT scanning, especially those related to volume averaging of perivascular tissue, branching points, and nonvertical vessels, can be limited by using a trackball on a workstation and by knowing the vascular anatomy. The lymphatic and connective tissue, more commonly adjacent to central vessels, are located between the artery and the bronchus. (See the image below.)
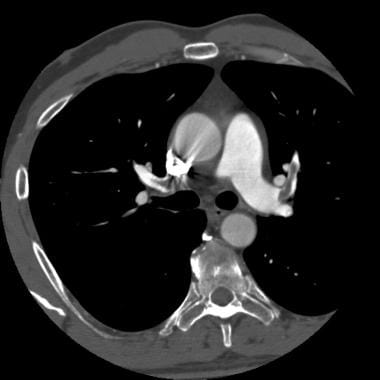
 Computed tomography angiogram in a 55-year-old man with possible pulmonary embolism. This image was obtained at the level of the lower lobes and shows perivascular segmental enlarged lymph nodes as well as prominent extraluminal soft tissue interposed between the artery and the bronchus.
Flow-related and motion artifacts can result in pseudofilling defects and should be kept in mind when the quality of study is evaluated and when the image is interpreted. Flow-related pseudofilling defects can also result in false-positive findings on the CT venogram.
Overall, findings in 2-4% of CT pulmonary angiographic examinations are nondiagnostic because of severe motion artifacts (severe dyspnea) or poor venous access. [45] In 8-10% of examinations, the scans are suboptimal in quality; these allow for confident evaluation of only the central pulmonary arteries. In addition to CT pulmonary angiograms, CT venograms obtained may be useful in patients with a nondiagnostic angiogram, particularly if it is positive for DVT. (See the image below.)
 Computed tomography venograms in a 65-year-old man with possible pulmonary embolism. This image shows acute deep venous thrombosis with intraluminal filling defects in the bilateral superficial femoral veins.
Magnetic Resonance Imaging
Few investigators have reported the feasibility of magnetic resonance imaging (MRI) in the evaluation of PE. However, the role of MRI is mostly limited to the evaluation of patients who have impaired renal function or other contraindications for the use of iodinated contrast material. [46, 47] Newer blood-pool contrast agents and respiratory navigators may enhance the role of MRI in the diagnosis of PE.
PIOPED III (Prospective Investigation of Pulmonary Embolism Diagnosis III) was a multicenter study designed to assess the sensitivity and specificity of MR angiography, alone or with MR venography, for diagnosing PE and venous thromboembolism. [48] This was the first large-scale attempt to evaluate the use of MR imaging to diagnose PE. This study concluded that technically adequate MR angiography alone had a sensitivity of 78% and a specificity of 99%, while combined technically adequate MR angiography/MR venography had a sensitivity of 92% and a specificity of 96%, but 52% of patients (194 of 370) had technically inadequate results. Despite advances in MR imaging, PIOPED III revealed that technical inadequacy in 25% of all patients limits the large-scale use of MR angiography and combined MR angiography/MR venography for pulmonary embolus imaging.
Angiography
The PIOPED trial was a multi-institutional study of V/Q scanning and pulmonary angiography. [49] The investigators revealed that a V/Q scan with normal findings virtually excludes PE and that a scan with high-probability findings is virtually diagnostic for the disease. However, the diagnosis was established or excluded in only 174 (24.4%) of 713 patients—that is, those with scans showing clear and concordant clinical and lung findings. Most patients, including those with underlying cardiopulmonary disease, had indeterminate or nondiagnostic V/Q findings and required additional imaging. Therefore, in patients with abnormal chest radiographs, the use of helical CT scanning rather than scintigraphy as the primary screening test is reasonable.
A second group of PIOPED investigators (PIOPED II) formulated recommendations based on their own studies as well as others. [13] The authors included information regarding clinical probability assessment scoring indexes, as well as empirical assessment, flowcharts, and various patient scenarios (eg, patients with impaired renal function, pregnant patients, etc).
-
Computed tomography angiogram in a 53-year-old man with acute pulmonary embolism. This image shows an intraluminal filling defect that occludes the anterior basal segmental artery of the right lower lobe. Also present is an infarction of the corresponding lung, which is indicated by a triangular, pleura-based consolidation (Hampton hump).
-
Computed tomography angiography in a young man who experienced acute chest pain and shortness of breath after a transcontinental flight. This image demonstrates a clot in the anterior segmental artery in the left upper lung (LA2) and a clot in the anterior segmental artery in the right upper lung (RA2).
-
Computed tomography angiogram in a 69-year-old man with known pulmonary arterial hypertension and a history of chronic pulmonary embolism. This image shows an eccentric mural thrombus with punctate calcification along the anterior wall of the right lower interlobar artery.
-
Computed tomography angiogram in a 55-year-old man with possible pulmonary embolism. This image was obtained at the level of the lower lobes and shows perivascular segmental enlarged lymph nodes as well as prominent extraluminal soft tissue interposed between the artery and the bronchus.
-
Computed tomography venograms in a 65-year-old man with possible pulmonary embolism. This image shows acute deep venous thrombosis with intraluminal filling defects in the bilateral superficial femoral veins.
Tables
Reference |
No. of Patients |
Sensitivity, % |
Specificity, % |
Collimation and Anatomic level |
Remy-Jardin et al [40] |
42 |
100 |
96 |
5 mm, segmental |
Goodman et al [41] |
20 |
86 |
92 |
5 mm, segmental |
Remy-Jardin et al [30] |
75 |
91 |
78 |
3 and 5 mm, segmental |
Mayo et al [42] |
142 |
87 |
95 |
3 mm, segmental |
Garg et al [43] |
54 |
67 |
100 |
3 mm, subsegmental |
Drucker et al [44] |
47 |
53-60 |
81-97 |
5 mm, segmental |
*Single-slice CT scanners. The accuracy with newer MDCT scanners is reported to be higher. |
||||