Practice Essentials
Oligodendroglioma is a well-differentiated, diffusely infiltrating tumor of adults that is typically located in the cerebral hemispheres and is predominantly composed of cells that morphologically resemble oligodendroglia. [1, 2] The hallmark molecular feature is deletion of the 1p and 19q chromosome arms. [3] According to several studies, survival in patients with oligodendrogliomas is not correlated with tumor location or surgical removal. Rather, survival seems to be primarily correlated with the histologic features, clinical findings (age at onset, epilepsy vs deficit), and radiologic criteria (especially contrast enhancement and perfusion-weighted imaging). [4, 5, 6, 7]
In the World Health Organization (WHO )classification, oligodendrogliomas are generally described as low-grade WHO grade II neoplasms that are slow-growing and have a favorable treatment response as compared to other gliomas. Grade III anaplastic oligodendroglioma is more malignant with a less favorable prognosis. [8, 9, 10, 11, 12] Median survival time for patients with oligodendrogliomas WHO grade III has been shown to be 12-14 years, with longer survival for patients with oligodendroglioma WHO grade II. [13, 14]
Oligoendrogliomas often involve the cortical gray matter and are most commonly seen in the frontal lobes. [8]
Because anaplastic oligoastrocytoma imaging findings mirror those of anaplastic oligodendroglioma, distinction cannot be reliably made on CT or MRI. The imaging features of the 1p/19q codeleted genotype that are considered typical of oligodendroglioma include indistinct tumor margin, heterogeneous signal intensity, and calcifications. [3, 15]
Because of the typically slow growth of oligodendrogliomas, the elapsed time between the initial symptoms and clinical diagnosis may vary from 1 week to 12 years. However, with MRI, this interval has been greatly reduced.Computed tomography (CT) scanning and magnetic resonance imaging (MRI) are complementary techniques for imaging oligodendrogliomas. [16] Tumor calcification is better defined on CT scans than on MRI. [17] MRI is far more efficient than CT scan in brain tumors. [18, 19, 20, 21, 22, 23, 24, 25, 26, 27, 28, 29, 30]
Non-contrast-enhanced CT (NECT) is the initial imaging tool for nonspecific neurologic symptoms, typically because of the need to quickly identify intracranial hemorrhage, ischemic infarction, or other acute abnormality. On NECT, oligodendrogliomas typically appear as a hypodense or isodense peripheral mass. Coarse calcification is also a common finding, seen in up to 90% of cases. [8]
Low-grade and anaplastic oligodendrogliomas can be difficult to differentiate with standard MR imaging characteristics. Dynamic contrast-enhanced (DCE) MRI can assess tumor microvasculature and has demonstrated usefulness in predicting glioma grade and prognosis. [31]
Perfusion-weighted MRI and positron emission tomography (PET) with amino acid tracers can provide complementary diagnostic information. In cases in which histopathologic diagnosis is based on partial tumor resection or biopsy, with subsequent risk for misclassification and undergrading, amino acid PET provides important additional diagnostic accuracy, since hot-spot areas generally represent the most malignant area of tumor. [13]
The most frequent finding with angiography is a vascular void (see the image below). A slight hypervascularization that is suggestive of malignant transformation is seldom seen.
(Examples of oligodendrogliomas are provided below.)
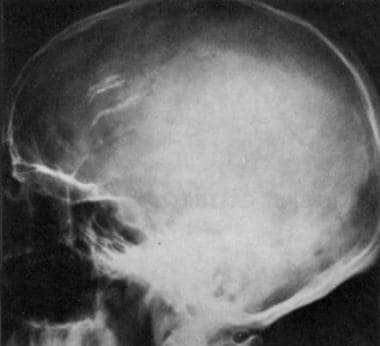 Lateral radiograph of the skull in a 44-year-old man with a 3-year history of epileptic seizures. This radiograph shows a left frontal oligodendroglioma. Note the vermicular calcifications that are projecting on the frontal lobe.
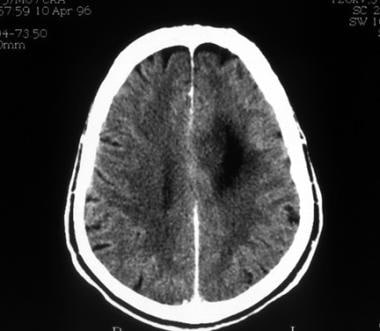 Computed tomography scan of a low-grade oligodendroglioma. This image shows hypoattenuation of the left frontal lobe without contrast enhancement.
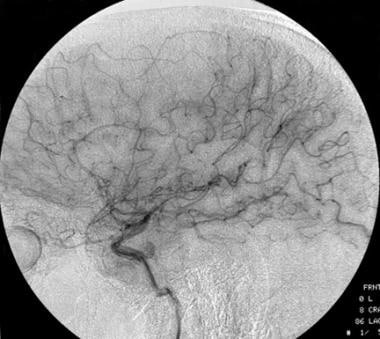 Lateral carotid angiograph of a low-grade oligodendroglioma. This image shows a vascular void due to the tumor.
Treatment
Oligodendrogliomas are indolent tumors; therefore, if patients are asymptomatic, a watchful waiting time is indicated.
Treatment of an oligodendroglioma depends on the presence or absence of symptoms, location, agressiveness, histopathology, and degree of anaplasia of the tumor.
Approximately two thirds of anaplastic oligodendrogliomas and oligoastrocytomas respond to a combination of surgery, radiation, and PCV chemotherapy (procarbazine, CCNU, vincristine). The efficacy of radiotherapy on overall survival has been demonstrated, but the optimal timing is unknown. Although immediate postoperative radiation therapy is indicated for incompletely resected higher-grade oligodendrogliomas, its use for partially resected low-grade tumors is controversial. [32]
One study suggests that patients with oligodendroglioma are at higher risk of developing radiation necrosis (RN) than patients with astrocytoma. In a study of 319 adults with lower-grade diffuse gliomas, 41 patients were identified as having RN (12.9%): 28 patients (21.3%) with oligodendroglioma and 13 (6.9%) with astrocytoma. Patients with oligodendroglioma who received more than 54 Gy had a higher incidence (31.2%) than those receiving 54 Gy or less (14.3%). RN usually appeared within 24 months after radiotherapy. [33]
Anticonvulsants and steroids are symptomatic treatments, respectively, acting in brain seizures and swelling.
Computed Tomography
Oligodendrogliomas have the highest frequency of calcification of all brain tumors. CT scanning must be performed before and after the injection of contrast material to avoid missing the presence of calcifications. Typically, a round or oval, well-limited, and fairly large peripheral lesion is revealed. The tumor matrix is either hypoattenuating or isoattenuating and occasionally hyperattenuating because of tumoral hemorrhage or calcification. Tumoral calcification, seen in approximately 40% of patients, is better defined on CT scans than on MRIs. It seems to have no direct correlation with the tumor grade.
Non-contrast-enhanced CT (NECT) is the initial imaging tool for nonspecific neurologic symptoms, typically because of the need to quickly identify intracranial hemorrhage, ischemic infarction, or other acute abnormality. On NECT, oligodendrogliomas typically appear as a hypodense or isodense peripheral mass. Coarse calcification is also a common finding, seen in up to 90% of cases. [8]
Calvarial erosion in association with slow-growing, peripherally located oligodendrogliomas is occasionally noted. Calvarial erosion also appears to be independent of the tumor grade. Contrast enhancement is sometimes difficult to visualize because of the presence of calcification.
(See the images below.)
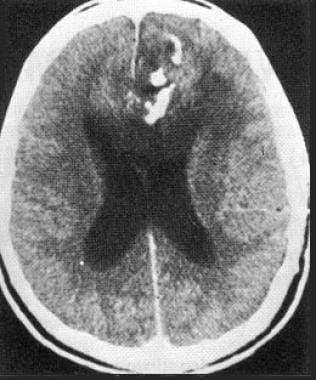 Contrast-enhanced computed tomography scan in a 44-year-old man with a 3-year history of epileptic seizures. The patient has a left frontal oligodendroglioma. This image reveals a calcified hypoattenuating lesion that is invading the corpus callosum.
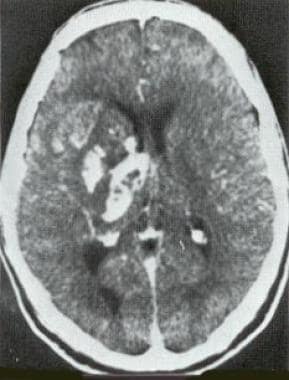 Contrast-enhanced computed tomography scan in a 50-year-old man. This image reveals recurrence of a frontal oligodendroglioma in the right basal ganglia that was excised 6 years earlier.
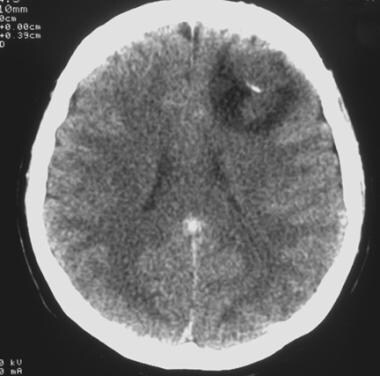 Computed tomography scan of a low-grade oligodendroglioma. This image reveals a well-demarcated, left frontal hypoattenuating lesion with a small calcification.
Computed tomography scan of a low-grade oligodendroglioma. This image shows hypoattenuation of the left frontal lobe without contrast enhancement.
Computed tomography scan of a low-grade oligodendroglioma. This image reveals a well-demarcated, left frontal hypoattenuating lesion with a small calcification.
Computed tomography scan of a low-grade oligodendroglioma. This image shows hypoattenuation of the left frontal lobe without contrast enhancement.
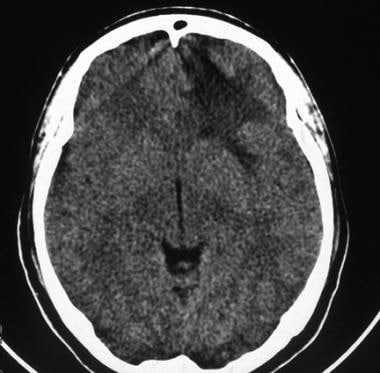 Computed tomography scan of a low-grade oligodendroglioma. This image shows left frontal hypoattenuation that mainly involves the white matter.
Magnetic Resonance Imaging
MRI protocol and standard imaging
Oligodendrogliomas do not behave specifically; they are usually heterogeneous but have a relatively low intensity on T1-weighted sequences and a high intensity on T2-weighted sequences. Peritumoral edema is nicely depicted with T2-weighted sequences and with fluid-attenuated inversion recovery (FLAIR) sequences, which are sensitive, but surrounding vasogenic edema is not common in oligodendrogliomas. Perifocal edema is less often observed in low-grade oligodendrogliomas. Small cystic-appearing regions and hemorrhage are commonly found in the mass. Examples of low-grade oligodendrogliomas are presented below. [18, 27, 28]
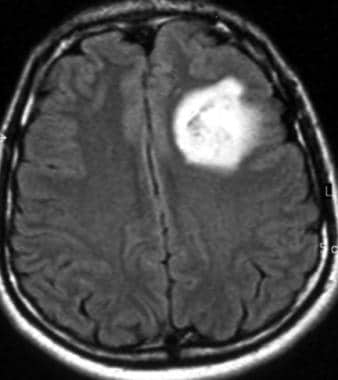 Axial fluid-attenuated inversion recovery magnetic resonance imaging scan of a low-grade oligodendroglioma (same patient as in the 2 Images that follow). This image shows heterogeneous high signal intensity in the left frontal lobe.
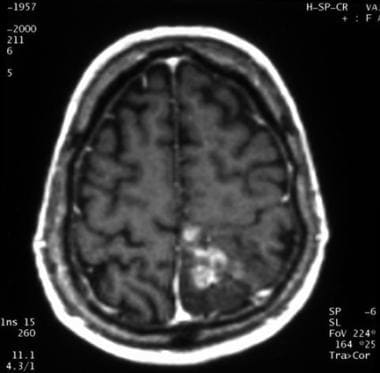
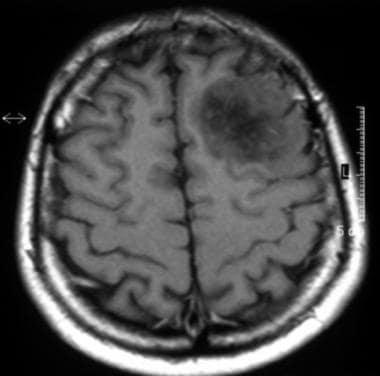 Axial T1-weighted magnetic resonance image of a low-grade oligodendroglioma. This image shows heterogeneous low signal intensity in the left frontal lobe that involves the cortex and white matter. Note the mass effect on the cortical sulci.
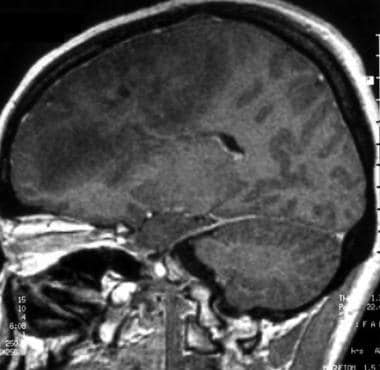
 Sagittal gadolinium-enhanced T1-weighted magnetic resonance image of a low-grade oligodendroglioma. This image demonstrates no contrast enhancement.
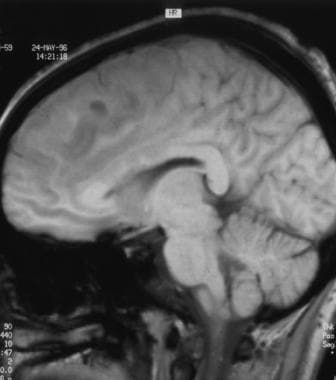 Sagittal T1-weighted sequence magnetic resonance of a low-grade oligodendroglioma (same patient as in the 4 images that follow). This image shows heterogeneous low signal intensity involving the frontal lobe. Note the involvement of the corpus callosum.
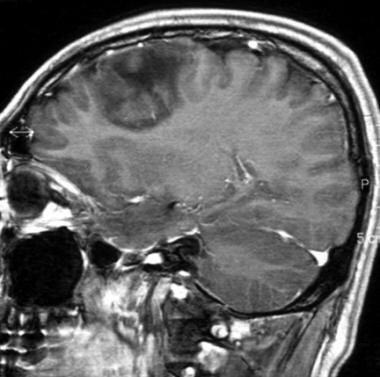
 Sagittal gadolinium-enhanced T1-weighted magnetic resonance image of a low-grade oligodendroglioma. This image shows a huge infiltrative lesion in the frontal lobe, no contrast enhancement, and a mass effect on the cortical sulci.
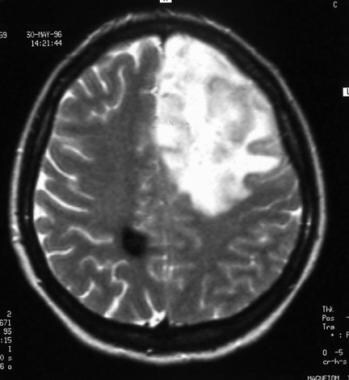 Axial T2-weighted sequence magnetic resonance image of a low-grade oligodendroglioma. This image shows heterogeneous high signal intensity in the left frontal lobe and low signal intensity in the white matter of the right parietal lobe that corresponds to a cavernous hemangioma.
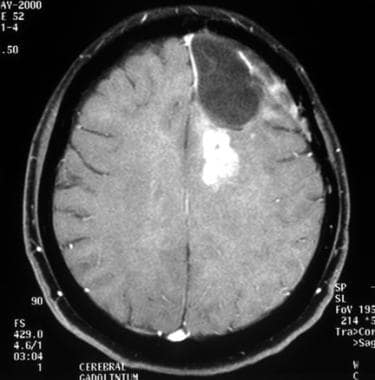 Axial gadolinium-enhanced T1-weighted magnetic resonance image of anaplastic transformation of a low-grade oligodendroglioma, 4 years later. This image depicts local recurrence after surgery, with contrast enhancement in the left frontal lobe.
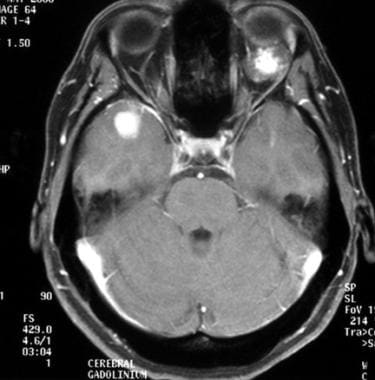 Axial gadolinium-enhanced T1-weighted magnetic resonance image of anaplastic transformation of a low-grade oligodendroglioma, 4 years later. This image shows multifocal recurrence. A contrast-enhanced tumoral nodule is seen in the right temporal lobe. Note the left retro-ocular cavernous hemangioma.
Studies have shown that the growth of low-grade glioma is continuous and constant at a rate of 4-5 mm/year. It appears to be a valuable parameter for evaluating the response to chemotherapy as well as in estimating prognosis. Tumor growth rate seems to be a robust and simple parameter for prediction of anaplastic shift. [19]
Contrast enhancement is better seen with MRI than with CT scanning, [34, 35, 36, 20] especially with magnetization-transfer, T1-weighted spin-echo MRI sequences after gadolinium enhancement. The importance of contrast enhancement for the prognosis of these tumors has been emphasized because it seems to be the strongest negative factor affecting survival.
In enhancing oligodendrogliomas, completely resecting enhancing tissue independently improves outcome, irrespective of histologic grade or genetic status. This finding supports aggressive resection and may impact treatment planning for patients with these tumors. [21] Because the detection of contrast enhancement is of paramount importance, postcontrast MRI is always performed.
Note that gadolinium enhancement has limitations in that it identifies the presence of an abnormal blood-brain barrier or a neoangiogenesis rather than physiology, histology, genetic aberrations, or molecular events.
Morphologic criteria important to describe on standard imaging are as follows:
-
Tumoral signal - Homogeneous or heterogeneous
-
Necrosis
-
Tumoral limits
-
Edema
-
Mass effect
-
Hemorrhage
-
Flow voids
-
Contrast enhancement is not a specific finding for simply discriminating low-grade from anaplastic oligodendrogliomas.
-
Tumoral size
In summary, the minimal MRI protocol should be T1-weighted imaging, T2-weighted imaging, FLAIR, susceptibility-weighted imaging (SWI), T1-weighted imaging after gadolinium injection (3-dimensional T1), and diffusion-weighted imaging.
MR spectroscopy and perfusion-weighted imaging are additional techniques.
Images of an anaplastic oligodendroglioma are presented below. [35]
 Axial gadolinium-enhanced T1-weighted magnetic resonance image of an anaplastic oligodendroglioma (same patient as in the image that follows). This image shows heterogeneous contrast enhancement in the medial part of the left parieto-rolandic region.
 Axial T1-weighted gadolinium-enhanced magnetic resonance image of an anaplastic oligodendroglioma, 2 months after chemotherapy. This image shows disappearance of the contrast enhancement.
Magnetic resonance spectroscopy (long and short echo time, spectroscopic imaging)
Magnetic resonance spectroscopy (MRS) provides information about tissue composition. Advanced spectroscopic methods can quantify markers of tumor metabolism, membrane turnover and proliferation (choline), energy homeostasis (creatine), intact glioneural structures (N-acetyl-aspartate), and necrosis (lactate or lipids). Data can be acquired with 2D or 3D techniques. Increased concentration of choline (cho), raised or reduced creatine (cr) concentrations, and decreased NAA (N-acetyl-aspartate) concentrations from baseline can usually be found in untreated malignant gliomas.
In clinical practice, MRS is technically challenging because of the need to suppress or exclude signal contamination from tissues adjacent to the tumor and treatment bed, such as lipids (from the scalp) and water (from the ventricles). Surgical clips from adjacent craniotomy and tumoral blood also disrupt the local field homogeneity and may affect the quality of data.
Reduced NAA and increased choline were found in all grade II glioma subtypes (oligodendrogliomas, astrocytoma,s and oligoastrocytomas). [37] No significant differences in individual metabolite values were found between subtypes. Usually lactates are higher for grade III and grade IV glioma, and lipids are significantly elevated for grade IV glioma.
The oligodendroglioma is ambiguous on histopathology and on MRS. The choline peak may be very highly elevated, creatine may be normal, and lactate may be present—all features of a more malignant neoplasm—yet the prognosis is generally more favorable than that of astrocytoma. [38]
The role of myoinositol (mI) in low-grade gliomas remains controversial. One study showed that low-grade oligodendrogliomas may have a higher myoinositol-creatine ratio than astrocytoma. [39] However, previous studies have shown abnormally elevated myoinositol in low-grade astrocytomas and in gliomatosis cerebri.
Perfusion-weighted imaging
Perfusion-weighted imaging can be performed by means of 3 techniques: dynamic susceptibility contrast (DSC) perfusion MR, dynamic contrast enhanced (DCE) MRI, and arterial spin labeling. [40, 41, 42]
Dynamic susceptibility contrast perfusion MR method allows the evaluation of relative cerebral blood volume (rCBV) and cerebral blood flow (rCBF), which are semiquantitative parameters that correlate with the amount of capillaries (tumoral neoangiogenesis). [22] With this technique, differentiating neoangiogenesis from blood-brain barrier rupture is possible. Most oligodendroglial tumors exhibit higher rCBV values than astrocytomas, irrespective of tumoral grade. Oligodendroglial tumors with loss of heterozygosity (LOH) on 1p/19q have significant higher rCBV values than oligodendroglial tumors without LOH. Consequently, differentiation between high-grade gliomas and low-grade gliomas is difficult when oligodendroglial tumors are included. Some authors showed that the cutoff values of 2.14 and 2.33 for rCBV and cho/cr ratios, respectively, yielded the highest accuracy in differentiation of high-grade from low-grade oligodendroglial tumors. [43]
Dynamic contrast-enhanced MRI can evaluate the permeability of glioma microvasculature. The values for the volume transfer constant (K trans) and volume of extravascular extracellular space per unit volume of tissue (Ve) correlate with glioma grade. [44, 45, 46] Low-grade and anaplastic oligodendrogliomas can be difficult to differentiate with standard MR imaging characteristics.
Dynamic contrast-enhanced (DCE) MRI can assess tumor microvasculature and has demonstrated usefulness in predicting glioma grade and prognosis. [31]
Arterial spin-labeling perfusion is a quantitative noninvasive alternative to dynamic susceptibility contrast perfusion MR. [23, 47] In arterial spin-labeling techniques, arterial blood water is magnetically labeled using radiofrequency irradiation. Arterial spin-labeling MRI, measurements of cerebral blood flow (without gadolinium injection), have been validated. Tumor vascularization and perfusion tend to increase with tumor grade and brain tumor blood flow measured by arterial spin labeling. MRI has been shown to correlate with tumoral grade. [24]
Diffusion-weighted imaging, apparent diffusion coefficient (ADC)
Apparent diffusion coefficient (ADC) maps obtained from diffusion-weighted imaging provide physiologic information by detecting regional variation in the diffusion of free water within brain tissue. [48] Holodny et al showed that ADC maps in patients with brain tumors provide unique information that is analogous to FDG-PET. They concluded in their study that ADC maps can serve to approximate tumor grade and predict survival. Their data demonstrate that there is a large overlap between increased FDG-PET uptake and restricted diffusion as measured by ADC maps. [48]
The possible explanations for this phenomenon are as follows:
-
Increased metabolism and increased cellularity: Increased FDG-PET uptake measures increased glycolysis, which is due to increased metabolic activity in high-grade tumors, a phenomenon known as the Warburg effect. It is possible that areas of increased metabolic activity correspond to areas of high tumor cellularity and lead to restricted diffusion on ADC maps.
-
Ischemia: The high correlation of increased FDG-PET uptake and decreased signal intensity on an ADC map may be due to the consequence of ischemia.
One problem must be underlined; a restriction of the diffusion in a glioma may be due to successful treatment effect or malignant transformation. In such a case, the clinical history would serve as a valuable adjunct.
Other studies have reported that ADC is inversely correlated with tumor cellularity. Higher ADC is seen in astrocytomas and lower in oligodendrogliomas.
Furthermore, the median nADC value within the T2 lesion could be used to classify the histology of the oligodendroglioma and astrocytoma (grade II) and to distinguish mixed oligo-astrocytoma, which have the favorable prognostic marker (1p/19q). The threshold of 1.8 median nADC within the T2 lesion is used in some studies (lower in oligodendroglioma than in astrocytoma grade II and lower in mixed oligo-astrocytoma with deletions in chromosome 1p, 19q). [25]
Thus, rCBV and the median ADC provide useful information for distinguishing oligodendrogliomas from astrocytomas. [37]
Radiologic markers of malignancy are restricted diffusion, gadolinium enhancement, and FDG uptake (fluorodeoxy-glucose-positron-emission tomography [FDG-PET]).
(See the images below.)
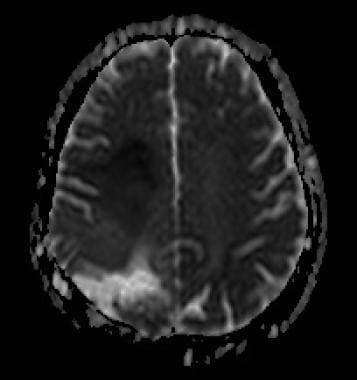 ADC map. Restricted diffusion at the anterior part of the tumor (hyposignal) due to increased cellularity.
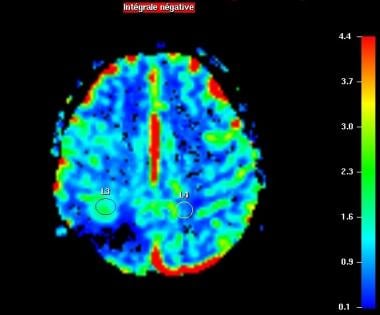 Perfusion-weighted imaging. Relative CBV map. Increased regional CBV forward the surgical site (L3).
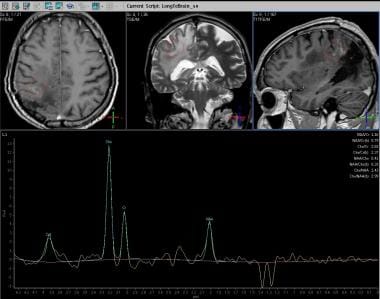 Spectroscopy (long echo time). Increased concentration of choline, decreased NAA concentration, and presence of lactate.
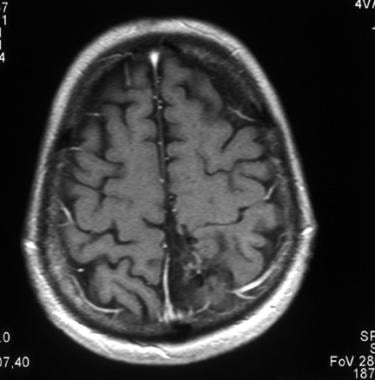
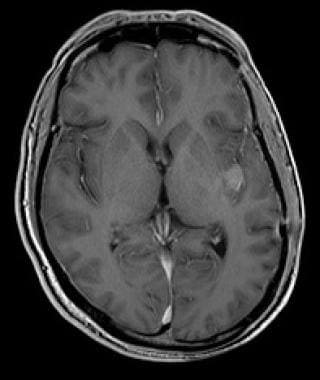 Anaplastic oligodendroglioma with enhancement of insular cortex. T1-weighted image with gadolinium enhancement of insular cortex.
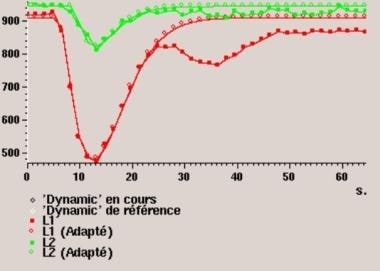 Anaplastic oligodendroglioma with enhancement of insular cortex. Perfusion-weighted imaging shows increased regional blood volume correlated with tumoral neoangiogenesis.
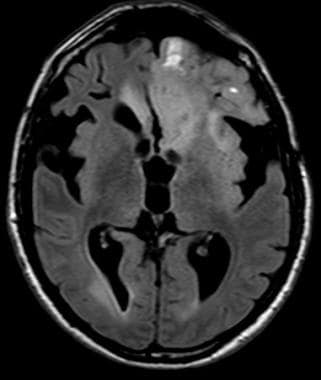
 Anaplastic frontal oligodendroglioma with hemorrhage; fluid-attenuated inversion recovery (FLAIR).
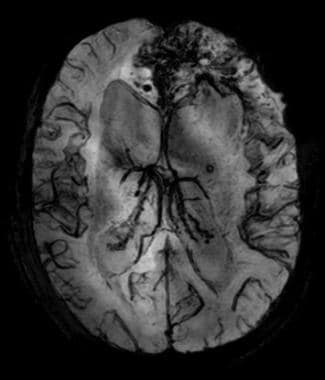 Anaplastic frontal oligodendroglioma with hemorrhage; susceptibility-weighted imaging (SWI). Hemorrhage is obvious on SWI.
Post-therapeutic modifications
Radiation therapy
Some radiologic modifications can be seen after radiation therapy: early high signal on T2-weighted imaging.
Some complications can occur: radiation necrosis, leukoencephalopathy, and atrophy.
Radiation necrosis is characterized by hypoperfusion on perfusion-weighted imaging [49] , increased lactates and normal choline on spectroscopic imaging.
Leukoencephalopathy is characterized by diffuse, symmetric, white-matter damage sparing U fibers (high signal on T2 and FLAIR imaging).
Antiangiogenic therapies
Macdonald et al reported criteria for response assessment in glioma based on enhancing tumor area as a primary measure. Macdonald's criteria define disease progression as an increase in enhancing tumor area of more than 25% or the appearance of new enhancing lesions. If no enhancement is present at postoperative imaging study, any enhancement on subsequent scans—no matter how small or nonspecific—by definition implies tumor progression [50] However, studies of patients with gliomas treated by chemoradiation and temozolomide have shown that after the end of radiotherapy, 20-30% of patients experience pseudoprogression with an increase of enhancement, subsiding spontaneously.
New antiangiogenic treatments modify the significance of contrast enhancement: they lead to a rapid decrease of contrast enhancement on gadolinium T1-weighted imaging but do not reflect a real decrease in tumor activity or size. [50] Relapses in patients treated by antiangiogenic treatments are visible as a growth of an abnormal area on fluid-attenuated inversion recovery (FLAIR) or T2-weighted images without contrast enhancement. These enlarged regions can be distant to the primary site of the tumor and can resemble gliomatosis cerebri. Thus, conventional magnetic resonance imaging is not appropriate for the assessment of treatment response to antiangiogenic therapies. Another issue is the occurrence of rebound enhancement and edema on discontinuation of the antiangiogenic treatment.
Necessity of early MRI after surgery (1-3 days after surgery)
Early MRI is an accurate technique for monitoring the extentof malignant glioma surgical resection and provides a good correlation with prognosis. [51] Furthermore, gross total tumor resection is associated with longer survival in patients with glioblastoma multiforme. [52]
In a series of 39 children with malignant gliomas, the extent of resection was one of the strongest predictors of outcome. [53] Postoperative residual tumor was evaluated by early MRI (within 72 hours postoperatively) in this study. A postoperative MRI is necessary within 72 hours, with T1-weighted imaging before and after gadolinium injection, T2 and/or FLAIR, perfusion-weighted imaging (rCBV is not increased in scare tissue), metabolic imaging, and probably diffusion-weighted imaging.
Radiologic conclusion
The combined use of extensive molecular profiling and advanced MRI modalities may improve the accuracy of tumor grading, may provide prognostic information, and has the potential to influence treatment decisions. [54]
Gadolinium-based contrast agents have been linked to the development of nephrogenic systemic fibrosis (NSF) or nephrogenicfibrosingdermopathy (NFD). The disease has occurred in patients with moderate to end-stage renal disease after being given a gadolinium-based contrast agent to enhance MRI or MRA scans. NSF/NFD is a debilitating and sometimes fatal disease. Characteristics include red or dark patches on the skin; burning, itching, swelling, hardening, and tightening of the skin; yellow spots on the whites of the eyes; joint stiffness with trouble moving or straightening the arms, hands, legs, or feet; pain deep in the hip bones or ribs; and muscle weakness.
Degree of confidence
Oligodendrogliomas are better defined on MRI than on CT scanning. Many oligodendrogliomas are peripherally situated, and the tumor usually involves the whole thickness of the cortex. MRI is particularly reliable for appreciating cortical involvement. The frontal lobes are most often involved, followed by the temporal, parietal, and occipital lobes.
Occasionally, stereotactic biopsy is performed outside of the area of contrast enhancement, leading to a falsely reassuring diagnosis (ie, low-grade oligodendroglioma). The visualization of such a contrast enhancement on MRI modifies the grading of the tumor, which becomes anaplastic. Gradient-echo sequences are highly sensitive to calcification and therefore are a useful adjunct.
High-grade oligodendrogliomas may be difficult to differentiate from the more frequent glioblastoma multiforme. However, the presence of tumor calcification, a peripheral location, and the sometimes associated calvarial erosion may indicate an oligodendroglioma.
The most difficult lesion to differentiate is the astrocytoma that appears as a hypoattenuating, nonenhancing mass on CT scans. However, these astrocytic tumors tend to be deeper in location, extend along the fiber tracts, and lack calcification.
Two other conditions that must be considered in the differential diagnosis are (1) dysembryoplastic neuroepithelial tumor (partial seizures beginning before 20 years of age, nonneurologic deficit, cortical tumoral topography on MRI) and (2) central neurocytoma (midline tumor). Immunomarkers and electron microscopy may help in the definitive diagnosis.
-
Lateral radiograph of the skull in a 44-year-old man with a 3-year history of epileptic seizures. This radiograph shows a left frontal oligodendroglioma. Note the vermicular calcifications that are projecting on the frontal lobe.
-
Contrast-enhanced computed tomography scan in a 44-year-old man with a 3-year history of epileptic seizures. The patient has a left frontal oligodendroglioma. This image reveals a calcified hypoattenuating lesion that is invading the corpus callosum.
-
Contrast-enhanced computed tomography scan in a 50-year-old man. This image reveals recurrence of a frontal oligodendroglioma in the right basal ganglia that was excised 6 years earlier.
-
Computed tomography scan of a low-grade oligodendroglioma. This image reveals a well-demarcated, left frontal hypoattenuating lesion with a small calcification.
-
Axial fluid-attenuated inversion recovery magnetic resonance imaging scan of a low-grade oligodendroglioma (same patient as in the 2 Images that follow). This image shows heterogeneous high signal intensity in the left frontal lobe.
-
Axial T1-weighted magnetic resonance image of a low-grade oligodendroglioma. This image shows heterogeneous low signal intensity in the left frontal lobe that involves the cortex and white matter. Note the mass effect on the cortical sulci.
-
Sagittal gadolinium-enhanced T1-weighted magnetic resonance image of a low-grade oligodendroglioma. This image demonstrates no contrast enhancement.
-
Computed tomography scan of a low-grade oligodendroglioma. This image shows left frontal hypoattenuation that mainly involves the white matter.
-
Sagittal T1-weighted sequence magnetic resonance of a low-grade oligodendroglioma (same patient as in the 4 images that follow). This image shows heterogeneous low signal intensity involving the frontal lobe. Note the involvement of the corpus callosum.
-
Sagittal gadolinium-enhanced T1-weighted magnetic resonance image of a low-grade oligodendroglioma. This image shows a huge infiltrative lesion in the frontal lobe, no contrast enhancement, and a mass effect on the cortical sulci.
-
Axial T2-weighted sequence magnetic resonance image of a low-grade oligodendroglioma. This image shows heterogeneous high signal intensity in the left frontal lobe and low signal intensity in the white matter of the right parietal lobe that corresponds to a cavernous hemangioma.
-
Axial gadolinium-enhanced T1-weighted magnetic resonance image of anaplastic transformation of a low-grade oligodendroglioma, 4 years later. This image depicts local recurrence after surgery, with contrast enhancement in the left frontal lobe.
-
Axial gadolinium-enhanced T1-weighted magnetic resonance image of anaplastic transformation of a low-grade oligodendroglioma, 4 years later. This image shows multifocal recurrence. A contrast-enhanced tumoral nodule is seen in the right temporal lobe. Note the left retro-ocular cavernous hemangioma.
-
Axial gadolinium-enhanced T1-weighted magnetic resonance image of an anaplastic oligodendroglioma (same patient as in the image that follows). This image shows heterogeneous contrast enhancement in the medial part of the left parieto-rolandic region.
-
Axial T1-weighted gadolinium-enhanced magnetic resonance image of an anaplastic oligodendroglioma, 2 months after chemotherapy. This image shows disappearance of the contrast enhancement.
-
Computed tomography scan of a low-grade oligodendroglioma. This image shows hypoattenuation of the left frontal lobe without contrast enhancement.
-
Lateral carotid angiograph of a low-grade oligodendroglioma. This image shows a vascular void due to the tumor.
-
Classic histologic image of oligodendroglioma. This image shows monomorphous tumoral proliferation that consists of round, regular cells with a small, central, hyperchromatic nucleus surrounded by clear cytoplasm. Few calcifications are present.
-
Smear preparation of well-differentiated oligodendroglioma. This image reveals isolated tumoral cells with regular, round nuclei.
-
Paraffin section of well-differentiated oligodendroglioma. This image shows tumoral cells, some reactional astrocytes, and an absence of vascular proliferation.
-
Smear preparation of anaplastic oligodendroglioma. This image reveals increased nuclear pleomorphism and vascular proliferation.
-
Paraffin section of anaplastic oligodendroglioma. This image shows dense tumoral proliferation with round nuclei, perinuclear halos, calcification, and endothelial hyperplasia.
-
ADC map. Restricted diffusion at the anterior part of the tumor (hyposignal) due to increased cellularity.
-
Perfusion-weighted imaging. Relative CBV map. Increased regional CBV forward the surgical site (L3).
-
Spectroscopy (long echo time). Increased concentration of choline, decreased NAA concentration, and presence of lactate.
-
Anaplastic oligodendroglioma with enhancement of insular cortex. T1-weighted image with gadolinium enhancement of insular cortex.
-
Anaplastic oligodendroglioma with enhancement of insular cortex. Perfusion-weighted imaging shows increased regional blood volume correlated with tumoral neoangiogenesis.
-
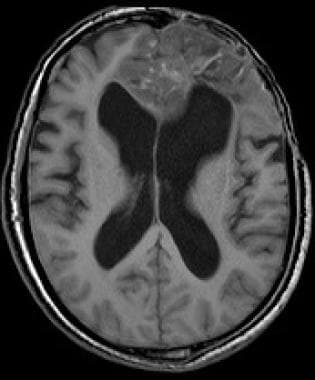
Anaplastic frontal oligodendroglioma with hemorrhage; T1-weighted imaging.
-
Anaplastic frontal oligodendroglioma with hemorrhage; fluid-attenuated inversion recovery (FLAIR).
-
Anaplastic frontal oligodendroglioma with hemorrhage; susceptibility-weighted imaging (SWI). Hemorrhage is obvious on SWI.