Practice Essentials
Hepatocellular adenoma (HCA), or hepatic adenoma, is the third leading benign liver tumor and has bleeding and malignant transformation tendencies. HCA occurs primarily in young females of childbearing age and is associated with oral contraceptive use, steroid drug use, obesity, glycogen storage disease, and iron load in thalassemia. In men, it occurs less often, usually with a history of anabolic steroid use. HCA is classified into 4 molecular subgroups on the basis of genetic and phenotype characteristics: HNF1A mutated adenomas (H-HCA), inflammatory adenomas (I-HCA), unclassified adenomas (U-HCA), and β-catenin activated adenomas (b-HCA). Conventional imaging lacks specificity, making it difficult to differentiate HCA from other intrahepatic diseases, especially focal nodular hyperplasia (FNH). The annual incidence of hepatocellular carcinoma is around 4 per 100,000 per year in developed countries. The presence of multiple HCAs has been termed hepatic adenomatosis. [1, 2, 3, 4, 5, 6]
Two types of hepatic adenoma have been identified: tumors of bile duct origin and tumors of liver cell origin. Hepatic adenomas of bile duct origin are usually smaller than 1 cm and are not of clinical interest; typically, they are found incidentally on postmortem examinations. Hepatic adenomas of liver origin are larger—on average, they measure 8-15 cm—and are often clinically significant.
Preferred examination
A combination of multiphasic computed tomography (CT) scans and gadolinium-enhanced magnetic resonance imaging (MRI) is best to identify and characterize most hepatic lesions. Certain characteristics, such as arterial enhancement and the presence of fat and hemorrhage, suggest that the lesion represents hepatic adenoma. If an enhancing central scar is seen, the diagnosis of focal nodular hyperplasia (FNH) can be made. Nuclear medicine studies can also be helpful. Most hepatic adenomas do not demonstrate uptake on sulfur-colloid and gallium-67 (67Ga) scans. [7, 8, 9, 10, 11, 12, 13]
Contrast-enhanced ultrasound is an appropriate imaging technique for differentiation between FNH and HCA, as well as the subtyping of HCAs, and can complement MRI, as specific combinations of imaging features are associated with the different subtypes. [14, 15, 16, 17, 18]
Although CT scanning, MRI, and nuclear medicine studies may help characterize lesions as adenomas, the findings are frequently nonspecific, and biopsy and/or resection may be necessary.
(See the images below of a patient with hepatic adenoma.)
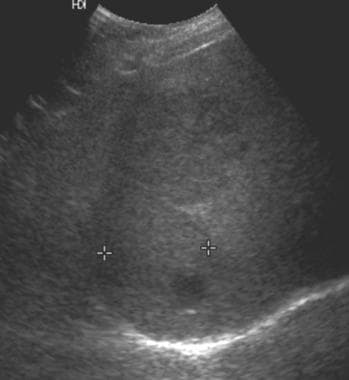 Ultrasound in a patient with von Gierke disease (glycogen storage disease type 1) and several hepatic adenomas. This image shows a mass in the right lobe of the liver that is predominantly isoechoic relative to the liver parenchyma and contains a small, round, hypoechoic component. The 2 masses appear slightly hypoechoic. (Same patient as in the following image.)
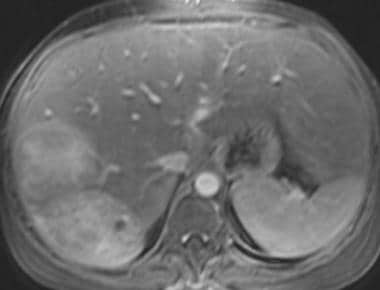
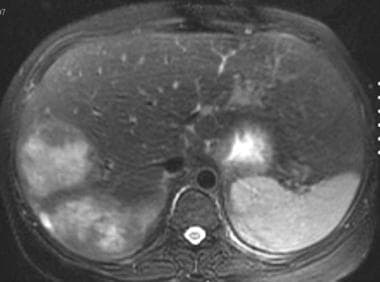 T2-weighted fat-saturated fast spin-echo axial magnetic resonance image in a patient with von Gierke disease. This image shows 2 heterogeneous, hyperintense masses in the right lobe of the liver. (Same patient as in the following image.)
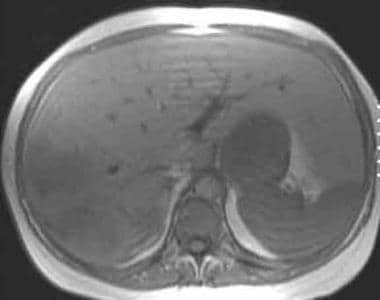 T1-weighted in-phase magnetic resonance image in a patient with von Gierke disease (same patient as in the following image). This image demonstrates normal hepatic signal intensity that is hyperintense relative to the spleen. Two heterogeneous masses that represent hepatic adenomas are seen in the right lobe and are slightly hypointense relative to the liver parenchyma.
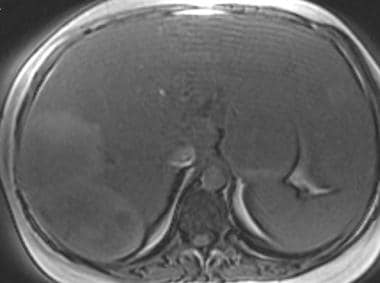 T1-weighted out-of-phase magnetic resonance image in a patient with von Gierke disease (same patient as in the following image). This image shows abnormal low signal intensity of the liver, hypointense relative to the spleen, representing fatty infiltration of the liver. The hepatic adenomas are heterogeneous and slightly hyperintense relative to the fatty liver.
T1-weighted out-of-phase magnetic resonance image in a patient with von Gierke disease (same patient as in the following image). This image shows abnormal low signal intensity of the liver, hypointense relative to the spleen, representing fatty infiltration of the liver. The hepatic adenomas are heterogeneous and slightly hyperintense relative to the fatty liver.
T1-weighted out-of-phase magnetic resonance image in a patient with von Gierke disease (same patient as in the following image). This image shows abnormal low signal intensity of the liver, hypointense relative to the spleen, representing fatty infiltration of the liver. The hepatic adenomas are heterogeneous and slightly hyperintense relative to the fatty liver.
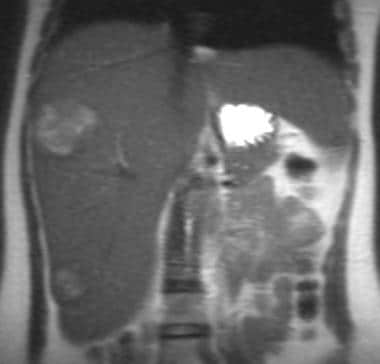 Single-shot fast spin-echo T2-weighted coronal magnetic resonance image in a patient with von Gierke disease (same patient as in the following image). This image shows a hyperintense mass in the right lobe of the liver and an additional hyperintense mass in the inferior tip of the liver, representing a third hepatic adenoma.
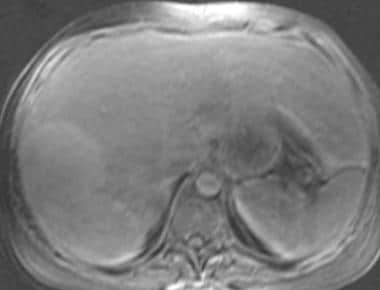 Fat-saturated 3-dimensional T1-weighted gradient-echo magnetic resonance image in a patient with von Gierke disease (same patient as in the following image). This image shows 2 heterogeneous, slightly hyperintense masses in the right lobe of the liver.
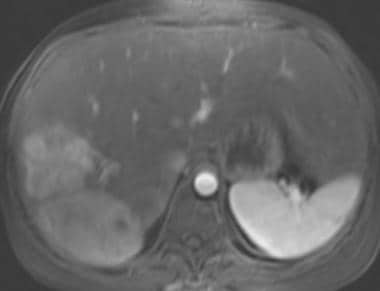 Gadolinium-enhanced fat-saturated 3-dimensional T1-weighted gradient-echo magnetic resonance image in a patient with von Gierke disease (same patient as in the following image). This image shows intense enhancement of the hepatic adenomas.
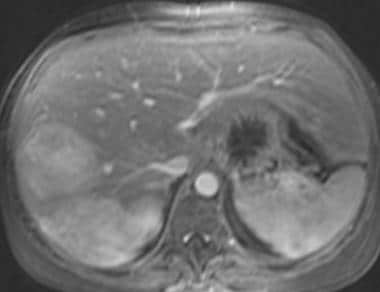 Gadolinium-enhanced fat-saturated 3-dimensional T1-weighted gradient-echo magnetic resonance image in a patient with von Gierke disease. This image shows that the hepatic adenoma remains hyperintense relative to the liver parenchyma. (Same patient as in the following image.)
 Gadolinium-enhanced fat-saturated 3-dimensional T1-weighted gradient-echo magnetic resonance image in a patient with von Gierke disease (same patient in the previous image). This image shows that the hepatic adenoma remains hyperintense relative to the liver parenchyma.
Incidental findings algorithm
The American College of Radiology (ACR) has published an algorithm applied to incidental liver lesions in asymptomatic adult patients (≥18 years of age) for whom CT was requested for an unrelated reason. The algorithm is designed for use in patients with varied underlying risk levels (low versus high) for a malignant hepatic lesion. However, the algorithm should not be applied when index CT (ie, that which demonstrates the incidental lesion) was requested to evaluate a known or suspected liver lesion or hepatic abnormality. There are some hepatic lesions that present with associated vascular invasion, biliary dilation, or adenopathy; patients with these associated findings should be referred directly for oncologic evaluation. [19]
The basic principles of the algorithm are as follows [19] :
-
In a low-risk patient, an incidental hepatic lesion < 1 cm generally does not require further workup and can be considered benign. In instances in which such lesions have suspicious features (ie, ill-defined margins, heterogeneous density, mural thickening or nodularity, or thick septa), MRI should be considered.
-
Incidental hepatic lesions that are ≥1 cm and have distinctly benign imaging features do not require follow-up. Such features include sharp margin, homogeneous low attenuation (≤20 HU) on noncontrast or portal venous–phase imaging, or characteristic features of hemangiomas, focal nodular hyperplasia (FNH), or perfusional changes (including focal fatty sparing or deposition).
-
Incidental hepatic lesions that are ≥1 cm and have suspicious imaging features require further workup with prompt MRI or biopsy, depending on the lesion’s size and features and the patient’s risk level. Suspicious imaging features include ill-defined margins, heterogeneous density, mural thickening or nodularity, thick septa, and intermediate to high attenuation on portal venous–phase imaging (>20 HU, in the absence of pseudoenhancement). If pre- and postcontrast CT is available, enhancement >20 HU is a suspicious feature.
-
"Flash-filling” lesions are classified separately as incidental liver lesions that are characterized by uniform enhancement on arterial-phase imaging (including late arterial/early portal venous–phase imaging), and for which multiphasic imaging is not available to enable definitive characterization. In low-risk patients, they are generally benign; MRI is suggested for follow-up only when they exceed 1.5 cm. In high-risk patients, MRI is advised routinely because of a higher probability of malignancy.
-
If inadequate imaging is available to ascertain the presence of benign versus suspicious features in a ≥1 cm lesion (eg, a homogeneous 3-cm, 40-HU incidental hepatic lesion with a sharp margin on a noncontrast CT), prompt MRI should be considered.
Classification & characteristics
The 3 major subtypes of HCA are (1) the inflammatory/telangiectatic subtype, (2) the steatotic (with HNF1-α gene mutation) subtype, and (3) the subtype with β-catenin activation. An additional unclassified/miscellaneous subgroup is also recognized. [20, 21]
The inflammatory subtype is characterized as follows:
-
Previously misclassified as telangiectatic focal nodular hyperplasia
-
Comprises 40-55% of hepatocellular adenomas
-
Increased risk of bleeding but small risk of malignant transformation
-
Due to mutations involving interleukin-6
-
Strong expression of serum amyloid-associated protein A2 (SAA-2) and C-reactive protein on immunohistochemistry
-
Inflammation and peliosis at histology
The steatotic subtype is characterized as follows:
-
Comprises 35-50% of hepatocellular adenomas
-
No risk of malignant transformation
-
Leads to the development of familial adenomatosis and MODY-3 (maturity-onset diabetes of the young)
-
Lacks expression of liver fatty acid binding protein (LFABP) on immunohistochemistry
The subtype with β-catenin activation is characterized as follows:
-
Comprises 10-18% of hepatocellular adenomas
-
Affects men and women
-
Increased risk of malignancy
-
Associated with androgen therapy and glycogen storage disease
-
Strong diffuse overexpression of glutamine synthetase and nuclear β-catenin staining
Morbidity/mortality
Risk of malignant transformation to hepatocellular carcinoma (HCC) is 4-8%. After stopping the ingestion of oral contraceptives or anabolic steroids, the tumor can regress in size but the risk of malignant transformation remains.
Hemorrhage is one of the most important complications of HCAs, occurring in approximately 10% of patients. The risk of bleeding increases with increasing tumor size (≥4 cm), subcapsular location, and long duration of contraceptive use. Clinically, patients present with severe abdominal pain and possible hemodynamic disorders, or even hypovolemic shock. Fatal cases have been reported in young patients with familial adenomatosis related to HNF-1α mutation and Fanconi anemia, some of them occurring even after androgen therapy discontinuation. [16]
Intervention
Because of the small risk of life-threatening hemorrhage and the risk of malignant transformation, surgical excision is recommended for hepatic adenomas. Successful percutaneous radiofrequency ablation has been reported to be successful in 3 patients. [22] Radiofrequency ablation is less invasive and is an option for patients who cannot undergo surgery or who refuse surgery.
Computed Tomography
Hepatic adenomas are often discovered incidentally on CT scans that are performed for other reasons. Once identified, a multiphasic CT scan should be performed to better characterize most hepatic tumors. Protocols differ from institution to institution.
Typically, helical CT scans are obtained, first of the nonenhanced liver. Then, images are obtained in the hepatic arterial phase using intravenous injection of approximately 120-150 mL of nonionic contrast at a rate of 3-5 mL/s with a 25- to 30-second delay. Images are then acquired in the portal venous phase after a scanning delay of 60-80 seconds.
On CT scans, the most consistent finding in hepatic adenomas is the enhancement pattern. Most lesions (90% according to Ichikawa et al [23] ) show homogeneous enhancement in the hepatic arterial phase. Unfortunately, this feature is not specific to hepatic adenomas, because hepatocellular carcinoma, hypervascular metastases, and focal nodular hyperplasia can demonstrate similar enhancement in the hepatic arterial phase.
(See the CT images below of a patient with hepatic adenocarcinoma.)
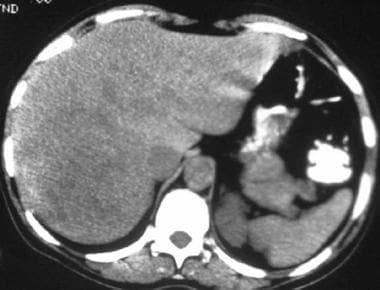 Noncontrast computed tomography scan in a 41-year-old woman with a history of oral contraceptive use. This image demonstrates a heterogeneous, low-attenuation mass in the right lobe of the liver, a hepatic adenoma. (Same patient as in the following image.)
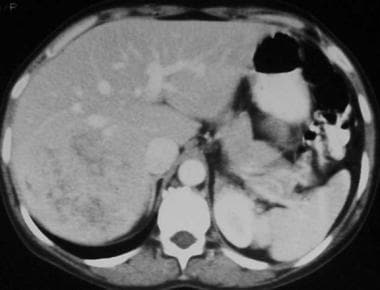 Contrast-enhanced computed tomography scan in the portal venous phase in a 41-year-old woman with a history of oral contraceptive use. This image demonstrates a heterogeneous, enhancing mass, a hepatic adenoma, predominantly isoattenuating relative to the liver with areas of low attenuation. (Same patient as in the following image.)
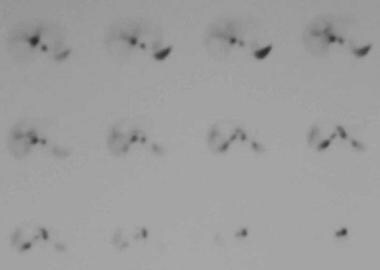 Technetium-99m (99mTc)–labeled red blood cell single-photon emission computed tomography scintigraphy in a 41-year-old woman with a history of oral contraceptive use. This image shows no demonstrable activity in the hepatic mass, indicating that it does not represent a hemangioma. (Same patient as in the previous image.)
Because hepatic adenomas are histologically composed of uniform hepatocytes, most are isoattenuating relative to the healthy liver tissue on nonenhanced scans in the portal venous phase. In a fatty liver, hepatic adenomas usually are hyperattenuating.
The finding of hemorrhage as an area of high attenuation can be seen in as many as 40% of patients. Fat deposition within adenomas is identified on CT scans in only approximately 7% of patients.
Typically, hepatic adenomas have well-defined borders and do not have lobulated contours. A low-attenuation pseudocapsule can be seen in as many as 25% of patients. Coarse calcifications are seen in only 5% of patients.
Magnetic Resonance Imaging
Some MRI findings of hepatic adenomas are similar to CT findings; however, MRI is usually more sensitive in detecting fat and hemorrhage. [24, 7, 11] Hepatic adenomas tend to be hyperintense or isointense relative to the liver tissue on T1-weighted images (up to 93% in a series by Paulson et al [25] ). High signal intensity on T1-weighted images probably relates to the presence of fat or, less commonly, to hemorrhage within the lesion.
Chemical-shift imaging that shows loss of signal on out-of-phase images can confirm the presence of fat. Unfortunately, hepatocellular carcinoma (HCC) is known to contain fat in as many as 40% of lesions; therefore, the presence of fat does not help differentiate the lesions.
Other hepatic lesions can be hyperintense on T1-weighted images, such as melanoma metastases and cavities containing proteinaceous material. On T2-weighted images, hepatic adenomas are most often slightly hyperintense relative to liver tissue. This finding is not specific because many hepatic lesions, including HCC and metastases, are hyperintense on T2-weighted images.
(See the images below.)
T2-weighted fat-saturated fast spin-echo axial magnetic resonance image in a patient with von Gierke disease. This image shows 2 heterogeneous, hyperintense masses in the right lobe of the liver. (Same patient as in the following image.)
T1-weighted in-phase magnetic resonance image in a patient with von Gierke disease (same patient as in the following image). This image demonstrates normal hepatic signal intensity that is hyperintense relative to the spleen. Two heterogeneous masses that represent hepatic adenomas are seen in the right lobe and are slightly hypointense relative to the liver parenchyma.
T1-weighted out-of-phase magnetic resonance image in a patient with von Gierke disease (same patient as in the following image). This image shows abnormal low signal intensity of the liver, hypointense relative to the spleen, representing fatty infiltration of the liver. The hepatic adenomas are heterogeneous and slightly hyperintense relative to the fatty liver.
Single-shot fast spin-echo T2-weighted coronal magnetic resonance image in a patient with von Gierke disease (same patient as in the following image). This image shows a hyperintense mass in the right lobe of the liver and an additional hyperintense mass in the inferior tip of the liver, representing a third hepatic adenoma.
Fat-saturated 3-dimensional T1-weighted gradient-echo magnetic resonance image in a patient with von Gierke disease (same patient as in the following image). This image shows 2 heterogeneous, slightly hyperintense masses in the right lobe of the liver.
Gadolinium-enhanced fat-saturated 3-dimensional T1-weighted gradient-echo magnetic resonance image in a patient with von Gierke disease (same patient as in the following image). This image shows intense enhancement of the hepatic adenomas.
Gadolinium-enhanced fat-saturated 3-dimensional T1-weighted gradient-echo magnetic resonance image in a patient with von Gierke disease. This image shows that the hepatic adenoma remains hyperintense relative to the liver parenchyma. (Same patient as in the following image.)
Gadolinium-enhanced fat-saturated 3-dimensional T1-weighted gradient-echo magnetic resonance image in a patient with von Gierke disease (same patient in the previous image). This image shows that the hepatic adenoma remains hyperintense relative to the liver parenchyma.
Heterogeneity, defined as any difference of a signal within a lesion on T1-weighted or T2-weighted images, is seen in approximately one half of patients. Heterogeneity relates to the presence of either hemorrhage or necrosis. This finding is not specific, as HCC and metastases can bleed and become necrotic. Although uncommon, focal nodular hyperplasia (FNH) also can be hemorrhagic.
A peripheral rim corresponding histologically to a pseudocapsule is seen in 17-31% of patients. Signal characteristics of the rim are variable. Most often, the peripheral rim, when seen, is of low signal intensity on T1-weighted images, is of variable intensity on T2-weighted images, and usually does not enhance.
After gadolinium administration, the pattern of enhancement is similar to that of CT scans. Most hepatic adenomas show intense enhancement in the arterial phase and are isointense relative to the liver tissue on delayed imaging.
Gadolinium-based contrast agents have been linked to the development of nephrogenic systemic fibrosis (NSF) or nephrogenic fibrosing dermopathy (NFD). NSF/NFD has occurred in patients with moderate to end-stage renal disease after being given a gadolinium-based contrast agent to enhance MRI or MRA scans. NSF/NFD is a debilitating and sometimes fatal disease. Characteristics include red or dark patches on the skin; burning, itching, swelling, hardening, and tightening of the skin; yellow spots on the whites of the eyes; joint stiffness with trouble moving or straightening the arms, hands, legs, or feet; pain deep in the hip bones or ribs; and muscle weakness.
Hepatic adenomas, unlike FNH, do not have a central scar. If a low signal intensity scar is seen on T1-weighted images and the scar enhances after gadolinium is administered, the diagnosis of FNH is strongly favored. A central scar has never been reported in a hepatic adenoma.
On routine MRI of the liver consisting of T1-weighted and T2-weighted images, chemical-shift imaging, and dynamic gadolinium-enhanced imaging, distinguishing between hepatic adenomas, HCC, and hypervascular metastases is usually not possible.
Studies have been performed to determine if MRI (superparamagnetic iron oxides) enhancement with the use of ferumoxides may help to better distinguish FNH from hepatic adenomas and HCC in indeterminate cases. [26] Ferumoxides are taken up by the reticuloendothelial cells in a healthy liver. Because FNH contains Kupffer cells, the ferumoxides are taken up by healthy liver tissue and by FNH, which results in marked reduction in the signal intensity of healthy liver tissue and FNH on T2-weighted images.
Usually, no other lesions show significant signal loss on T2-weighted images. Lesions such as HCC, hepatic adenomas, and metastases usually become conspicuous because they lack a significant number of Kupffer cells. Lesions such as FNH drop out almost as much as healthy liver tissue; however, some hepatic adenomas and some well-differentiated HCCs show some signal intensity loss, which may be explained by the presence of some Kupffer cells in the lesions.
Mangafodipir trisodium (formerly termed Mn-DPDP) is a hepatobiliary MRI contrast agent that is taken up by hepatocytes and excreted into bile. Because hepatic adenoma, FNH, and HCC all contain hepatocytes, they may demonstrate enhancement with this agent. Metastases and hemangiomas do not contain hepatocytes and do not enhance; therefore, this agent can help differentiate hepatic adenoma, which enhances, from metastases, which do not enhance.
Venkatesh et al assessed the potential for MR elastography (MRE) to characterize solid liver tumors. [8] After 44 tumors were identified on T2- and T1-weighted and gadolinium-enhanced T1-weighted images, a stiffness map (elastogram) was obtained, and the stiffness value of tumor-free hepatic parenchyma was calculated. The results appeared to be promising for MRE as a potential noninvasive technique in the evaluation of solid liver tumors: malignant liver tumors had significantly greater mean shear stiffness than benign tumors, fibrotic liver, and normal liver, and fibrotic livers had stiffness values that overlapped both the benign and the malignant tumors. The authors reported that a "cutoff value of 5 kPa accurately differentiated malignant tumors from benign tumors and normal liver parenchyma in this preliminary investigation." [8]
In another study, Chang and Thoeni evaluated the effect of T1 shortening on T2-weighted MRI sequences before and after the administration of gadolinium by comparing conspicuity of 118 pathologically proven or serially followed focal liver lesions in 84 patients. [27] The authors noted, "On gadolinium-enhanced T2-weighted images, 21 (17.8%) of 118 of the lesions had improved conspicuity, 86 (72.9%) had no difference in conspicuity, and 11 (9.3%) appeared worse." However, there was no statistically significant difference between the unenhanced and enhanced images, although the authors noted a trend toward improved conspicuity with the gadolinium enhancement MRIs. With subgroup analysis, the gadolinium-enhanced T2-weighted images demonstrated significantly better visualization of solid hepatic lesions (28.3%) than nonsolid lesions (9.2%). [27]
Giovanoli et al evaluated the use of gadoxetic acid, a liver-specific MR contrast agent, in 3 patients with histologically proven liver adenomatosis. [9] The initial results were not promising: in all 3 patients, more than 100 adenomas showed no or limited uptake of gadoxetic acid in the delayed phase, thus not making it possible for the differentiation of adenomas from dysplastic or malignant lesions.
Degree of confidence
Generally, on routine MRI of the liver using T1-weighted, T2-weighted, chemical-shift, and dynamic gadolinium-enhanced imaging, certain hepatic masses can be diagnosed with confidence, whereas others cannot.
If a hepatic mass contains a low signal central scar on T1-weighted images that enhance after gadolinium administration, the diagnosis of focal nodular hyperplasia (FNH) is fairly certain.
However, overlap exists in the imaging and enhancement characteristics of hepatic adenomas, hepatocellular carcinoma (HCC), and hypervascular metastases such as melanoma. Clinical correlation in such cases is most helpful. A history of cirrhosis and high alpha-fetoprotein levels favor an HCC diagnosis. A history of melanoma or other primary tumors favors the diagnosis of metastases. In otherwise healthy young women using oral contraceptives, the diagnosis of hepatic adenoma is favored. Patients with glycogen storage disease, hemochromatosis, or acromegaly, as well as males on anabolic steroids, are also more prone to developing hepatic adenomas.
Bise and colleagues retrospectively analyzed pathologic and radiologic data of 116 HCAs to determine MRI features of HCA pathologic subtypes. HNF1α-mutated HCAs were discriminated by fatty component (homogeneous or heterogeneous) and hypovascular pattern, with a sensitivity of 88% and a specificity of 97%. Inflammatory HCAs displayed features of sinusoidal dilatation (SD), including 3 different patterns (global SD, atoll sign, and a “crescent sign” corresponding to a partial peripheral rim). Sensitivity was 88% and specificity 100%. However, some HCA remained unclassifiable by MRI: HCA remodeled by necrotic/hemorrhagic changes covering more than 50% of the lesion, HNF1α-mutated HCAs without steatosis, inflammatory HCAs without SD, and β-catenin-mutated and unclassified HCAs. [28]
Although most hepatic adenomas are hyperintense relative to normal liver on T1-weighted images, this is not a specific finding. Other hepatic masses, such as hepatocellular carcinoma, melanoma, metastases, and protein material in hepatic abscess cavities, can be hyperintense on T1-weighted images as well.
Ultrasonography
On ultrasound, hepatic adenomas demonstrate variable echogenicity (see the first image below). The lesions may be hypoechoic, isoechoic, or hyperechoic relative to liver parenchyma. Usually, differentiating hepatic adenomas from other liver lesions such as focal nodular hyperplasia or hepatocellular carcinoma is not possible based on either gray scale or Doppler ultrasonographic characteristics. [15]
The FDA approved sulfur hexafluoride (Lumason) for ultrasonography of the liver in adults and children to enhance the characterization of focal liver lesions. Contrast-enhanced ultrasound (CEUS) greatly improved diagnosis as compared to ultrasound without contrast. In this study, CEUS allowed a correct diagnosis in more than 80% of focal liver lesions and led to a change in the diagnostic workup in 131 of 157 patients (83.4%) and in the therapeutic workup in 93 of 157 patients (59.2%). [29]
Ultrasound in a patient with von Gierke disease (glycogen storage disease type 1) and several hepatic adenomas. This image shows a mass in the right lobe of the liver that is predominantly isoechoic relative to the liver parenchyma and contains a small, round, hypoechoic component. The 2 masses appear slightly hypoechoic. (Same patient as in the following image.)
T2-weighted fat-saturated fast spin-echo axial magnetic resonance image in a patient with von Gierke disease. This image shows 2 heterogeneous, hyperintense masses in the right lobe of the liver. (Same patient as in the following image.)
T1-weighted in-phase magnetic resonance image in a patient with von Gierke disease (same patient as in the following image). This image demonstrates normal hepatic signal intensity that is hyperintense relative to the spleen. Two heterogeneous masses that represent hepatic adenomas are seen in the right lobe and are slightly hypointense relative to the liver parenchyma.
T1-weighted out-of-phase magnetic resonance image in a patient with von Gierke disease (same patient as in the following image). This image shows abnormal low signal intensity of the liver, hypointense relative to the spleen, representing fatty infiltration of the liver. The hepatic adenomas are heterogeneous and slightly hyperintense relative to the fatty liver.
Single-shot fast spin-echo T2-weighted coronal magnetic resonance image in a patient with von Gierke disease (same patient as in the following image). This image shows a hyperintense mass in the right lobe of the liver and an additional hyperintense mass in the inferior tip of the liver, representing a third hepatic adenoma.
Fat-saturated 3-dimensional T1-weighted gradient-echo magnetic resonance image in a patient with von Gierke disease (same patient as in the following image). This image shows 2 heterogeneous, slightly hyperintense masses in the right lobe of the liver.
Gadolinium-enhanced fat-saturated 3-dimensional T1-weighted gradient-echo magnetic resonance image in a patient with von Gierke disease (same patient as in the following image). This image shows intense enhancement of the hepatic adenomas.
Gadolinium-enhanced fat-saturated 3-dimensional T1-weighted gradient-echo magnetic resonance image in a patient with von Gierke disease. This image shows that the hepatic adenoma remains hyperintense relative to the liver parenchyma. (Same patient as in the following image.)
Gadolinium-enhanced fat-saturated 3-dimensional T1-weighted gradient-echo magnetic resonance image in a patient with von Gierke disease (same patient in the previous image). This image shows that the hepatic adenoma remains hyperintense relative to the liver parenchyma.
Cherqui et al described increased intralesional venous structures with a paucity of intra-arterial structures in hepatic adenomas [30] ; however, Rumack et al failed to replicate this finding, and it is not a reliable differentiating feature. [31] The primary role of ultrasound is to screen patients with hepatic masses that are discovered incidentally or who have a clinical history of abnormal liver function test results. Further imaging is then indicated using MRI, CT scanning, and/or nuclear medicine.
Morin et al, however, reported that ultrasound can be used with specific contrast media and specialized imaging techniques to fully characterize the enhancement pattern of hepatic lesions, which, the authors indicate, are similar to that achieved with contrast-enhanced, multiphasic CT scanning and MRI. [14]
Nuclear Imaging
A combination of radiotracers may help make the diagnosis of hepatic adenomas in equivocal cases (see the third image below). [10]
On gallium-67 (67Ga) scans, hepatic adenomas demonstrate decreased uptake compared with healthy liver tissue, which can be explained by the benign nature of the cells. In contrast, hepatocellular carcinoma (HCC) often demonstrates equivocal or greater 67Ga uptake than liver, with studies reporting that 90-95% of HCCs demonstrate uptake or equivocal uptake of 67Ga.
Noncontrast computed tomography scan in a 41-year-old woman with a history of oral contraceptive use. This image demonstrates a heterogeneous, low-attenuation mass in the right lobe of the liver, a hepatic adenoma. (Same patient as in the following image.)
Contrast-enhanced computed tomography scan in the portal venous phase in a 41-year-old woman with a history of oral contraceptive use. This image demonstrates a heterogeneous, enhancing mass, a hepatic adenoma, predominantly isoattenuating relative to the liver with areas of low attenuation. (Same patient as in the following image.)
Technetium-99m (99mTc)–labeled red blood cell single-photon emission computed tomography scintigraphy in a 41-year-old woman with a history of oral contraceptive use. This image shows no demonstrable activity in the hepatic mass, indicating that it does not represent a hemangioma. (Same patient as in the previous image.)
Because hepatic adenomas usually have few or absent Kupffer cells, the lesions show focal defects on sulfur-colloid liver-spleen scans. However, an occasional hepatic adenoma contains enough Kupffer cells to demonstrate normal uptake of sulfur colloid. HCC almost always appears as defects on sulfur-colloid scintigraphy because HCC lacks Kupffer cells. In contrast, focal nodular hyperplasia (FNH) contains Kupffer cells and usually demonstrates uptake of sulfur colloid. In summary, sulfur-colloid uptake strongly favors a diagnosis of FNH. Lack of sulfur-colloid uptake is not specific and can be attributed to many other hepatic lesions, including hepatic adenomas, HCC, and metastases.
When hepatobiliary agents are used, hepatic adenomas usually demonstrate early uptake with subsequent retention of the radiotracer, because hepatic adenomas do not contain bile ducts; thus, the radiotracer is not excreted by the lesion, which remains "hot" on delayed images. This is in contrast to HCC, which shows focal defects on early scans. Avid uptake becomes detectable only after 2-5 hours.
The use of positron emission tomography (PET) scanning with fluorine-18-fluorodeoxyglucose (18FDG) has been shown to be useful in the evaluation of many tumors. Malignant tumors usually show uptake of 18FDG, whereas benign tumors do not. Occasionally, benign lesions such as sarcoid lesions, inflammatory processes, and abscesses can show uptake. A case has been reported of 18FDG uptake in a hepatic adenoma. [32, 13]
When hepatic adenoma is radiologically indistinguishable from HCC and FNH, a combination of radionuclide imaging, including sulfur-colloid, 67Ga, and technetium-99m (99mTc) pyridoxyl-5-methyltryptophan (PMT) uptake, may help establish the correct diagnosis. Most hepatic adenomas demonstrate decreased 67Ga uptake, decreased sulfur-colloid uptake, and early and retained uptake of hepatobiliary agents.
Angiography
In the diagnostic workup of hepatic adenomas, angiography does not have a significant role. This modality can be helpful for technical reasons when considering resection. On angiography, hepatic adenomas typically appear as hypervascular masses, with the vascular supply arising peripherally. However, hepatic adenomas may be hypovascular (as many as 50%) or have areas of hypovascularity within the mass that correspond to hemorrhage and necrosis.
In contrast, focal nodular hyperplasia (FNH) is typically hypervascular with dense capillary blushing. In large lesions, a dilated branch of the hepatic artery can enter the center of the mass and then divide into small branches that radiate in a manner similar to the spokes on a wheel (spoke-wheel appearance). If the spokelike appearance is noted, FNH is the likely diagnosis. HCC demonstrates hypervascularity, irregular tumor vessels, and arteriovenous shunting. In patients with HCC, a tumor thrombus in the portal or hepatic veins may also be seen. Most liver metastases are hypervascular with a capillary stain.
Angiography is usually not performed for the detection and differentiation of hepatic masses. Angiography can be performed preoperatively to better define the vascular anatomy before resection, although the information can be obtained noninvasively with CT scanning or MR angiography.
-
Ultrasound in a patient with von Gierke disease (glycogen storage disease type 1) and several hepatic adenomas. This image shows a mass in the right lobe of the liver that is predominantly isoechoic relative to the liver parenchyma and contains a small, round, hypoechoic component. The 2 masses appear slightly hypoechoic. (Same patient as in the following image.)
-
T2-weighted fat-saturated fast spin-echo axial magnetic resonance image in a patient with von Gierke disease. This image shows 2 heterogeneous, hyperintense masses in the right lobe of the liver. (Same patient as in the following image.)
-
T1-weighted in-phase magnetic resonance image in a patient with von Gierke disease (same patient as in the following image). This image demonstrates normal hepatic signal intensity that is hyperintense relative to the spleen. Two heterogeneous masses that represent hepatic adenomas are seen in the right lobe and are slightly hypointense relative to the liver parenchyma.
-
T1-weighted out-of-phase magnetic resonance image in a patient with von Gierke disease (same patient as in the following image). This image shows abnormal low signal intensity of the liver, hypointense relative to the spleen, representing fatty infiltration of the liver. The hepatic adenomas are heterogeneous and slightly hyperintense relative to the fatty liver.
-
Single-shot fast spin-echo T2-weighted coronal magnetic resonance image in a patient with von Gierke disease (same patient as in the following image). This image shows a hyperintense mass in the right lobe of the liver and an additional hyperintense mass in the inferior tip of the liver, representing a third hepatic adenoma.
-
Fat-saturated 3-dimensional T1-weighted gradient-echo magnetic resonance image in a patient with von Gierke disease (same patient as in the following image). This image shows 2 heterogeneous, slightly hyperintense masses in the right lobe of the liver.
-
Gadolinium-enhanced fat-saturated 3-dimensional T1-weighted gradient-echo magnetic resonance image in a patient with von Gierke disease (same patient as in the following image). This image shows intense enhancement of the hepatic adenomas.
-
Gadolinium-enhanced fat-saturated 3-dimensional T1-weighted gradient-echo magnetic resonance image in a patient with von Gierke disease. This image shows that the hepatic adenoma remains hyperintense relative to the liver parenchyma. (Same patient as in the following image.)
-
Gadolinium-enhanced fat-saturated 3-dimensional T1-weighted gradient-echo magnetic resonance image in a patient with von Gierke disease (same patient in the previous image). This image shows that the hepatic adenoma remains hyperintense relative to the liver parenchyma.
-
Noncontrast computed tomography scan in a 41-year-old woman with a history of oral contraceptive use. This image demonstrates a heterogeneous, low-attenuation mass in the right lobe of the liver, a hepatic adenoma. (Same patient as in the following image.)
-
Contrast-enhanced computed tomography scan in the portal venous phase in a 41-year-old woman with a history of oral contraceptive use. This image demonstrates a heterogeneous, enhancing mass, a hepatic adenoma, predominantly isoattenuating relative to the liver with areas of low attenuation. (Same patient as in the following image.)
-
Technetium-99m (99mTc)–labeled red blood cell single-photon emission computed tomography scintigraphy in a 41-year-old woman with a history of oral contraceptive use. This image shows no demonstrable activity in the hepatic mass, indicating that it does not represent a hemangioma. (Same patient as in the previous image.)


