Practice Essentials
Chordomas are midline tumors originating from embryonic remnants of the primitive notochord. The notochord is derived from the primitive ectoderm and defines the midline of the chordate embryos. As the fetus grows, the notochord expands at the site of the future intervertebral disks and forms the nucleus pulposus. A resemblance exists between notochordal and chordoma cells morphologically and immunohistochemically. [1, 2]
Chordomas are considered to be low-grade neoplasms, locally aggressive, and slow-growing but highly recurrent. Because chordoma lie in bone, they are usually extradural and induce bone destruction (see the images below). [3, 4] These are rare tumors, with an estimated incidence of 0.51 cases per million. Clival chordomas represent less than 0.2% of all intracranial tumors. Chordomas account for approximately 3% of all bone tumors. The tumors are found primarily in adults, occurring rarely in patients younger than 30 years, and the incidence is 2 times greater in males than in women. [5, 6, 7, 1, 2] .
Chordomas occur in the midline along the spinal axis from the clivus to the sacrum, anterior to the spinal cord. Chordomas are distributed as follows: 50% sacral, 35% skull base, and 15% in the vertebral bodies of the mobile spine (most commonly the C2 vertebrae, followed by the lumbar spine and then the thoracic spine). [5] Chordoma is the most common primary malignant tumor found in the sacrum. Metastases vary from 3 to 48% and usually occur a few years after the initial diagnosis. Metastatic sites include the lungs (52%), liver (23%), lymph nodes (20%), and bone (16%). [6, 8, 9] Local recurrence is very common, and the long-term prognosis is poor. [10]
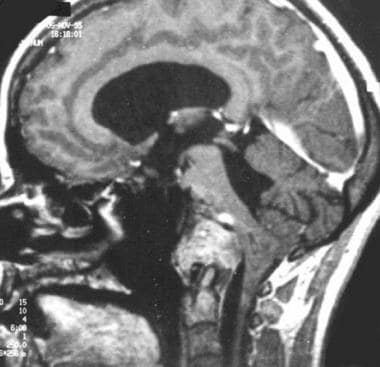
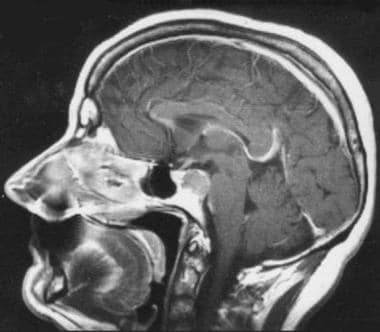 Morphology of chordoma. Contrast-enhanced sagittal T1-weighted spin-echo image. Chordoma of the upper part of the clivus with posterior extension to the pontine cistern. The bone appears expanded in this early form.
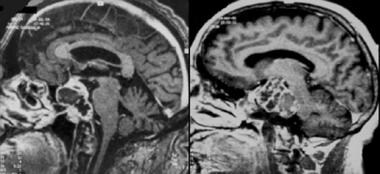
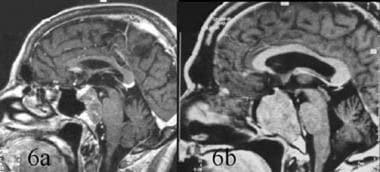 Differential diagnosis between chordoma and invasive pituitary adenoma. Sagittal contrast-enhanced T1-weighted magnetic resonance image. 6a. Clivus chordoma with posterior extension into the pontine cistern and compression of brainstem. The tumor appears lobulated and enhances heterogeneously, whereas the pituitary gland shows more marked enhancement, suggesting that the tumor does not arise from it. 6b. Invasive pituitary adenoma. The signal of the mass in the sphenoid is not homogeneous. No posterior extension is observed; extension is mostly into the sphenoid sinus. The pituitary gland is not visible.
On magnetic resonance imaging (MRI) scans, chordomas show a signal heterogeneity, possibly due to a variety of components, including fluid and gelatinous mucoid substance (associated with recent and old hemorrhage) and necrotic areas within the tumor (see the following images). In some patients, calcification and sequestered bone fragments are seen as well. In addition to conventional chordomas, chondroid chordomas, which are composed of cartilaginous hyaline tissue, have shorter T1- and T2-weighted MRI signals because of low water content.
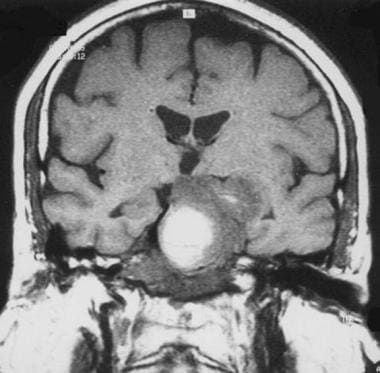 Chordoma. Coronal T1-weighted spin-echo magnetic resonance image. The high signal is a result of hemorrhage.
 Chordoma. Contrast-enhanced sagittal gradient-echo T1-weighted magnetic resonance image demonstrates heterogeneous, lobulated tumor.
Imaging modalities
MRI and computed tomography (CT) scanning have complementary roles in the evaluation of chordoma. [11, 12, 13, 14]
CT is efficient for destructive lytic chordoma. Sometimes, chordomas demonstrate irregular dystrophic calcification and sclerosis at the margin. CT scanning is needed to assess the degree of bone involvement or destruction and to detect patterns of calcification within the lesion, whereas MRI provides excellent 3-dimensional (3-D) analysis of the posterior fossa (especially the brainstem), sella turcica, cavernous sinuses, and middle cranial fossa. [15] However, MRI does not depict calcifications and the precise involvement of skull base osteolysis as well as CT scanning, especially for skull base foramina (see the image below). [16, 17]
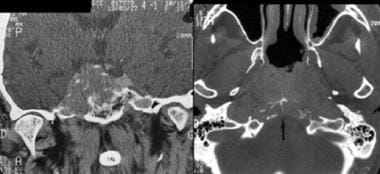 Computed tomography scan of 2 patients with chordoma. Coronal plane (left): midline tumor with lateral extension, skull base destruction, and carotid canal lysis on the right. Note the calcification or osseous debris. Axial plane (right): lysis of clivus (arrow).
Similarly, in the spine, MRI and CT scanning are complementary. In addition, it is much easier and more time efficient to survey large areas of the spinal axis and roots (or indeed, the entire spinal axis) with MRI than with CT scanning.
Finallly, analysis of tumor volume by both CT and MRI (3-dimensional volume imaging) is essential to evaluate efficacy of surgery and to predict treatment outcomes. [12]
Pathology
Chordomas have 3 histologic variants: classic, chondroid, and dedifferentiated. Classic chordomas appear as soft, gray-white, lobulated tumors composed of groups of cells separated by fibrous septa. They have round nuclei and an abundant vacuolated cytoplasm described as physaliferous. [18] They are pathologically identified by their physaliferous features and immunoreactivity for S-100 and epithelial markers such as MUC1 and cytokeratins. [19] Some studies have postulated that the notochord developmental transcription factor, brachyury, could be a novel discriminating biomarker for chordomas. [20] Typically, chordomas express the gene brachyury, whereas chondrosarcomas do not. Final diagnosis is made with immunohistochemistry.
Differentiating chordomas from chondrosarcomas using both radiologic and histologic criteria can be difficult. Immunohistochemical studies using cytokeratin antibodies and epithelial membrane antigen (negative in chondrosarcomas, positive in chordomas) can make the distinction. Chondroid forms can represent low-grade chondrosarcomas, which also is controversial. The distinction between chordoma and chondrosarcoma is important because chondrosarcoma has a better prognosis than chordoma.Metastatic epithelial neoplasms should be considered in the differential diagnosis as well.
Metastatic spread of chordomas is observed in 7-14% of patients with lymph node, pulmonary, bone, cerebral, or abdominal visceral involvement, predominantly from massive tumors. In true malignant forms of chordomas, there occasionally are areas of typical chordoma, as well as undifferentiated areas, most often suggestive of fibrosarcoma. Prognosis is poor.
Treatment
Chordomas are relatively radioresistant, necessitating high-dose radiation therapy. Proton-beam therapy with wide en-bloc excision is the standard treatment. Alternative radiation therapies are hadron-based therapy, intensity-modulated radiation therapy, carbon-ion radiation therapy, and stereotactic techniques such as Gamma knife radiosurgery. [20] Chordomas are resistant to most current conventional chemotherapeutic agents. Nuclear medicine is used in the follow-up of chemotherapy in chordoma. [14]
The 5-year survival rate following surgical resection has been reported to be about 80%. [21]
Studies have been conducted on new treatments based on the genetics and molecular biology of chordomas, with the prospect of targeted therapies. [20]
Radiography
Chordomas have 4 pathognomonic characteristics on plain film evaluation: expansion of the bone, rarefaction, trabeculation, and calcification, as seen in the image below. The usual radiographic pattern is lytic, with frequent calcification or sequestered bone fragments. However, radiographs are neither specific nor sensitive for detecting chordoma; for intracranial chordomas, plain films are no longer used. In addition, although plain films are often the first examination for sacrococcygeal and spinal chordomas, CT scanning and MRI are necessary for the diagnosis. Finally, even if a destructive clival lesion is observed on plain films, the size of the tumor may be grossly underestimated not only because portions of a chordoma may have little or no calcification present but also because the soft-tissue component is not visualized.
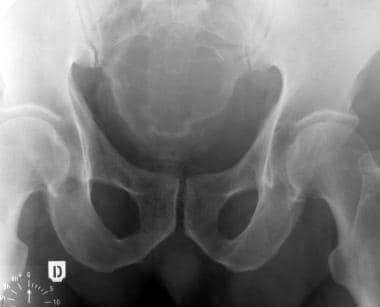 Sacrococcygeal chordoma. Plain radiograph of the pelvis showing expansion of the sacrum, bone rarefaction, and large mass of soft tissue with some trabeculations.
Computed Tomography
CT scanning is essential, highly sensitive, and accurate for evaluating bony integrity, bone destruction, and calcifications or bone fragments within the chordoma lesion. On CT scans, chordomas appear homogeneous, with a density comparable to that of muscles. The tumor appearance on contrast enhancement is heterogeneous. Calcification is found in less than one half of patients, and differentiation from sequestered bone fragments is difficult. [22, 23, 24]
Intracranial chordomas
The most characteristic appearance of an intracranial chordoma is of a centrally located soft-tissue mass arising from the clivus and causing adjacent bone destruction. [25, 12] Calcification is common, and areas of low attenuation within the soft-tissue mass — representing the myxoid and gelatinous material found on pathologic examination — are occasionally found on CT scans. CT scanning reliably demonstrates petrous apex involvement and lysis of the skull base foramina. [26]
Sacrococcygeal chordomas
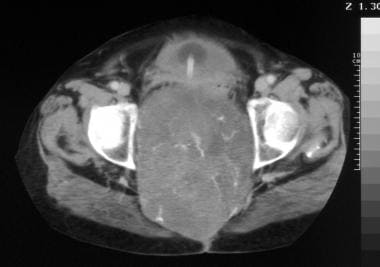
Chordomas are often massive, well-delineated tumors that shift the fatty tissue of the pelvis and involve bone structures and the epidural area. Peripheral sclerosis may be observed in approximately 50% of patients, and frequently, a discrepancy is found between a large soft-tissue component and the area of bone involvement. In addition, regional lymph nodes are usually invaded.
Spinal chordomas
Infrequently, chordomas arise in the mobile (ie, cervical, thoracic, lumbar) spine (15%). [27] The cervical spine is the most common site for spinal tumors, with a predominance in the C2 vertebra; the thoracic [28] and lumbar areas of the spine are involved less frequently.
Initially, the presentation of a chordoma on CT scan is of bone destruction centered in the vertebral body, with an associated, anteriorly or laterally situated, paraspinal soft-tissue mass that may contain calcification. Following vertebral body involvement, the pedicles, laminae, and spinal process then become involved as well; however, adjacent intervertebral disc spaces are usually spared.
Chordomas that occur in vertebrae above the sacrum appear to originate in a single vertebral body, initially producing lytic changes and ultimately resulting in vertebral collapse. Occasionally, contiguous vertebrae are involved, with sparing of the discs.
Epidural extension of the tumor is usual. Although both CT scanning and MRI can define the extravertebral extension of the tumor (the main bulk of the tumor is usually anterior to the spine), MRI is the best technique to evaluate extension of the tumor.
(CT scans depicting chordomas are provided below.)
Computed tomography scan of 2 patients with chordoma. Coronal plane (left): midline tumor with lateral extension, skull base destruction, and carotid canal lysis on the right. Note the calcification or osseous debris. Axial plane (right): lysis of clivus (arrow).
 Computed tomography scan. Note the calcification. Image courtesy of Editions Masson, Paris, 2002.
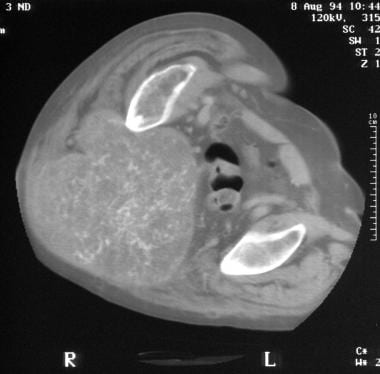
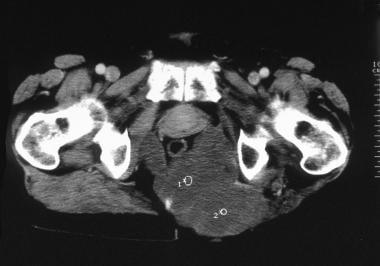 Computed tomography scan. Recurrence of a sacrococcygeal chordoma. Note tumoral infiltration of gluteal muscles displacing the rectum anteriorly. Image courtesy of Editions Masson, Paris, 2002.
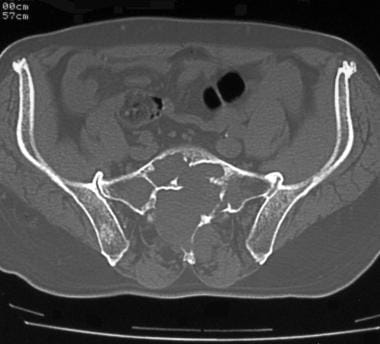 Computed tomography scan of sacrococcygeal chordoma. Note the sacral lysis with trabeculations.
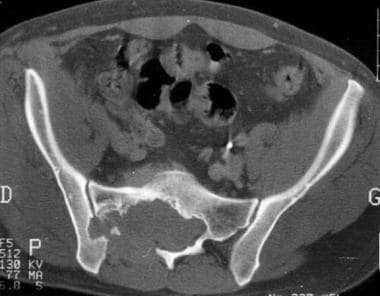
 Computed tomography scan of sacrococcygeal chordoma. Note the tumoral calcification in this huge pelvic tumor.
 Computed tomography scan of sacrococcygeal chordoma. Note the right sacroiliac joint lysis.
Magnetic Resonance Imaging
Among imaging methods that contribute to the diagnosis, MRI is particularly reliable; this modality is highly accurate in assessing the soft-tissue extent of chordomas and in evaluating involvement of adjacent tissues. [29, 16, 17]
T1- and T2-weighted sequences are needed before and after gadolinium injection. The best tool for demonstrating tumoral site and extension and for selecting the surgical approach is 3-dimensional (3-D) MRI. [30] Indeed, for clival chordomas, 3-D gradient-echo T1-weighted sequences are helpful, because they visualize the tumor in 3 planes within a short time and with a good analysis of tumor signal. [31] Fat suppression is useful for differentiating enhanced tumor from adjacent bright fatty bone marrow.
Evaluation of the precise extent of the tumor and the degree of involvement of adjacent tissues is best performed by MRI. These attributes are relevant to diagnosis and choice of treatment (biopsy or surgical and/or radiosurgical treatment) for intracranial chordomas.
Intracranial chordomas
MRI specifically shows tumor extension into critical structures, such as the cavernous sinuses, the circle of Willis, and the brainstem. [15, 32] Chordomas originate from the midline, with varying degrees of lateral extension. This characteristic predilection for the midline may aid in the differential diagnosis. Morphology and signal of the tumor are other elements in diagnosis.
Several authors have reported atypical sites of chordoma. These lesions probably originate from ectopic notochord, and their prognosis differs from that of typical chordomas. The extension of chordomas is primarily posterior, with involvement of the pontine cistern and, occasionally, of the premedullary cistern. Anterior extension, which is also frequent, primarily occurs in massive tumors with significant destruction of the skull base. [33] This can be anterosuperior to the sella turcica, displacing the pituitary gland, or anteroinferior to the nasopharynx or middle cranial fossa. Overall, extension is primarily along the anteroposterior axis rather than laterally. However, there is commonly some limited lateral extension into the cavernous sinuses, affecting treatment. It is observed in as many as 75% of patients.
Chordomas can also involve the petrous apex. However, contrary to intrinsic petrous apex tumors (ie, rhabdomyosarcomas, metastases, plasmacytomas, cholesterol granulomas, epidermoid cysts), they originate from the midline.
The expansion of the bone in the early stage indicates that the tumor arises from bone and not from adjacent structures. This feature disappears as the tumor enlarges further. Skull base chordomas are well delineated at the outset, as they displace adjacent structures; however, more advanced tumors become invasive and have a pseudomalignant appearance with bone erosion and soft-tissue invasion.
Most chordomas are isointense or demonstrate low signal on T1-weighted images. Some tumors also demonstrate high signal, which is related on histologic examination to hemorrhage and mucinous collections. Tumoral signal on T1-weighted sequences is thus not entirely reliable. Most chordomas exhibit high signal on T2-weighted images, which is also nonspecific. Hemorrhagic foci and calcification can be confirmed with susceptibility-weighted imaging. Fat-suppression imaging is also useful in the delineation of the tumor.
Following gadolinium injection, chordomas usually show lobulated areas with a honeycomb appearance corresponding to low signal areas within the tumor. [34] Chordoma signal is described as heterogeneous after gadolinium injection and on T1- and T2-weighted images. The pattern of contrast enhancement can be related to the pathologic features of the tumors, which are organized in lobules with mucinous and gelatinous contents. This may be a useful diagnostic sign. The borders of the tumor are better delineated with gadolinium injection. [34]
Diffusion-weighted imaging is relevant to help with the differential dignosis. MR angiography (MRA) allows better evaluation of vascular extension. Perfusion-weighted imaging and spectroscopy are difficult to perform on the skull base and have barely been studied.
In study by Tian et al, MRI findings were found to be helpful in determining the risk of tumor progression. In a retrospective analysis of 156 patients with skull base chordoma, the researchers reported that a higher ratio of tumor-to-pons signal intensity in T2 sequence (RT2 value) was associated with slower tumor progression, while a higher ratio of tumor-to-pons signal intensity in enhanced T1 FLAIR sequence (REN value) was a risk factor for increased tumor progression. [35]
In a study by Lin et al, of 22 patients with skull base chordomas who underwent surgical resection, contrast enhancement on MRI before surgery was a key factor in identifying subsequent tumor recurrence or progression. In the study 11 (78.6%) of the 14 patients with enhancing tumors had tumor recurrence or progression, and none of the 8 patients with nonenhancing tumors had tumor recurrence or progression. [36]
Sacrococcygeal chordomas
MRI provides detailed multiplane information, with excellent contrast of the tumor and its surrounding anatomic structures. On MRI, sacrococcygeal chordomas are lobulated tumors, typically with low to intermediate signal intensity on T1-weighted images and heterogeneous high signal intensity on T2-weighted images. The pattern of gadolinium enhancement is the same as for clival chordomas. Diffusion-weighted imaging is also relevant to evaluate the posttherapeutic response after high-intensity focused ultrasound ablation of recurrent sacral chordoma. [10]
Tumoral extension is important to ascertain for preoperative planning and is observed as follows:
-
Proximal extension - Bone and sacral canal
-
Distal-lateral extension - Gluteus maximus, hamstrings, and sciatic nerve and notch
-
Anterior extension - Retroperitoneal lymph nodes and rectum
-
Posterior extension - Subcutaneous fat
Gadolinium-based contrast agents have been linked to the development of nephrogenic systemic fibrosis (NSF) or nephrogenic fibrosing dermopathy (NFD). The disease has occurred in patients with moderate to end-stage renal disease after being given a gadolinium-based contrast agent to enhance MRI or magnetic resonance angiography scans. NSF/NFD is a debilitating and sometimes fatal disease. Characteristics include red or dark patches on the skin; burning, itching, swelling, hardening, and tightening of the skin; yellow spots on the whites of the eyes; joint stiffness with trouble moving or straightening the arms, hands, legs, or feet; pain deep in the hip bones or ribs; and muscle weakness.
Other neoplasms can be difficult to differentiate from chordomas. [37]
Differential diagnoses for intracranial chordomas
Ecchordosis physaliphora (EP): benign notochordal cell tumors
EP is a congenital, benign, gelatinous tissue that is considered an ectopic notochordal remnant. EPs are found in around 2% of autopsy studies. Typically, EPs are small, well-circumscribed, extra-axial, intradural lesions in the prepontine cistern. On MRI, EPs do not show contrast enhancement. Differentiation is essential, because EPs are begnin and usually asymptomatic and therefore do not require treatment. [14]
Chondromas and chondrosarcomas
Chondromas and chondrosarcomas may have the same radiologic appearance as chordomas (see the image below). They originate from embryonic remnants of the primitive cartilage and tend to arise from and extend more laterally into the sellar and cerebellopontine-angle regions. Demonstration of a midline clival tumor strongly suggests the diagnosis of chordoma over chondrosarcoma, which tends to be located around the petro-occipital fissure. Futhermore, chondrosarcomas display significantly higher ADC values than chordomas. Compared with other malignancies and benign tumors of the skull base, chordomas and chondrosarcomas show less restricted diffusion. [17] Survival rates are worse for chordomas than for chondrosarcomas.
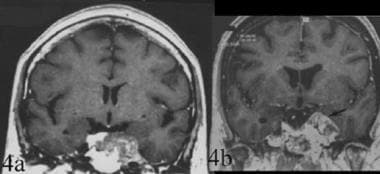 Topography of chordoma. Differential diagnosis between chordoma and chondroma. 4a. Coronal contrast-enhanced T1-weighted spin-echo image. Clival chordoma with a lateral extension to the left cavernous sinus. The tumor is median with a lateral extension. 4b. Coronal contrast-enhanced T1-weighted gradient-echo image of a laterosellar chondroma. This image demonstrates the strictly lateral localization of the tumor.
Craniopharyngiomas
Craniopharyngiomas have a different topography in addition to a relatively characteristic signal. The tumors are suprasellar, sellar, or infrasellar and are rarely at the level of the nasopharynx. Generally, the site is more anterior and superior, and extension is almost always posterosuperior (interpeduncular cistern).
Pituitary adenomas
Invasive pituitary adenomas usually affect the sphenoid sinus (see the following image), although in some patients they are posterior, in which case the hypophysis is not visible. Usually, the pontine cistern is not involved. Of course, clinical and biologic data are the primary indications of pituitary origin, except in nonsecreting adenomas. (See the image below.)
Differential diagnosis between chordoma and invasive pituitary adenoma. Sagittal contrast-enhanced T1-weighted magnetic resonance image. 6a. Clivus chordoma with posterior extension into the pontine cistern and compression of brainstem. The tumor appears lobulated and enhances heterogeneously, whereas the pituitary gland shows more marked enhancement, suggesting that the tumor does not arise from it. 6b. Invasive pituitary adenoma. The signal of the mass in the sphenoid is not homogeneous. No posterior extension is observed; extension is mostly into the sphenoid sinus. The pituitary gland is not visible.
Clivus meningiomas
Clivus meningiomas are differentiated easily from chordomas. They have a large dural attachment and do not appear similar to bone tumors. Homogeneity of their signal is an additional element. [12]
Lymphoma and other tumors
Aside from clinical data, few criteria exist for diagnosing lymphoma of the skull base. Similarly, bone metastases can be found in any part of the skull base with extensive osteolysis and a rapid course. Because skull base metastases are relatively infrequent in the absence of a primary neoplasm, the differential diagnosis is easier. Neither type of tumor is frequent. Nasopharyngeal malignancies typically extend more anteriorly.
Other differential diagnoses include plasmacytoma, rhabdomyosarcoma in pediatric patients, histiocytosis X, trigeminal neuroma, and fibrous dysplasia.
Differential diagnoses for sacral chordomas
The most reliable sign of sacral chordomas is the destruction of several sacral vertebrae associated with a tissue mass anterior to the sacrum. However, the association of osteolytic lesions and soft masses involving the discs and the vertebrae suggests other diagnoses, such as neurofibromas, lymphomas, metastases, and plasmacytomas.
(MRI studies depicting chordomas are provided below.)
Morphology of chordoma. Contrast-enhanced sagittal T1-weighted spin-echo image. Chordoma of the upper part of the clivus with posterior extension to the pontine cistern. The bone appears expanded in this early form.
 Recurrence of clival chordoma following surgery. Contrast-enhanced sagittal T1-weighted gradient-echo image showing brainstem and foramen magnum invasion.
Chordoma. Coronal T1-weighted spin-echo magnetic resonance image. The high signal is a result of hemorrhage.
Chordoma. Contrast-enhanced sagittal gradient-echo T1-weighted magnetic resonance image demonstrates heterogeneous, lobulated tumor.
Recurrence of clival chordoma following surgery. Contrast-enhanced sagittal T1-weighted gradient-echo image showing brainstem and foramen magnum invasion.
Chordoma. Coronal T1-weighted spin-echo magnetic resonance image. The high signal is a result of hemorrhage.
Chordoma. Contrast-enhanced sagittal gradient-echo T1-weighted magnetic resonance image demonstrates heterogeneous, lobulated tumor.
 Coccygeal chordoma. Sagittal T1-weighted magnetic resonance image. Note the subcutaneous tissue infiltration.
 Sagittal contrast-enhanced T1-weighted magnetic resonance image. Note the heterogeneous gadolinium enhancement (same patient as in previous image).
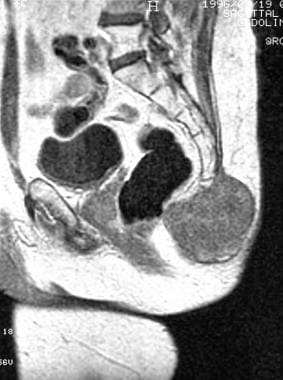
 Sagittal T2-weighted magnetic resonance image. The tumor appears lobulated and shows high signal (same patient as in previous image). Image courtesy of Editions Masson, Paris, 2002.
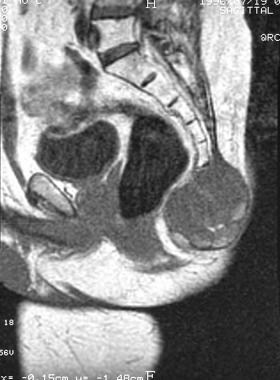
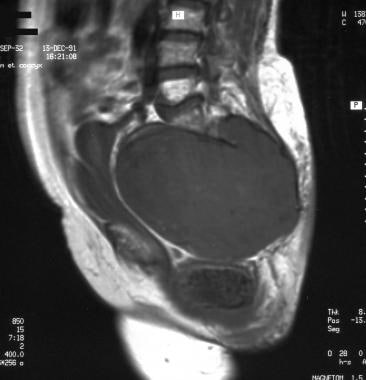 Sacrococcygeal chordoma. Sagittal T1-weighted magnetic resonance image showing a huge, well-delineated tumoral mass invading the sacral canal, extending into the pelvis, and shifting the fat, uterus, bladder, and rectum. Image courtesy of Editions Masson, Paris, 2002.
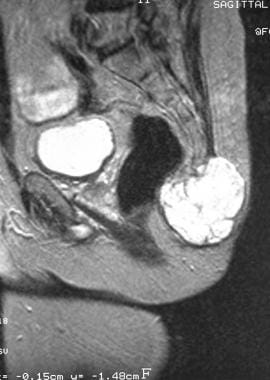
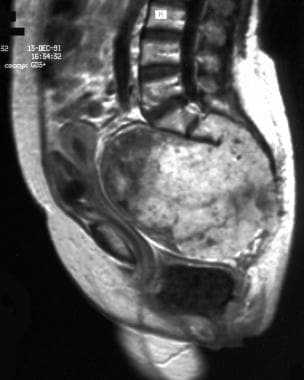 Sagittal contrast-enhanced T1-weighted magnetic resonance image. Note the lobulated heterogeneous contrast enhancement (same patient as in previous image). Image courtesy of Editions Masson, Paris, 2002.
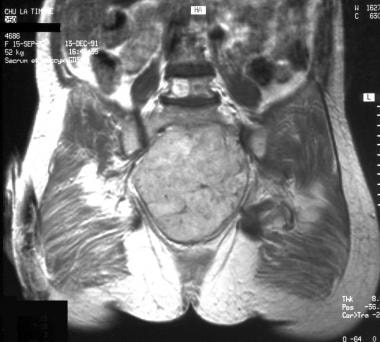
 Coronal T1-weighted magnetic resonance image (same patient as in previous image). Image courtesy of Editions Masson, Paris, 2002.
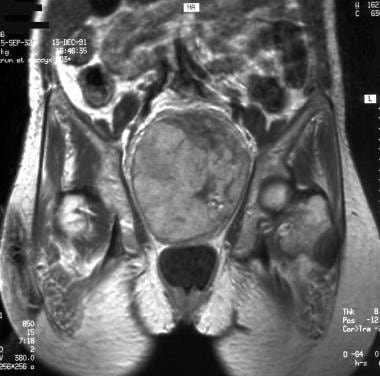
 Coronal contrast-enhanced T1-weighted magnetic resonance image (same patient as in previous image). Image courtesy of Editions Masson, Paris, 2002.
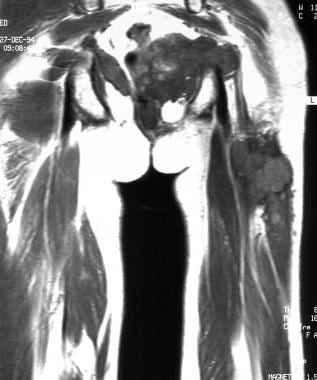 Coronal T1-weighted magnetic resonance image. Tumoral infiltration of the thigh. Image courtesy of Editions Masson, Paris, 2002.
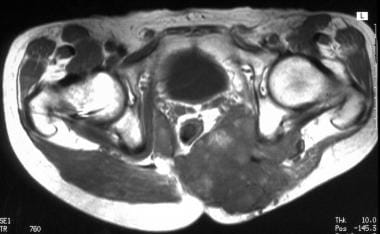 Axial T1-weighted magnetic resonance image (same patient as in previous image). Image courtesy of Editions Masson, Paris, 2002.
-
Morphology of chordoma. Contrast-enhanced sagittal T1-weighted spin-echo image. Chordoma of the upper part of the clivus with posterior extension to the pontine cistern. The bone appears expanded in this early form.
-
Pathology of chordoma. Lobulated tumor with epithelial cords separated by mucinous material (hematoxylin-phloxine-saffron, magnification X25).
-
Pathology of chordoma. At higher magnification, vacuolated neoplastic cells and occasional physaliphorous cells are observed (hematoxylin-phloxine-saffron, magnification X225).
-
Immunopathology of chordoma. The epithelial nature of chordoma is assessed by the strong immunoreactivity to anticytokeratin antibody (immunoperoxidase, magnification X130).
-
Topography of chordoma. Differential diagnosis between chordoma and chondroma. 4a. Coronal contrast-enhanced T1-weighted spin-echo image. Clival chordoma with a lateral extension to the left cavernous sinus. The tumor is median with a lateral extension. 4b. Coronal contrast-enhanced T1-weighted gradient-echo image of a laterosellar chondroma. This image demonstrates the strictly lateral localization of the tumor.
-
Differential diagnosis between chordoma and invasive pituitary adenoma. Sagittal contrast-enhanced T1-weighted magnetic resonance image. 6a. Clivus chordoma with posterior extension into the pontine cistern and compression of brainstem. The tumor appears lobulated and enhances heterogeneously, whereas the pituitary gland shows more marked enhancement, suggesting that the tumor does not arise from it. 6b. Invasive pituitary adenoma. The signal of the mass in the sphenoid is not homogeneous. No posterior extension is observed; extension is mostly into the sphenoid sinus. The pituitary gland is not visible.
-
Recurrence of clival chordoma following surgery. Contrast-enhanced sagittal T1-weighted gradient-echo image showing brainstem and foramen magnum invasion.
-
Chordoma. Coronal T1-weighted spin-echo magnetic resonance image. The high signal is a result of hemorrhage.
-
Chordoma. Contrast-enhanced sagittal gradient-echo T1-weighted magnetic resonance image demonstrates heterogeneous, lobulated tumor.
-
Computed tomography scan of 2 patients with chordoma. Coronal plane (left): midline tumor with lateral extension, skull base destruction, and carotid canal lysis on the right. Note the calcification or osseous debris. Axial plane (right): lysis of clivus (arrow).
-
Sacrococcygeal chordoma. Plain radiograph of the pelvis showing expansion of the sacrum, bone rarefaction, and large mass of soft tissue with some trabeculations.
-
Coccygeal chordoma. Sagittal T1-weighted magnetic resonance image. Note the subcutaneous tissue infiltration.
-
Sagittal contrast-enhanced T1-weighted magnetic resonance image. Note the heterogeneous gadolinium enhancement (same patient as in previous image).
-
Sagittal T2-weighted magnetic resonance image. The tumor appears lobulated and shows high signal (same patient as in previous image). Image courtesy of Editions Masson, Paris, 2002.
-
Sacrococcygeal chordoma. Sagittal T1-weighted magnetic resonance image showing a huge, well-delineated tumoral mass invading the sacral canal, extending into the pelvis, and shifting the fat, uterus, bladder, and rectum. Image courtesy of Editions Masson, Paris, 2002.
-
Sagittal contrast-enhanced T1-weighted magnetic resonance image. Note the lobulated heterogeneous contrast enhancement (same patient as in previous image). Image courtesy of Editions Masson, Paris, 2002.
-
Coronal T1-weighted magnetic resonance image (same patient as in previous image). Image courtesy of Editions Masson, Paris, 2002.
-
Coronal contrast-enhanced T1-weighted magnetic resonance image (same patient as in previous image). Image courtesy of Editions Masson, Paris, 2002.
-
Computed tomography scan. Note the calcification. Image courtesy of Editions Masson, Paris, 2002.
-
Computed tomography scan. Recurrence of a sacrococcygeal chordoma. Note tumoral infiltration of gluteal muscles displacing the rectum anteriorly. Image courtesy of Editions Masson, Paris, 2002.
-
Coronal T1-weighted magnetic resonance image. Tumoral infiltration of the thigh. Image courtesy of Editions Masson, Paris, 2002.
-
Axial T1-weighted magnetic resonance image (same patient as in previous image). Image courtesy of Editions Masson, Paris, 2002.
-
Computed tomography scan of sacrococcygeal chordoma. Note the sacral lysis with trabeculations.
-
Computed tomography scan of sacrococcygeal chordoma. Note the tumoral calcification in this huge pelvic tumor.
-
Computed tomography scan of sacrococcygeal chordoma. Note the right sacroiliac joint lysis.