Practice Essentials
Hypertrophic cardiomyopathy (HCM) is the most common genetic cardiomyopathy, affecting approximately 1 in 200-500 people. HCM is the most prevalent cause of sudden death in athletes. Genetic testing plays a significant role in the diagnosis and management of HCM, which is a single-gene disorder, inherited as an autosomal dominant trait in most cases. As the yield of genetic testing is only about 35-60%, the diagnosis of HCM is still clinical and based on the demonstration of unexplained and usually asymmetric left ventricular (LV) hypertrophy by imaging modalities. [1, 2]
HCM is defined by a maximal wall thickness greater than 15 mm in the general population and greater than 13 mm in patients who have a family history of HCM, along with a septal to left posterior wall thickness ratio that is greater than 1.3 in normotensive patients and greater than 1.5 in hypertensive patients. In children, HCM is defined as an increase in left ventricular wall thickness of more than 2 standard deviations over the mean value for age and BMI. The 3 primary phenotypes of HCM are asymmetric, concentric, and apical hypertrophy, with asymmetric septal being the most common. [3]
HCM has clinical and phenotypic heterogeneity, including a broad hemodynamic spectrum comprising LV obstruction under resting conditions, dynamic (labile) gradients without rest obstruction, and gradients absent both at rest and with provocation (ie, nonobstructive HCM). Most attention has historically focused on patients with outflow obstruction, given that subaortic gradients are the most common mechanism responsible for heart failure symptoms in this disease. HCM patients with nonobstructive disease appear to experience a relatively benign clinical course, with a low risk for advanced heart failure symptoms, other disease complications, and HCM-related mortality and largely without the requirement for major treatment interventions. A small minority of nonobstructive HCM patients progress to heart transplantation. [4]
In a meta-analysis of 112 studies (58,732 patients) to help identify the risk factors of HCM, Georgiopoulos et al found that increased brain natriuretic peptide/N-terminal pro-B-type natriuretic peptide, late gadolinium enhancement (LGE), positive genotype, impaired global longitudinal strain, and presence of apical aneurysm conferred increased risk. LGE had the highest prognostic value, according to the authors. [5]
A number of biomarkers have been identified in HCM. Natriuretic peptides, which are hormones that are secreted by the heart in response to increased wall tension or stretch, have been found to be elevated, and increased levels of brain‐type natriuretic peptide (BNP) bestows increased risk of sudden cardiac death and is predictive of silent myocardial ischemia. Cardiac troponin T and I, which are components of striated muscle sarcomeres, are also elevated. Other important findings in patients with HCM include replacement fibrosis (detected by LGE) and diffuse interstitial fibrosis (detected by T1 mapping and measurement of extracellular volume). [6]
(See the images of hypertrophic cardiomyopathy below.)
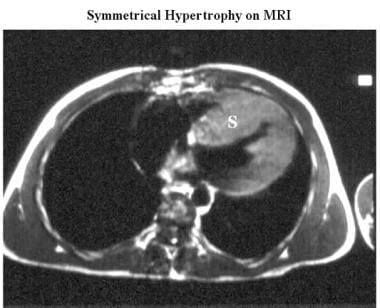 Cardiomyopathy, hypertrophic. Axial electrocardiographically (ECG) gated spin-echo MRI in a patient shows marked septal (S) and less-prominent posterior wall thickening.
Imaging modalities
In the past, echocardiography was the sole imaging modality used for the diagnosis and management of HCM. However, other imaging modalitie, such as cardiac magnetic resonance (CMR), have played an increasing role in the diagnosis, management, and risk stratification of HCM, particularly when the location of left ventricular hypertrophy is atypical (apex, lateral wall) and when the echocardiographic imaging is suboptimal. [2]
The American College of Cardiology and American Heart Association (ACC/AHA) guidelines for hypertrophic cardiomyopathy include the following [7, 8] :
-
An initial electrocardiogram (ECG) and 24- to 48-hr ambulatory ECG monitoring is recommended followed by surveillance ECG every 1-2 yr. For palpitations or lightheadedness, extended monitoring is recommended, which should only be considered diagnostic if symptoms occurred while monitoring.
-
For all patients with suspected HCM, a transthoracic echocardiogram (TTE) is recommended. If resting left ventricular outflow tract (LVOT) gradient is < 50 mm Hg, provocative testing should be performed. For symptomatic patients without provoked gradients, an exercise echocardiogram should be performed. For clinically stable HCM patients, surveillance echocardiograms should be considered every 1-2 yr to assess for changes in extent of hypertrophy, obstruction, and cardiac function.
-
Cardiac MRI should be obtained in HCM patients when echocardiography is inconclusive, if there is suspicion of an alternative diagnosis (eg, infiltrative/storage diseases), for sudden cardiac death risk stratification, and if it may be needed for selection and planning of septal reduction therapy.
-
For HCM patients with symptoms of myocardial ischemia, computed tomography (CT) or invasive coronary angiography should be considered. Prior to surgical myectomy, invasive or CT angiography should be obtained. For patients who are candidates for septal reduction therapy but there is uncertainty regarding presence of LVOT obstruction on noninvasive studies, invasive hemodynamic assessment is recommended.
-
In first-degree relatives of patients with HCM, clinical screening should include ECG and TTE during the initial evaluation, followed by periodic follow-up according to their age (1-2 yr in adolescents, 3-5 yr in adults) or if clinical status changes.
The advantages of CMR are enhanced spatial resolution, image quality, and inherent 3-dimensional nature, which have allowed identification of morphologic variants of HCM, some of which can be missed by echocardiography. In addition to this greater diagnostic accuracy, CMR provides excellent demarcation between the myocardium and blood pool, allowing the most accurate calculation of LV mass and volumes. [9]
The high contrast resolution of ECG-gated MRI provides excellent information about cardiac anatomy. [10, 11, 12] Spin-echo MRI or cine magnetic resonance angiography (MRA) can be used to demonstrate ventricular anatomy and wall thickness. Cine MRA is used to evaluate ventricular function, ventricular end-diastolic and end-systolic volumes, valvular dysfunction, and outflow tract obstruction. In some cases, the signal intensity through the thickened myocardium varies. [13]
In addition, contrast-enhanced CMR with late gadolinium enhancement (LGE) has the capability to identify areas of myocardial fibrosis/scarring with novel data, demonstrating that the extent of LGE by CMR may play an important role in risk stratification of patients with HCM. [14]
The 12-lead ECG is useful largely for raising the suspicion of HCM in family members without LV hypertrophy and in identifying patterns such as Wolff-Parkinson-White syndrome, which may suggest certain phenocopies of HCM. Patterns mimicking myocardial infarction may provide evidence of the diagnosis and may be present in young individuals before there is manifest evidence of wall thickening on echocardiography. The 12-lead ECG is abnormal in 75-95% of patients with HCM, but these abnormalities do not correlate with severity or pattern of hypertrophy as determined by echocardiography. [8]
When native echocardiographic images are suboptimal, transpulmonary contrast echocardiography can improve visualization, especially when apical hypertrophy or an apical aneurysm is suspected. [15, 16]
Cardiac catheterization and angiography can be performed to evaluate hemodynamic and morphologic abnormalities associated with HCM, along with associated coronary artery anomalies. However, these are invasive procedures and should be used only if other tests cannot provide adequate information or if alcohol ablation of septal branches is planned.
Computed Tomography
Electron-beam CT (EBCT) is an excellent method for observing irregular wall hypertrophy, apical morphology, and wall motion dynamics. [17] This modality is seldom used, however, because it entails exposure to radiation and contrast medium and provides less information than MRI. The criterion for LV wall hypertrophy is an LV wall thicker than 13 mm. Right ventricular hypertrophy is considered when the right ventricular wall is thicker than 6 mm.
Wall thickening during systole can be calculated with EBCT. Most patients (71%) have decreased wall thickening at the hypertrophic site and normal or increased thickening at the nonhypertrophic site. [17]
Late enhancement of the myocardium on EBCT has been reported in approximately 47% of HCM patients [18] ; this finding suggests the presence of abnormal tissue with a capillary architecture different from that of normal myocardium. The degree of regional wall thickening also is significantly less in areas of late enhancement, which reflects the abnormal myocardial architecture. [19]
Magnetic Resonance Imaging
The primary role for cardiac magnetic resonance (CMR) in patients with HCM is clarification of diagnosis and phenotype. In patients with HCM in whom hypertrophy is predominantly confined to the apex (ie, apical HCM), increased wall thickness in this region of the LV myocardium may be difficult to visualize clearly with echocardiography but can be well seen with CMR. [8]
Cardiac morphology can be evaluated by using either ECG-gated spin-echo MRI or cine MRA. The 2 most common views are 4 chamber and short axis. [20] Spin-echo MRI can be used to accurately characterize the distribution and degree of myocardial hypertrophy. MRI correlates well with 2-dimensional echocardiography in demonstrating asymmetric septal hypertrophy, and MRI can visualize apical and posterolateral myocardial hypertrophy that is not always evident on 2D echograms. [21] MRI reliably provides accurate, comprehensive data that can be used to calculate hypertrophic scores. [22]
(See the images below.)
Cardiomyopathy, hypertrophic. Axial electrocardiographically (ECG) gated spin-echo MRI in a patient shows marked septal (S) and less-prominent posterior wall thickening.
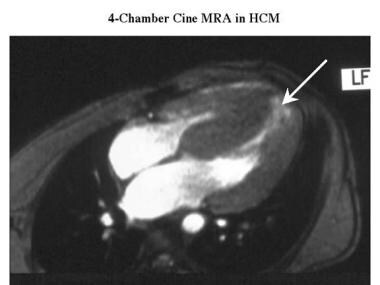 Cardiomyopathy, hypertrophic. Oblique axial cine magnetic resonance angiogram in the same patient as in the previous image shows a spade-shaped left ventricle with relative sparing of the apical myocardium (arrow).
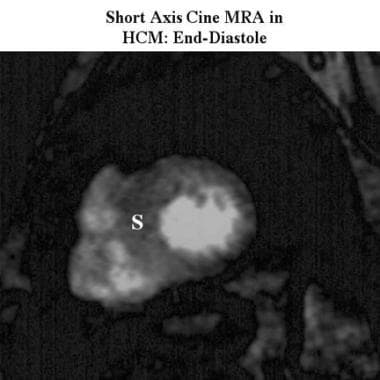 Cardiomyopathy, hypertrophic. Short-axis cine end-diastolic magnetic resonance angiogram shows asymmetric hypertrophy with septal thickening (S).
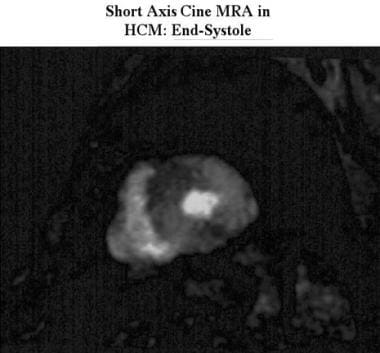 Cardiomyopathy, hypertrophic. Short-axis cine end-systolic, magnetic resonance angiogram obtained in the same patient as in the previous image shows marked myocardial thickening that affects the entire myocardium.
The hypertrophy in HCM is usually asymmetric and is typically most evident in the anteroseptal myocardium. [23] In patients with asymmetric septal hypertrophy, the basal interventricular septum (IVS) at end diastole is disproportionately thickened, and the ratio of IVS thickness to posterolateral wall thickness is significantly increased.
Patients with asymmetric septal hypertrophy also have decreased systolic myocardial thickening, probably due to disarray and disorganization of myocardial fibers. [24] Long-axis MRIs accurately show the typical spade-shaped deformity of the LV cavity and the apical distribution of myocardial hypertrophy in patients with asymmetric septal hypertrophy.
With MRI, assessment of the thickness of the free wall of the right ventricle and measurement of right ventricular mass are possible; patients with HCM tend to have diffuse hypertrophy of the right ventricular wall and an increased right ventricular wall index. [25] LV mass can be reliably estimated with spin-echo MRI, ECG-gated MRI, or multilevel cine MRA; however, LV mass, indexed to body surface area, is normal in about 20% of patients with HCM. [26]
LVH in HCM often decreases the LV volume and increases the ejection fraction, without significantly changing stroke volume. Cine MRA can be used to calculate these parameters. If volume calculation is performed throughout the cardiac cycle, a time-volume curve can be obtained for more detailed functional analysis.
An obstruction of the LV outflow tract (LVOT) resulting in a subaortic pressure gradient can be detected on cine MRA as signal void (ie, an area of low signal intensity in regions where normal cardiac blood flow produces high signal intensity). Although areas of physiologic signal void can be seen on scans in healthy individuals, signal voids are larger and persist longer in the cardiac cycle in patients with pathologic conditions that cause obstruction. [27] Differentiation of physiologic voids from pathologic ones is rarely difficult.
(See the image below.)
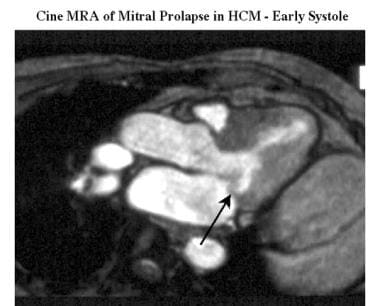 Cardiomyopathy, hypertrophic. Oblique cine magnetic resonance angiogram (outflow 2-chamber view) shows prolapse (arrow) of the posterior mitral leaflet in early systole.
Systolic anterior motion (SAM) of anterior mitral leaflet toward the IVS can be recognized on cine MRAs as a cause of LVOT obstruction. Mitral regurgitation is a common finding in patients with HCM and appears on cine MRAs as a signal void in the left atrium during ventricular systole. It may be associated with mitral valve prolapse (see the images below).
Cardiomyopathy, hypertrophic. Oblique cine magnetic resonance angiogram (outflow 2-chamber view) shows prolapse (arrow) of the posterior mitral leaflet in early systole.
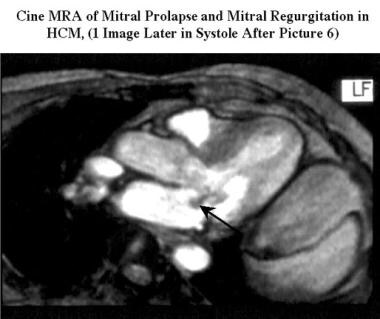 Cardiomyopathy, hypertrophic. Oblique cine magnetic resonance angiogram (outflow 2-chamber view obtained during the same study as the previous image) shows mitral prolapse of the posterior mitral leaflet with a small signal intensity loss due to mitral regurgitation (arrow).
Although healthy individuals may have a small, round area of physiologic signal void within the left atrium immediately behind and between the 2 mitral leaflets, in patients with pathologic conditions the signal void is larger and persists longer through ventricular systole. The area and extent of the signal void correlates closely with the grade of mitral regurgitation, as estimated with angiography and echocardiography. [28, 29, 30]
Myocardial structural abnormality from fiber disarray and disorganization can result in abnormal signal intensity. Fattori et al reported areas of reduced signal intensity, probably due to myocardial fibrosis, in 16 (43%) of 37 unselected patients with HCM. [31] This group also had higher maximum septal thickness (25 mm ± 7 vs 21 mm ± 6) and maximum posterior left wall thickness (15 mm ± 9 vs 7 mm ± 8). In patients with HCM, cine MRA also can be used to demonstrate nonuniform regional LV function (ie, LV asynchrony resulting in abnormal diastolic relaxation).
Cardiac amyloidosis can resemble HCM; symmetric LV thickening is typical of amyloidosis but also occurs in HCM, and restrictive physiology and poor compliance may be present in both diseases. [32] However, amyloidosis tissue may be characterized by its diffuse high signal intensity on T2-weighted spin-echo and short T1 inversion recovery (STIR) MRI. The signal intensity with echo times of 20 ms and 60 ms is significantly lower in cardiac amyloidosis than in HCM and in normal tissue. [33] Poorer ventricular wall contractility and lower ECG voltages suggest amyloidosis, and a right atrial free wall more than 6 mm thick is a specific marker for the disease. [33]
Huurman et al studied 91 individuals with pathogenic DNA variants for HCM who underwent electrocardiography (ECG), transthoracic echocardiography (TTE), and cardiovascular magnetic resonance (CMR) and had a maximal wall thickness (MWT) less than 15 mm on TTE (HCM was defined as MWT ≥13 mm). Most of the individuals (75%) had an MWT less than 13 mm on TTE, but 23 were diagnosed with HCM based on CMR, and 2 were reclassified on CMR as having no HCM. [34]
In a study, by Spiewak et al, of 550 patients with known HCM on echocardiography, MRI identified 12 (2.2%) with a diagnosis other than HCM, including subaortic membrane in 1 and mild left ventricular hypertrophy in 5. In patients with suspected HCM (n = 456), MRI was able to provide a definitive HCM diagnosis in 204 (44.7%). [35]
MRI myocardial tagging
Tagging MR imaging is useful for evaluating the myocardial wall motion and strain quantitatively. This technique shows regional strain abnormalities even in the nonhypertrophied myocardium of HCM, and it can be improved after the interventional procedure on the hypertrophied myocardium close to the LVOT. [36] The hypertrophied myocardial region with LGE tends to show decreased wall motion on tagging, while the disconcordance between LGE and decreased circumferential strain is observed using 3D tagging. [37] It is unknown whether the tagging has considerable advantages over cine SSFP (steady-state free precession) and LGE MR imaging for identification of early-stage HCM and for risk stratification.
Risk stratification
CMR has led to the identification of novel subgroups of patients with HCM, including those with LV apical aneurysms (a subgroup at increased risk for ventricular arrhythmias and thromboembolic stroke), as well as abnormalities that contribute to LV outflow obstruction. [14]
Identification and quantification of the extent of late gadolinium enhancement (LGE) or replacement fibrosis have proved to be valuable features of CMR. [2, 8] LGE accurately identifies areas of myocardial fibrosis that can have prognostic significance. The presence of LGE in patients with HCM has been independently associated with increases in all-cause mortality, cardiac death, and sudden cardiac death. [38, 39] The extent of LGE appears to be important, as more than 15% of the LV mass subtended by LGE is associated with an increased risk of sudden cardiac death. Because localizing focal fibrosis with LGE involves "nulling" the signal of surrounding myocardium, the technique is unable to identify more diffuse interstitial myocardial fibrosis. This has led to the utilization of noncontrast and postcontrast T1 mapping for myocardial tissue characterization. T1 mapping allows enhanced discrimination between true HCM and morphologic mimics. [9]
Athlete's heart
In the vast majority of competitive athletes, the LV wall is 12 mm or more in thickness. Athletes with an LV wall thicker than 16 mm are likely to have pathologic hypertrophy such as HCM. For the minority of athletes whose LV thickness is in the gray zone of 13-15 mm, differentiation of physiologic from pathologic hypertrophy can be problematic. The differentiation between athlete’s heart and HCM is critical, as HCM is an important cause of sudden death in athletes, responsible for 6-36% of events. [40] A variety of different morphologic features on CMR may help distinguish HCM from athlete’s heart. Additionally, CMR can evaluate other structural abnormalities that are also frequently implicated in sudden death of athletes, including arrhythmogenic right ventricular cardiomyopathy and myocarditis.
CMR can help differentiate athlete’s heart from HCM by identification of focal pattern of hypertrophy, a finding supportive of a diagnosis of HCM. In addition, forced deconditioning of an athlete may serve as a useful strategy to resolve diagnosis, with CMR well suited to compare maximum LV wall thickness measurements before and after a period of systemic deconditioning. In this regard, a patient whose wall thickness regresses by more than 2 mm supports a diagnosis of athlete’s heart, while hypertrophy that remains present despite deconditioning supports a diagnosis of HCM. [14]
Ultrasonography
A major criterion for the echocardiographic diagnosis of HCM is left ventricular (LV) wall thickness of more than 13 mm in the anterior septum or posterior wall or more than 15 mm in the posterior septum or free wall, in the absence of LV dilatation or other cardiac and systemic causes of increased mass. [41] However, no definitive criterion or single echocardiographic feature is pathognomonic for HCM.
The typical echocardiographic feature in HCM is hypertrophy of the septum and LV anterolateral free wall (see the images below); however, the degree and pattern of hypertrophy vary. Maximum hypertrophy of the septum often occurs midway between the base and the apex. On echocardiograms, asymmetric septal hypertrophy is defined as a ratio of septal thickness to posterior wall thickness of at least 1.3 to 1.5. Although the average LV wall is thicker than 20 mm (ie, almost twice the normal thickness), it can vary from 13 to 15 mm in mild hypertrophy to 50 mm in massive hypertrophy. [13, 42]
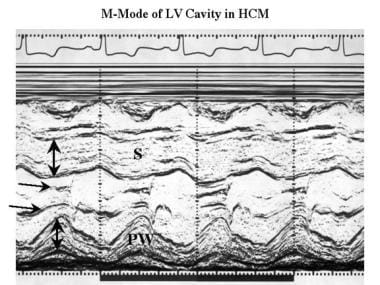 Cardiomyopathy, hypertrophic. M-mode echocardiogram recorded at the level of the tips of the mitral valve (horizontal arrows) to assess left ventricular dimensions shows moderate thickening of both the septum (S) and posterior wall of the left ventricle (PW).
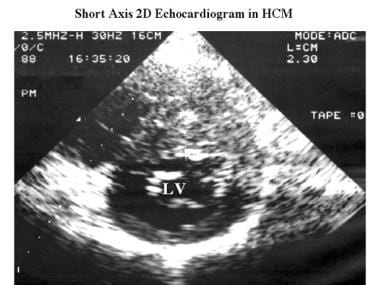 Cardiomyopathy, hypertrophic. Axial 2-dimensional echocardiogram obtained in the same patient as in the previous shows asymmetric septal thickening (23 mm) and a small left ventricular cavity (LV).
Often, the echocardiographic feature of a ground-glass appearance is noted either visually or by using quantitative texture analysis in both hypertrophied and nonhypertrophied regions of the ventricle. [43] This feature can be used to distinguish HCM from other causes of secondary hypertrophy. [44]
Another common echocardiographic feature in HCM is narrowing or obstruction of the LVOT caused by IVS and the anterior leaflet of the mitral valve. The abnormal geometry of LVOT results in a dynamic pressure gradient. Abnormal systolic anterior motion (SAM) of the anterior leaflet (see the images below) and, occasionally, the posterior leaflet of the mitral valve may be present; severe SAM, with septal-leaflet contact, has been proposed as a major diagnostic criterion. [41] Mitral valve abnormalities in HCM patients include increased leaflet area, elongation of the leaflet, and anomalous insertion of papillary muscle directly into the anterior mitral leaflet. [45] Recognition of these anatomic abnormalities during the preoperative assessment is important.
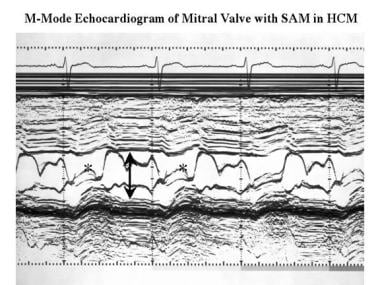 Cardiomyopathy, hypertrophic. M-mode echocardiogram recorded at the level of the mitral valve shows a small ventricular cavity (arrow) and systolic anterior motion of the anterior mitral valve leaflet (*).
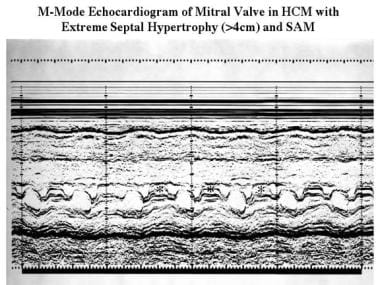 Cardiomyopathy, hypertrophic. M-mode echocardiogram recorded at the level of the mitral valve in a patient with extreme septal hypertrophy (>40 mm) shows a small ventricular cavity (3 cm) and systolic anterior motion of the anterior mitral valve leaflet (*).
Other echocardiographic findings may include a small ventricular cavity, reduced septal motion and systolic thickening, normal or increased motion of the posterior wall, abnormal rate of closure of mitral valve in middiastole (secondary to decreased LV compliance or abnormal transmitral diastolic flow), mitral valve prolapse, and partial systolic closure or coarse systolic fluttering of the aortic valve (see the image below).
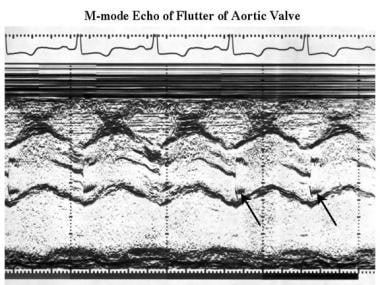 Cardiomyopathy, hypertrophic. M-mode echocardiogram shows high-frequency flutter on the aortic leaflets (arrows).
Approximately 70% of HCM patients have an LV outflow gradient of 30 mm Hg or more (2.7 m/s by Doppler). [46] Doppler ultrasonography can be used to accurately measure the gradient and to demonstrate the characteristic velocity profile due to dynamic outflow obstruction (see the image below). Distinguishing obstructive from nonobstructive forms of HCM, on the basis of the presence or absence of an LV outflow gradient, may be critical for the selection of management strategies. [46] Although the gradient may be evident when the patient is at rest, in many cases it is latent and can be identified only with exercise. [47]
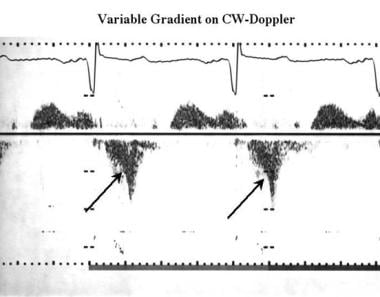 Cardiomyopathy, hypertrophic. Continuous-wave Doppler image shows a typical concave profile (arrows) compared with the systolic waveform recorded from the left ventricular outflow; this finding represents subvalvular dynamic outflow obstruction.
LV chamber dilatation and systolic dysfunction occur in about 1.5% of patients of HCM per year. [48] This dilatation can evolve into a phase resembling dilated cardiomyopathy.
In a study of left ventricular wall thickness (LVWT) measurements by contrast-enhanced echocardiography or standard echocardiography, compared to CMR, in 50 patients with HCM, contrast-enhanced echocardiography measurements were found to be closer to the reference technique (CMR) than were the measurements derived from standard echocardiography. According to Urbano et al, contrast-enhanced echocardiography may be suitable for LVWT measurement in patients with HCM if CMR is not available or not possible. [49]
Nuclear Imaging
Thallium-201 myocardial tests
This test, particularly with single-photon emission CT (SPECT) for cross-sectional imaging, can be used to assess myocardial perfusion and the relative thickness of the IVS and free ventricular walls. Gated radionuclide ventriculography permits evaluation of ventricular size, ejection fraction, and septal and wall motion. [50] Typically, Tl-enhanced images demonstrate a small LV cavity with marked Tl uptake in the hypertrophied myocardium.
Reversible perfusion defects (see the image below), which presumably reflect myocardial ischemia, are common in HCM without coronary artery disease. [51] These defects are common in adult patients with HCM and in young patients with a history of syncope and sudden death. [52] Fixed defects occur in patients with impaired systolic function and likely represent myocardial scarring. Also, technetium-99m–labeled perfusion agents can be used, with similar results.
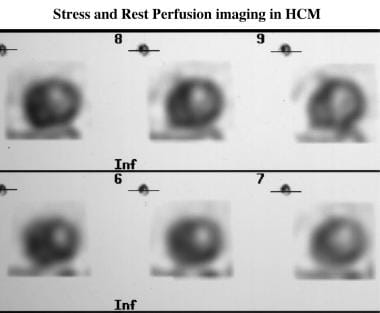 Cardiomyopathy, hypertrophic. Stress (top row) and rest (bottom row) technetium-99m Sesta-2-methoxy-isobutyl-isonitrile (MIBI) perfusion images of hypertrophic cardiomyopathy shows a reversible septal perfusion defect that is not related to coronary obstruction. The septum is markedly thickened (4 cm on the echocardiogram).
Positron Emission Tomography
Positron emission tomography (PET) has been used in patients with HCM to study myocardial blood flow as well as myocardial metabolism. [12] In patients with HCM with normal coronary arteries, myocardial perfusion PET studies have shown that although resting myocardial blood flow may be similar to that of normal control subjects, the augmentation of blood flow with vasodilation (eg, dipyridamole) may be significantly blunted. In addition, such abnormal myocardial blood flow reserve has been shown to be more pronounced in the subendocardial regions, consistent with so-called “apparent” transient ischemic cavity dilatation. [52]
Gated radionuclide ventriculography
Gated radionuclide ventriculography with bloodpool labeling permits evaluation of the size and diastolic filling of the ventricular cavity and of the motion of the septum and ventricular wall.
Myocardial scintigraphy
Myocardial scintigraphy with iodine-123-m-iodobenzylguanidine (123I-MIBG) demonstrates decreased uptake and increased clearance in the hypertrophied myocardium, and it has been shown that cardiac sympathetic activity correlates with the degree of hypertrophy function in HCM patients. [53] Scintigraphy results have proved useful for predicting prognosis in HCM. [54]
Angiography
Routine invasive cardiac catheterization to document outflow gradients is necessary only when there are discordant data from Doppler echocardiography and the physical examination. The peak-to-peak gradient obtained with catheterization most closely approximates the peak instantaneous gradient by continuous wave Doppler echocardiography. [8] Cardiac catheterization demonstrates decreased LV compliance and, in some patients, a subaortic systolic pressure gradient (see the image below). The pressure gradient may be labile, varying 0-175 mm Hg in the same patient under different conditions.
Coronary angiographic findings usually are normal, but images may show myocardial bridging. The distance between the coronary arteries on the epicardial surface and the ventricular cavity is increased, indicating myocardial hypertrophy.
Increased myocardial contractility can worsen the gradient, particularly in patients with midventricular gradient, because of a direct muscular sphincteric action. Conversely, reduction in contractility or increases in preload or afterload (which increase the LV cavity size) reduce or eliminate the outflow gradient. This dynamic characteristic of HCM distinguishes it from other forms of ventricular outflow obstruction.
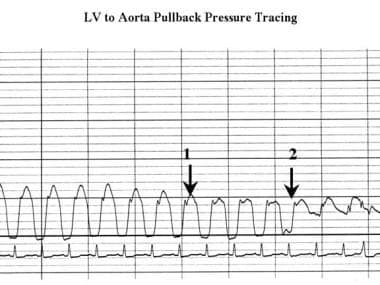 Cardiomyopathy, hypertrophic. Pressure tracing obtained as the catheter is pulled back from the center of the left ventricle to the aortic root shows a reduction in systolic pressure (arrow 1) in the left ventricle; this finding indicates a subaortic gradient. The waveform changes at the level of the aortic valve, but the systolic pressure does not change (arrow 2). Note the spike-and-dome configuration of the left ventricular pressure tracing.
The arterial pressure tracing may demonstrate a spike-and-dome configuration. Approximately 25% of patients have pulmonary hypertension, at least partly due to decreased LV compliance and elevated left atrial pressure. A right ventricular outflow tract pressure gradient occurs in 15% of patients who have LVOT obstruction, and this likely results from a markedly hypertrophied right ventricle. [55]
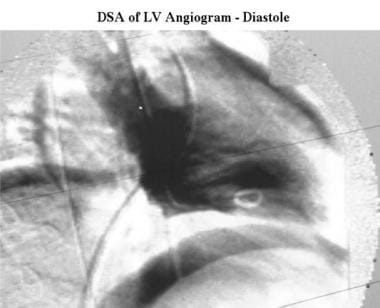
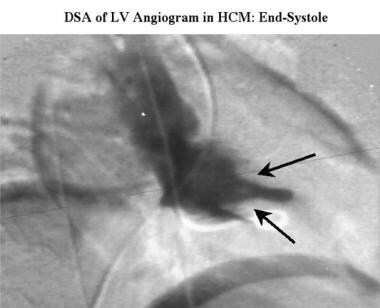
Left ventriculography reveals a hypertrophied ventricle with vigorous ejection. The papillary muscles often are prominent, filling the LV cavity at the end of systole.
In patients with apical involvement, extensive hypertrophy may result in a spadelike configuration of the LV cavity. [56] Associated mitral regurgitation may be present. Simultaneous right ventriculography in cranially angulated left anterior oblique projections can be performed for optimal evaluation of the IVS. The left septal surface is flat or it bulges into the LV cavity at its middle or lower portion, in contrast to the normal curve toward the right ventricle.
(See the images below.)
 Cardiomyopathy, hypertrophic. End-diastolic right anterior oblique digital subtraction left ventriculogram shows the normal size and shape of the left ventricle in a patient with hypertrophic cardiomyopathy.
 Cardiomyopathy, hypertrophic. End-diastolic right anterior oblique digital subtraction left ventriculogram obtained in the same study as the previous image shows a small cavity, with prominent papillary muscles (arrows) projecting into the remains of the ventricular cavity.
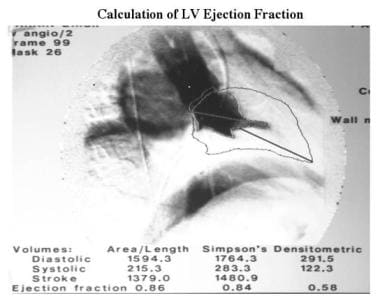 Cardiomyopathy, hypertrophic. The 2 previous images are used to calculate function and left ventricular dimensions. The outline of the end-diastolic image has been superimposed on the systolic image. Ejection fractions were calculated by using the area-length method (ejection fraction, 86%) and the Simpson rule (ejection fraction, 84%). The videodensitometric technique shown is inaccurate because of incorrect background registration.
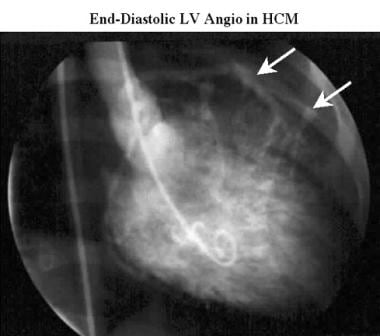 Cardiomyopathy, hypertrophic. Conventional end-diastolic right anterior oblique left ventriculogram acquired during cardiac catheterization shows the normal size and shape of the left ventricle in a patient with hypertrophic cardiomyopathy. Note the distance between the ventricular cavity and the coronary arteries (arrows), which define the epicardial surface of the heart. This distance indicates considerable thickening of the myocardium.
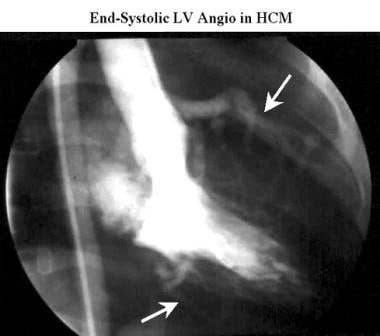 Cardiomyopathy, hypertrophic. Conventional end-systolic right anterior oblique left ventriculogram acquired during the same cardiac catheterization study as in the previous image shows a small left-ventricular cavity with mild mitral regurgitation (M). Note the increased distance between the ventricular cavity and the coronary arteries (arrows), which define the epicardial surface of the heart as the myocardium becomes thickened in systole.
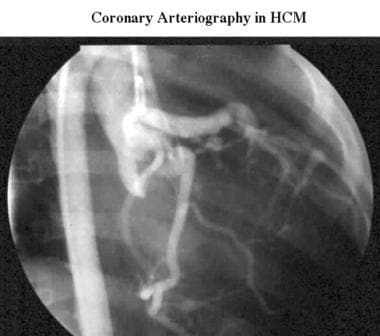 Cardiomyopathy, hypertrophic. Conventional right anterior oblique aortogram acquired during cardiac catheterization in the same patient as in the previous image shows unobstructed coronary arteries.
-
Cardiomyopathy, hypertrophic. Axial electrocardiographically (ECG) gated spin-echo MRI in a patient shows marked septal (S) and less-prominent posterior wall thickening.
-
Cardiomyopathy, hypertrophic. Oblique axial cine magnetic resonance angiogram in the same patient as in the previous image shows a spade-shaped left ventricle with relative sparing of the apical myocardium (arrow).
-
Cardiomyopathy, hypertrophic. Short-axis cine end-diastolic magnetic resonance angiogram shows asymmetric hypertrophy with septal thickening (S).
-
Cardiomyopathy, hypertrophic. Short-axis cine end-systolic, magnetic resonance angiogram obtained in the same patient as in the previous image shows marked myocardial thickening that affects the entire myocardium.
-
Cardiomyopathy, hypertrophic. Oblique cine magnetic resonance angiogram (outflow 2-chamber view equivalent to a long-axis echocardiogram) shows an area of signal intensity loss (white arrow) in the left ventricular outflow tract, where an obstruction between the hypertrophied septum and anterior mitral leaflet is present. The obstruction is well below the aortic valve ring (between black arrows).
-
Cardiomyopathy, hypertrophic. Oblique cine magnetic resonance angiogram (outflow 2-chamber view) shows prolapse (arrow) of the posterior mitral leaflet in early systole.
-
Cardiomyopathy, hypertrophic. Oblique cine magnetic resonance angiogram (outflow 2-chamber view obtained during the same study as the previous image) shows mitral prolapse of the posterior mitral leaflet with a small signal intensity loss due to mitral regurgitation (arrow).
-
Cardiomyopathy, hypertrophic. M-mode echocardiogram recorded at the level of the tips of the mitral valve (horizontal arrows) to assess left ventricular dimensions shows moderate thickening of both the septum (S) and posterior wall of the left ventricle (PW).
-
Cardiomyopathy, hypertrophic. Axial 2-dimensional echocardiogram obtained in the same patient as in the previous shows asymmetric septal thickening (23 mm) and a small left ventricular cavity (LV).
-
Cardiomyopathy, hypertrophic. M-mode echocardiogram recorded at the level of the mitral valve shows a small ventricular cavity (arrow) and systolic anterior motion of the anterior mitral valve leaflet (*).
-
Cardiomyopathy, hypertrophic. M-mode echocardiogram recorded at the level of the mitral valve in a patient with extreme septal hypertrophy (>40 mm) shows a small ventricular cavity (3 cm) and systolic anterior motion of the anterior mitral valve leaflet (*).
-
Cardiomyopathy, hypertrophic. M-mode echocardiogram shows high-frequency flutter on the aortic leaflets (arrows).
-
Cardiomyopathy, hypertrophic. Continuous-wave Doppler image shows a typical concave profile (arrows) compared with the systolic waveform recorded from the left ventricular outflow; this finding represents subvalvular dynamic outflow obstruction.
-
Cardiomyopathy, hypertrophic. Stress (top row) and rest (bottom row) technetium-99m Sesta-2-methoxy-isobutyl-isonitrile (MIBI) perfusion images of hypertrophic cardiomyopathy shows a reversible septal perfusion defect that is not related to coronary obstruction. The septum is markedly thickened (4 cm on the echocardiogram).
-
Cardiomyopathy, hypertrophic. Pressure tracing obtained as the catheter is pulled back from the center of the left ventricle to the aortic root shows a reduction in systolic pressure (arrow 1) in the left ventricle; this finding indicates a subaortic gradient. The waveform changes at the level of the aortic valve, but the systolic pressure does not change (arrow 2). Note the spike-and-dome configuration of the left ventricular pressure tracing.
-
Cardiomyopathy, hypertrophic. End-diastolic right anterior oblique digital subtraction left ventriculogram shows the normal size and shape of the left ventricle in a patient with hypertrophic cardiomyopathy.
-
Cardiomyopathy, hypertrophic. End-diastolic right anterior oblique digital subtraction left ventriculogram obtained in the same study as the previous image shows a small cavity, with prominent papillary muscles (arrows) projecting into the remains of the ventricular cavity.
-
Cardiomyopathy, hypertrophic. The 2 previous images are used to calculate function and left ventricular dimensions. The outline of the end-diastolic image has been superimposed on the systolic image. Ejection fractions were calculated by using the area-length method (ejection fraction, 86%) and the Simpson rule (ejection fraction, 84%). The videodensitometric technique shown is inaccurate because of incorrect background registration.
-
Cardiomyopathy, hypertrophic. Conventional end-diastolic right anterior oblique left ventriculogram acquired during cardiac catheterization shows the normal size and shape of the left ventricle in a patient with hypertrophic cardiomyopathy. Note the distance between the ventricular cavity and the coronary arteries (arrows), which define the epicardial surface of the heart. This distance indicates considerable thickening of the myocardium.
-
Cardiomyopathy, hypertrophic. Conventional end-systolic right anterior oblique left ventriculogram acquired during the same cardiac catheterization study as in the previous image shows a small left-ventricular cavity with mild mitral regurgitation (M). Note the increased distance between the ventricular cavity and the coronary arteries (arrows), which define the epicardial surface of the heart as the myocardium becomes thickened in systole.
-
Cardiomyopathy, hypertrophic. Conventional right anterior oblique aortogram acquired during cardiac catheterization in the same patient as in the previous image shows unobstructed coronary arteries.