Practice Essentials
Spontaneous intracranial hemorrhage (ICH) affects approximately 40,000 to 67,000 people in the United States each year, accounting for 10-20% of stroke occurrences. [1] Mortality associated with ICH is high, with 30-day mortality ranging from 35 to 52% and half of the deaths occurring within the first 2 days. [2] Among adults who present with nontraumatic intraparenchymal hemorrhage in the brain, hypertension is the most common etiology. [3, 4, 5] Intracerebral hemorrhage occurs when damaged arteries bleed directly into the brain substance.
The incidence of hemorrhagic stroke has increased worldwide over the past 40 years, with shifts in cause over time as hypertension management has improved and anticoagulant use has increased. Preclinical and clinical trials have revealed the underlying causes of ICH, as well as mechanisms of injury from ICH, including the complex interaction between edema, inflammation, iron-induced injury, and oxidative stress. Areas of promise in ICH therapy include use of prognostic biomarkers and primary prevention based on disease pathobiology, ultra-early hemostatic therapy, minimally invasive surgery, and perihematomal protection against inflammatory brain injury. [6, 7]
Prognosis depends on severity and associated complications, such as brain herniation, development of hydrocephalus, and development of arterial vasospasm in cases of subarachnoid hemorrhage. CT is the standard method for detecting ICH, but MRI is also important. For example, microhemorrhages are chronic small punctate brain hemorrhages that can only be depicted by MRI using T2∗W susceptibility imaging. The microhemorrhage pattern associated with chronic hypertension has a central distribution, located at the deep gray structures (basal ganglia and thalamus), cerebellum, and, less importantly, the cerebral corticosubcortical junction. [8, 9, 10, 11, 12]
Computed tomography (CT) is efficient and sensitive in detecting ICH. This test may be followed by MRI to evaluate for possible underlying lesions and to gain more detailed information about a hemorrhage. [10, 13, 14, 15, 16, 17, 18] ICH presents as hyperattenuation in a parenchymal, subarachnoid, subdural, or epidural location. However, interpretation of hyperattenuation can be challenging because other pathologic or nonpathologic processes, such as calcifications, vascular malformations, and highly cellular tumors, can be similar in appearance. [9]
After 7-10 days, the high density of blood begins to decrease starting from the periphery of the lesion as seen on CT. From 1-6 weeks, peripheral enhancement can be seen. This mimics the appearance of an abscess, possibly related to hypervascularity at the periphery of a resolving hematoma or disruption of the blood-brain barrier. By 2-4 months, decreased density indicates cavity formation. A residual cavity, which is the final stage, is visible after complete absorption of necrotic and hemorrhagic tissue.
(See the images below.)
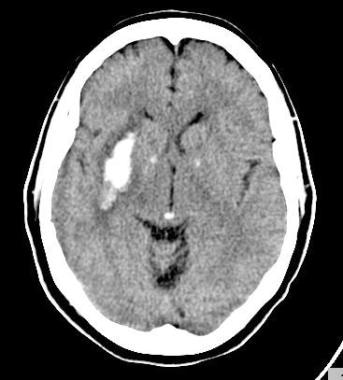 A 59-year-old female with hypertension who presented with left-sided weakness demonstrated a right putaminal hemorrhage on noncontrast CT examination of the head. Tiny hyperdense foci in the basal ganglia and pineal gland represent calcifications.
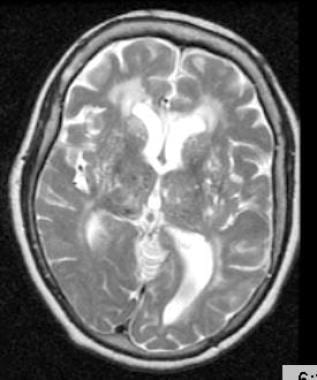 T2-weighted MRI through the thalami of a hypertensive patient demonstrates two small areas of decreased signal in the right thalamus, representing hemorrhagic lacunes.
Computed Tomography
Once an intracerebral hemorrhage (ICH) occurs, the most efficient way to localize the hemorrhage is by CT [19] (see the images below). The appearance of a bleed on CT depends on elapsed time since the event. If imaged in the acute stage (within approximately 4 hours), the hemorrhage is seen as an area of increased attenuation, measuring from 40 to 90 Hounsfield units. High attenuation of an acute intracranial bleed on CT may persist for approximately 1 week. Increased density of blood in relation to the surrounding parenchyma of the brain relates to the hemoglobin protein contained in extravasated blood. Therefore, for severely anemic patients, one should look carefully for acute blood that may be isodense or hypodense to the brain. [13, 20]
A 59-year-old female with hypertension who presented with left-sided weakness demonstrated a right putaminal hemorrhage on noncontrast CT examination of the head. Tiny hyperdense foci in the basal ganglia and pineal gland represent calcifications.
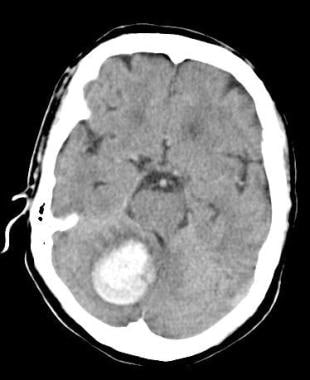 A 62-year-old female with hypertension presented with acute-onset ataxia and confusion. Noncontrast CT examination of the head showed a large right cerebellar hemorrhage, which was evacuated to relieve the mass effect on the brainstem and fourth ventricle.
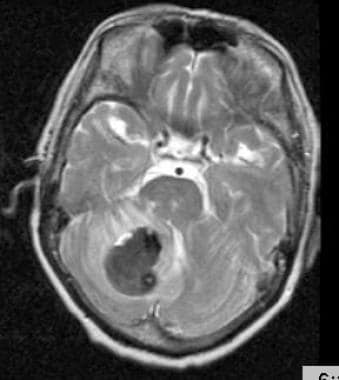 Cerebellar hemorrhage of a 62-year-old female with hypertension seen on T2-weighted MRI.
A surrounding area of low attenuation may be seen surrounding the blood, representing brain edema or extruded serum. Blood seen in the hyperacute stage may reveal a fluid-fluid level, representing the sedimentation of blood that has extravasated but has not yet clotted. A fluid-fluid level also may be seen in patients who have bled into a preexisting cyst or cavity, or in patients who have received anticoagulants.
As the hemorrhage evolves, different characteristic appearances can be identified on CT, depending on the age of the bleed.
The American Heart Association has noted up to 89% sensitivity for unenhanced brain CT and 81% for brain MRI. Imaging findings of both methods are helpful for initial diagnosis and follow-up, which is sometimes necessary a few hours after admission, especially for detecting hemorrhagic transformation or hematoma expansion. [21]
CT scan findings over time
After 7-10 days, the high density of blood begins to decrease starting from the periphery of the lesion.
From 1-6 weeks, peripheral enhancement can be seen. This mimics the appearance of an abscess, possibly related to hypervascularity at the periphery of a resolving hematoma or disruption of the blood-brain barrier.
By 2-4 months, decreased density indicates cavity formation. A residual cavity, the final stage, is visible after absorption of necrotic and hemorrhagic tissue is complete.
Magnetic Resonance Imaging
On MRI, the stage of a hemorrhage can be delineated based on chemical changes that occur in the hemoglobin molecule as the hemorrhage evolves. T1 and T2 imaging sequences also can be used. [13, 22, 23, 24, 25]
Studies have described patterns of scattered, multifocal, hypointense lesions or areas of signal loss on T2-weighted gradient-echo MRI, [11] in a distribution that correlates with areas of petechial hemorrhages in the autopsied brains of patients with chronic hypertension (see the images below).
T2-weighted MRI through the thalami of a hypertensive patient demonstrates two small areas of decreased signal in the right thalamus, representing hemorrhagic lacunes.
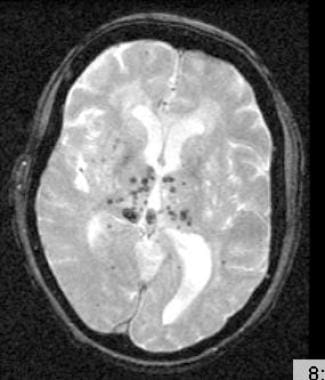 T2-weighted gradient-echo MRI through the thalami demonstrates multiple, bilateral foci of signal loss, correlating with expected locations of hypertensive petechial hemorrhages that were not seen on regular T2-weighted images.
These lesions were seen in the basal ganglia and in the thalamus, as well as in the centrum semiovale and the cerebellum. As seen on MRI, they may represent hemosiderin deposits from petechial hemorrhages related to hypertension, although histopathologic-correlative studies have not proved this consistently. Nevertheless, these foci of abnormal MRI signal hypointensity overlap with areas of small-vessel disease attributed to chronic hypertension.
-
A 59-year-old female with hypertension who presented with left-sided weakness demonstrated a right putaminal hemorrhage on noncontrast CT examination of the head. Tiny hyperdense foci in the basal ganglia and pineal gland represent calcifications.
-
A 62-year-old female with hypertension presented with acute-onset ataxia and confusion. Noncontrast CT examination of the head showed a large right cerebellar hemorrhage, which was evacuated to relieve the mass effect on the brainstem and fourth ventricle.
-
Cerebellar hemorrhage of a 62-year-old female with hypertension seen on T2-weighted MRI.
-
T2-weighted MRI through the thalami of a hypertensive patient demonstrates two small areas of decreased signal in the right thalamus, representing hemorrhagic lacunes.
-
T2-weighted gradient-echo MRI through the thalami demonstrates multiple, bilateral foci of signal loss, correlating with expected locations of hypertensive petechial hemorrhages that were not seen on regular T2-weighted images.