Filmless (Digital) Radiology
Radiologists have been looking at film images ever since Roentgen first discovered x-rays and obtained an image of his wife's hand. However, since the 1980s, radiologists have leapt into the digital world and have viewed images on computer monitors with increasing frequency. Picture archiving and communication systems (PACS), Cross-Enterprise Document Sharing for Imaging (XDS-1), and teleradiology networks are becoming commonplace, and many radiology residents are now trained with digital rather than film displays. [1, 2, 3, 4, 5, 6, 7, 8]
For many radiologists, the technical details of network architectures, bandwidths, digital archives, and digital imaging and communications in medicine (DICOM) interface compatibility are of little concern. What is most important from the clinical perspective is that the required patient images are available when needed, are available quickly, and are of high diagnostic quality. Of these, high diagnostic quality may be the primary factor from the clinician's standpoint (see the images below). [9, 10, 11, 12, 13, 14]
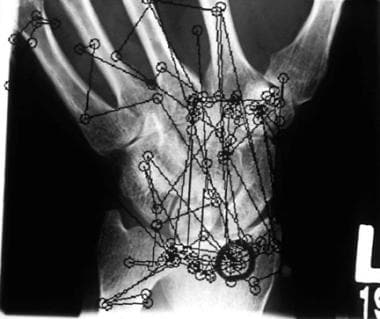 Example of a typical eye-position pattern of a radiologist searching a bone image for fractures. Each small circle represents a fixation or position where the eye lands. The lines indicate the order in which fixations were generated.
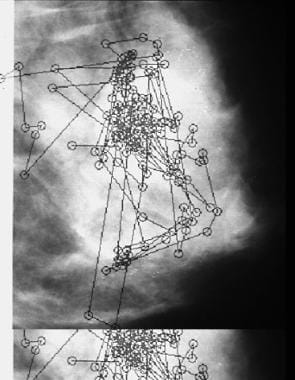 Example of a typical eye-position pattern of a mammographer searching a breast image for microcalcifications and masses. The small circles represent fixations or locations where the eye lands. The lines indicate the order in which fixations were generated.
Quality can be affected at a number of points in the digital chain before the final image is presented to the radiologist's eye-brain system. Of greatest concern to the radiologist is the final step in this chain—presentation of the clinical image on a display device, because this is what the radiologist examines and uses to make a diagnostic decision. Thus, radiologists must be aware of the issues that affect the display of digital radiographic images.
In addition to gigapixel images such as tissues or organs at subcellular resolution, metadata and quantitative measurements are also important aspects of digital imaging technology. It is estimated that neuroimaging, for example, generates over 10 petabytes (10 million gigabytes) of data every year, with continually increased data complexity. The average radiologist interprets one image every 3-4 seconds in an 8-hour workday. [15, 1, 2]
DICOM format is the current standard for storing and transmitting medical images, enabling the integration of medical imaging devices such as scanners, servers, workstations, printers, network hardware, picture archiving, and communication systems. Health Level Seven International (HL7) develops and maintains standards for exchanging, integrating, and sharing medical data. Picture archiving and communication system (PACS) serves as the health provider's primary tool for viewing and interpreting medical images, and because PACS is web-based, radiologists can more easily access images on mobile devices and computers. Further integration of PACS and EMR (electronic medical records) are considered key to optimizing teleradiology. Artificial intelligence (AI) and machine learning are also being applied to the acquisition of medical images. [16, 15, 1, 2]
Standardization approaches for PACS can be traced back to the 1980s, when the American College of Radiology (ACR) and the National Electrical Manufacturers Association (NEMA) developed standards for the interconnection of digital imaging devices. The growing amount of medical data has required continuous upgrades of both hardware and software. [17]
The increased use of preclinical imaging has resulted in a large volume of image data that require data-management tools. However, unlike DICOM-based images, preclinical images are often stored in data files in company-specific formats, which limits the availability of DICOM-based images for preclinical applications. A centralized image registry and management tool is essential for access and management of preclinical imaging research, to allow the generation of large image datasets for AI applications and for retrospective analyses. [18, 10, 11, 12, 13, 14, 19]
Research has also focused on issues of privacy protection and security in the transmission of these images, including the use of chaotic maps and watermarks. A watermarking algorithm allows digital information to be hidden in a carrier signal. The so-called robustness of the watermark measures the strength of the watermark against modifications. Research is also continuing on standardized and consistent reporting procedures. [20, 21, 22, 23, 24]
Transition to monitors
As the transition from film to monitors began to take place, it became evident that, similar to many digital images, the radiographic image on the computer monitor did not appear the same as the image on film. Initially, radiologists were skeptical and did not trust digital displays for routine clinical use. Many perceptual and ergonomic issues arose when the use of film began to decrease. Compared to the traditional method of viewing film on a light box, monitors typically are less bright, have less spatial resolution, have less contrast (dynamic range), and have a limited viewing area.
Radiologists must ensure that switching to a different viewing medium neither negatively affects diagnostic accuracy nor significantly affects workflow. [25, 26, 27, 28]
Optimizing the Digital Display for Clinical Use
Comparing monitor images to film
A number of discoveries correlate optimal monitor luminance, tone scale, and interface design with perceptual factors that impact the clinical reading environment and diagnostic accuracy. In diagnostic accuracy, performance usually is approximately the same with film as with monitor viewing. However, other aspects of performance may be affected by a change in display modality. [29, 30, 31, 32, 33]
In a comparison of film-screen mammography (FSM) versus digital mammography (DM) for detection of ductal carcinoma in situ (DCIS), DM was associated with a increased detection of DCIS and high-grade DCIS. Of 484 DCIS cases, 158 (33%) were detected by FSM and 326 (67%) were detected by DM. The detection rate of DCIS was higher for DM than for FSM (1.4 vs 0.7 per 1000), and the detection rate of high-grade DCIS for DM was double that for FSM (0.8 vs 0.4 per 1000). [4]
In one study, 3 bone radiologists and 3 orthopedic surgeons read findings from 27 patients with bone trauma, once from film and once from a monitor. [34] They searched for fractures, dislocations or subluxations, ligamentous injuries, and soft tissue swellings or effusions. The readers were required to indicate the presence and/or absence of each feature for each patient. Eye position was recorded as they searched the images. Diagnostic performance was statistically equivalent for film and monitor viewing (film = 86% true positives, 13% false positives; monitor = 80% true positives, 21% false positives), although film reading was slightly better. Viewing time and other measures of visual search performance differed significantly, as determined from eye-position recordings. Average viewing time for film was 46.45 seconds, compared with 91.15 seconds for the monitor, which was approximately twice as long (see the image below).
Example of a typical eye-position pattern of a radiologist searching a bone image for fractures. Each small circle represents a fixation or position where the eye lands. The lines indicate the order in which fixations were generated.
The primary difference between film and monitor readings was seen in visual dwell times associated with lesion-free areas of images. Average dwell time on true-negative areas was significantly longer with the monitor than with film, and because most areas on an image are lesion free, extended dwell times incrementally produced significantly longer viewing times. [35, 36]
Additionally, readers took twice as long (Student t [t] = 4.84, degrees of freedom [df] = 107, statistical probability [P] = 0.0001) to first fixate (have the eye land on) the lesion of interest with a monitor (4.67 seconds into the search) than with film (2.35 seconds into the search).
Viewing times with the monitor were extended by the 20% of fixation clusters generated during the search that were on the image-processing menu and tool bar rather than on the diagnostic image. Therefore, the computer interface may have been a distraction. Increasingly, the best interfaces are found to be simple and uncluttered and require little training to use.
This study demonstrates how factors other than diagnostic accuracy can be important. Extended viewing times per patient can yield decreased workflow, increased fatigue, and, possibly, decreased performance over time. Developing an easy-to-use, nondistracting interface is crucial to promote the use of PACS and teleradiology systems by clinical radiologists. [9, 37, 38]
Physical features of the monitor
Certain physical characteristics of the display monitor can affect diagnostic performance; therefore, these features should be examined when one is considering a monitor purchase for teleradiology and/or PACS applications in the clinical setting. Note that all of these display parameters apply to both the traditional cathode ray tube (CRT) display [39] and the multitude of liquid crystal displays (LCDs) that have become available for use in radiology. LCDs, of course, may come with their own set of limitations (eg, degradation of image quality when viewed from off-axis angles).
For example, monitor luminance reportedly affects diagnostic performance. The best monitors currently available are approximately 5 times less bright than a typical radiographic view box (1000 vs 250 foot-lambert). In one study, diagnostic performance was better with a high-luminance monitor (140 foot-lambert) than with a relatively low-luminance monitor (80 foot-lambert). [40] Eye position was recorded as 50 pairs of mammograms were viewed on each monitor (see the image below).
Example of a typical eye-position pattern of a mammographer searching a breast image for microcalcifications and masses. The small circles represent fixations or locations where the eye lands. The lines indicate the order in which fixations were generated.
As in previous studies, no significant difference in diagnostic performance was found (alternative free response receiver operating characteristic [AFROC] A1 for 80 foot-lambert = 0.9594, for 140 foot-lambert = 0.9695; t = 1.685, df = 5, P = 0.1528). However, once again, the eye-position recording revealed significantly different viewing times: 52.71 seconds versus 48.99 seconds for 80 foot-lambert versus 140 foot-lambert, respectively (t = 1.99, df = 299, P = 0.047). Concerning dwell times associated with decisions, again it was found that true-negative dwell times were affected most and were significantly longer with the 80 foot-lambert versus the 140 foot-lambert monitor.
These results suggest that changes in digital display luminance may affect the radiologist's ability to easily determine that lesion-free (ie, normal) image locations are normal. Luminance changes may increase the time required to search an image thoroughly to determine whether it is lesion free.
Perceptual linearization of monitors
Performance is better with a perceptually linearized display curve (eg, DICOM curve) than with a nonlinearized curve (eg, Society of Motion Picture and Television Engineers pattern used to calibrate monitors). The DICOM standard curve was developed to match monitor output (relative to gray levels) to the perceptual capabilities of the human visual system. [41]
The idea for perceptual linearization derives from the display of images on a monitor using 2 nonlinear mappings.
-
The first map takes recorded image data (actual numeric values from the digital image) and transforms them into luminance values on the monitor screen, which represent the monitor's display function or characteristic curve.
-
The second map transforms the display luminance according to the brightness response of the human visual system.
The optimal perceived dynamic range of the display (which affects contrast and, therefore, perception, especially of low-contrast lesions) depends crucially on the optimal combination of these 2 mappings. Standardization of display curves is important in PACS and teleradiology because these systems allow radiologists to send images from one location to another and to use different monitors for viewing. Images on one monitor must look the same on all monitors. The DICOM display standard tries to realize this ideal by setting up a standard display curve and certain other quality control measures.
In a related study, similar to the study that compared monitors of different luminances, researchers used a series of 50 mammograms to compare the performance of perceptually linearized displays with that of nonperceptually linearized displays. [42] AFROC analysis indicated that diagnostic performance was significantly higher with the perceptually linearized display (A1 = 0.972) than with the nonlinearized display (A1 = 0.951, t = 5.42, df = 5, P = 0.003).
Eye-position data also revealed significant differences concerning dwell time and visual search. With the nonlinearized display, total viewing time was longer, dwell times associated with all types of decisions (true and false, positive and negative) were longer (especially true negatives), and significantly more fixation clusters were generated during searches than with the linearized display. The choice of monitor display curve may significantly affect the radiologist's ability to detect lesions and decide if truly negative images are negative, which extends overall view time with a nonperceptually linearized display.
Display resolution considerations
Display resolution currently is an important topic in digital radiology and PACS; radiologists prefer as much resolution as possible. However, the higher the resolution of the monitor, the higher the cost. Black and white (B&W) monitors that maximize dynamic range (required for most gray-scale images) are typically more expensive than color monitors. The most common resolutions of the typical desktop computer monitor are 1024 x 1280 pixels and 1200 x 1600 pixels. Desktop monitors are typically color, which degrades the dynamic range (blacks are not as black, and whites are not as white as with a B&W monitor).
Nuclear medicine (single photon emission computed tomography [SPECT], positron emission tomography [PET]), computed tomography (CT) scanning, and magnetic resonance imaging (MRI) all produce images that are either 256 x 256 pixels or 512 x 512 pixels (for each slice). If one were to view these images on a slice-by-slice basis or by scrolling through them, a 1200 x 1600-pixel monitor potentially would suffice because these slices can be easily displayed at full resolution on such a monitor. With the advent of techniques that merge images from different modalities and use color overlays to highlight certain types of information, color monitors are desirable.
The concern with low-resolution color monitors is that they cannot provide maximum contrast resolution (CR) and spatial resolution for modalities that require B&W displays for high-resolution images to fully maximize the dynamic range. A typical CR image is approximately 2300 x 1700 pixels, making a medium-to-high-resolution monitor a requirement if the entire image is to be viewed at full resolution. The new digital mammography systems can produce images as large as 4800 x 6400 pixels.
There is some debate in radiology about whether it is necessary to display an image at full resolution all at once, or whether it is acceptable to compress the image to view it all at one time, followed by zoom or magnification to access original data and to view specific portions of the image at full resolution. A significant amount of work is being done to resolve this debate.
In general, monitors of at least 2048 x 2560 pixels should be used for primary diagnostic interpretation in radiology. This resolution will suit most modalities, especially given adequate image-processing support. Currently, 5000 x 5000-pixel monitors are available, but cost and lifetime issues are still of great concern with these displays. As noted, other characteristics need to be considered when a display device for radiology is purchased (eg, luminance, price, dynamic range); thus, spatial resolution alone should not be the deciding factor.
Although the CRT display monitor is currently the most common and reliable display device, other technologies are making an impact in digital radiology. Flat panel devices hold a lot of promise, especially in terms of display luminance. Once the angle-of-regard problem (viewing the display off-center) has been fully resolved, these new devices could represent a viable alternative to high-resolution CRT monitors. Because flat panel technology is undergoing research and development by many companies for the commercial market, radiology may benefit significantly in terms of cost if the technology can be easily adapted for clinical use.
Luminance and color
Radiographic images today are being displayed on both medical-grade (MG) and commercial off-the-shelf (COTS) color LCDs that are readily available and usually less expensive than MG grayscale displays and thus very attractive for both large and small practices. Most LCD panels are backlit with cold-cathode fluorescent lamps (CCFLs), but newer ones use light-emitting diodes (LEDs) and have thinner profiles, lower power consumption, and reportedly longer lifetimes.
In both cases, LCD/LED elements regulate the amount of backlight through the panel and backlight brightness determines display luminance. The amount of light the panel blocks sets the minimum luminance. Both LCDs and LEDs degrade or dim with time and extent of use, so they need to be replaced once the luminance is no longer in compliance with established standards (minimum 1.0 cd/m2; maximum at least 350 cd/m2 and 420 cd/m2 for mammography; luminance ratio >250). MG displays often have embedded tools that monitor and adjust backlight levels, so they are more stable than COTS displays, which require more regular manual recalibration. They typically have better luminance uniformity (~15%) than COTS displays (>20%), also owing to embedded technology that compensates for pixel luminance variation.
One main reason luminance is so important is contrast ratio, which can vary considerably because (1) the human eye adjusts to the average brightness it is exposed to, and (2) as brightness diverges from the point of adaptation, subtle contrast changes (ie, lesions in radiographic images) are more and more difficult to perceive. Very briefly, contrast sensitivity of the human visual system (HVS) can be quantified using just-noticeable differences (JNDs) or detection thresholds, which represent perceivable changes in luminance for a given displayed luminance. Most of the seminal work on modeling contrast sensitivity was done by Barten and is still used today. He determined an average HVS response based on data (detection of sinusoidal contrast patterns on different luminance backgrounds) collected from a large sample of subjects and showed that the HVS is nonlinear. In other words, the percentage contrast change required for a JND at high background luminance is lower than for a JND at low background luminance.
This means that to optimize the perceptibility of diagnostic image information, calibration methods must account for the capabilities and limitations (ie, contrast sensitivity nonlinearity) of the HVS. Barten’s model provides a means to accomplish this by producing perceptual linearity across grayscale values (by setting luminance values so changes in pixel value correspond to equal JNDs) so changes in pixel values across a grayscale range are perceived to have similar contrast. Basically, information at low luminance levels is not lost at the expense of being able to perceive information at high levels and vice versa.
The Digital Imaging and Communications in Medicine (DICOM) Part 14 grayscale standard display function (GSDF) accomplishes this, and studies have shown that diagnostic accuracy is better with a DICOM calibrated than a DICOM uncalibrated display. Although the DICOM GSDF is not perfect, it is the calibration method most widely used in radiology today.
The use and impact of the DICOM GSDF on MG grayscale displays are rather well known, but as noted previously, color displays are used more widely today in radiology than ever before for diagnostic interpretation. The DICOM GSDF does not to date have any specific recommendations for color displays in radiology, and the de facto standard is to use the GSDF for calibrating color display of grayscale images. Although older studies showed clear differences between color and monochrome displays in terms of achievable diagnostic accuracy (monochrome superior to color), most studies show that even high-quality COTS color displays can yield equivalent levels of diagnostic accuracy if properly calibrated and maintained. The American College of Radiology (ACR) standard recommends that all monitors be set to a white point corresponding to the CIE daylight standard D65 white point or a color temperature of about 6500°F.
With the advent of electronic health records and the Integrated Healthcare Enterprise (IHE), proper calibration of color displays is increasingly important. Not only are radiologists and other clinicians viewing grayscale radiographs during patient care, they are also viewing color medical images such as pathology whole slide images (WSIs), digital ophthalmology images, dermatology images, and a host of other visible light images. For current practice, very little guidance is available on the calibration or characterization of medical color displays. One possibility is to use color-device profiles conforming to the International Color Consortium (ICC) specification standard for color management of digital imaging systems, as this provides a standardized architecture, profile format, and data structure for color management, and for color data interchange between different color imaging devices.
Methods are being proposed for display of both monochrome and color medical images, but few have been validated with respect to impact on diagnostic performance. Separate calibration schemes may be required for displaying monochrome versus color images on color displays until an all-in-one method suitable for simultaneous display of both types of images has been devised. For example, one could start by taking 2 standard pathology slides that are scanned and displayed. One slide is embedded with 9 filters having colors purposely selected for hematoxylin and eosin (H&E)-stained WSIs, and the other slide is an H&E-stained mouse embryo. Displayed images are compared with a standard to identify inaccurate display of color and its causes.
Other methods include looking at display characterization and the tools used for calibration. One study characterized 3 probes for measuring display color: a modification of a small-spot luminance probe and 2 conic probes based on black frusta. Researchers have found significant differences between probes that affect the measurements used to quantify display color and have thus proposed a method to evaluate the performance of color calibration kits for LCD monitors, a universal platform (Virtual Display), to emulate tone reproduction curves.
A method developed by Silverstein et al included implementing a black-level correction and encoding it so that it was compatible with the ICC color profile structure. This group found that color reproduction accuracy improved dramatically when they used their proposed method for color display characterization and profiling using a series of COTS displays with varying preset calibrations.
In one of the only studies to examine the impact of color management and calibration on diagnostic accuracy, this method was used to compare a calibrated versus an uncalibrated (out-of-the-box) COTS NEC 2690 display for diagnosing a set of WSI breast biopsy images. Although diagnostic performance with the color-calibrated display was higher than with the uncalibrated display, no statistically significant differences in diagnostic accuracy were observed. However, viewing time was significantly shorter with the calibrated display, suggesting a slight advantage diagnostically for a properly calibrated and color-managed display and a significant potential advantage in terms of improved workflow.
Digital Displays and Computer Aids for the Radiologist
Computer-aided diagnosis
Digital displays of radiographs make possible the true clinical use of computer-aided diagnosis (CAD) schemes. The goal of CAD is similar to the goal of perceptual feedback as discussed earlier (ie, to provide the radiologist with an additional look at an image, with potential lesion locations indicated). However, instead of using eye-position information, CAD uses a variety of image-processing algorithms to detect and occasionally classify probable lesion sites. Methods of using CAD information by radiologists in the clinic and effects of CAD on diagnostic performance are becoming topics of interest. [43, 16, 44, 45, 46, 47]
Vittori et al studied the Watson Elementary (WE) CAD system regarding definitive pathologic examination in patients treated with robot-assisted radical prostatectomy (RARP), and tumor presence was confirmed in 46 (92%) WE highly suspicious areas. WE also showed a positive agreement with multiparametric MRI (mpMRI) of 92%. In predicting extraprostatic extension (EPE), WE and mpMRI showed sensitivity, specificity, positive predictive value, and negative predictive value of 0.81 vs 0.71, 0.56 vs 0.60, 0.88 vs 0.85 and 0.42 vs 0.40, respectively. [44]
Using deep learning–based CAD, Kadhim found that CAD achieved an average accuracy of 99.61% and 99.18%, respectively, in diagnosing COVID-19 with chest radiography and brain tumors with MRI. The removal of minor, redundant, and noisy features resulted in increased accuracy. [43]
Although CAD systems perform well, computers still miss lesions that the radiologist is able to find. Radiologists and a CAD system independently examined a series of 80 mammograms for microcalcification clusters, with the following findings [48] :
-
The CAD system had a true-positive rate of 83%, with 0.5 false positives per image.
-
Radiologists had true-positive rates of 78-90% and false-positive rates of 0.03-0.20 per image.
-
When the locations of CADs and radiologists' true and false positives were examined, all but 5% of true microcalcification clusters were identified by the CAD system, radiologists, or both.
-
Of the detected clusters, 10% were detected by CAD but were missed by the radiologist, and 11% were missed by CAD and were detected by a minimum of 1 radiologist.
-
Examination of lesion features revealed that CAD detected microcalcifications that radiologists judged to have few or no visible features but occasionally missed those with obvious but nontypical features.
Radiologists should be aware that CAD is not perfect, and they must learn how to use CAD as a supplement to perceptual search strategies. Radiologists should not eliminate perceptual search of images and should not rely on CAD to detect 100% of lesions. They should continue to search the entire image to better decide if a suggestive region indicated by CAD is a true lesion or a false positive.
In general, CAD probably will help most radiologists to some extent for certain types of images. Radiologists with more experience are less likely to benefit from CAD than radiologists with less experience in terms of diagnostic performance, but CAD prompts (when accuracy is high, without excessive false-positive results) may help in other ways such as improving workflow. This may be especially true in such areas as CAD for lung CT imaging, in which a significant number of images must be viewed, potentially leading to increased distraction or inattention on the part of the radiologist. CAD in this situation may reveal potential lesions and may help to focus the radiologist's search.
One study used eye-position recordings to study perceptual strategies of experienced mammographers versus residents reading mammograms with and without CAD information. [49] Significant differences based on level of expertise were found. Experienced mammographers spent more time (104 seconds) doing a more thorough search of images before they accessed CAD prompts than did residents (86 seconds). During the search without CAD, mammographers fixated more of the lesions than residents; therefore, when experienced mammographers accessed CAD pointers, they used them more often to confirm suspicions about potential lesions. This hypothesis was supported in interviews with readers conducted after the study.
Experienced mammographers in the study noted that for at least 95% of patients in whom they had detected the lesion prior to CAD, they merely glanced at the lesion with CAD to make sure the CAD was pointing to the same lesion and location. The rest of the time, they looked a little longer because the CAD prompt was not always pointing to the center of the lesion; thus, the location had to be verified more carefully. Residents appeared to use CAD to guide them to an initial inspection of potential lesions.
With this strategy, less experienced readers may not be as likely as more experienced readers to discover lesions that the CAD system did not detect. This was confirmed after the study was completed. Residents tended to state that they were not able to detect too many lesions on first glance or were very unsure of the lesions they detected. They also said that they tended to wait for CAD information because it was apt to take too long to search without it, and because there were too many confusing structures to deal with without help from CAD. However, this may not have been a good strategy.
This study also showed that the usefulness of CAD in helping radiologists determine whether lesions were present was affected. For mammographers, 50% of lesions missed without CAD were detected and reported with CAD. The original number of false negatives before CAD was higher for residents than for experienced mammographers, and only 33% of missed lesions were detected correctly and reported with CAD. Thus, although residents decided to wait for CAD information, it helped them with only approximately one third of missed lesions.
CAD can facilitate identification of a lesion, but without the necessary experience to interpret what is seen, residents do not benefit as greatly from CAD help as experienced mammographers, who are better prepared to interpret CAD findings. These and similar results may have significant implications for use of CAD in the clinical environment. Residents and radiologists who are not expert in mammography may require explicit instructions to conduct thorough searches of images before using CAD. [50]
Other viewing aids
With the exception of CAD, digital displays provide the radiologist with viewing aids that are not available with film displays. For example, typically, more general image processing (eg, window-level operations, high-pass filters, low-pass filters) is standard with most digital display workstations. [51]
Several types of image processing do not appear to improve diagnostic accuracy, while other types do. For example, one study found that radiologists' decisions were equally as likely to change from false negative to true positive as from true positive to false negative when image processing was used. [52] The conclusion is that, at least for the types of images and image-processing functions used in this study, image processing did not significantly affect diagnostic performance.
Other types of viewing aids with digital displays that may be more helpful to the radiologist include 3-dimensional (3D) displays (especially with CT scanning, MRI, ultrasound [US]) and color. Traditionally, film-based radiographic images have been displayed only in grayscale, with a dye (typically blue) as the single color added to the film base to reduce eye strain. With digital images, color has been used occasionally and may be accepted more widely in the future.
Currently, the most successful application of color to radiographic images may be seen in Doppler US for tracking flow information. In a single image, the radiologist can view both anatomy and function. A similar technique has been used in MRI, CT scanning, and nuclear medicine imaging, especially with image registration that compares images taken at different times or in 2 modalities and with 3D rendering of image data. [53, 54, 55, 56]
Whether color applications will be used on a regular basis, especially with 2D computer radiography images, remains to be seen. However, one should keep in mind that if color displays are used, a new set of standards will be required for quality control and calibration of color monitors to maintain image fidelity among monitors and over time.
-
Example of a typical eye-position pattern of a radiologist searching a bone image for fractures. Each small circle represents a fixation or position where the eye lands. The lines indicate the order in which fixations were generated.
-
Example of a typical eye-position pattern of a mammographer searching a breast image for microcalcifications and masses. The small circles represent fixations or locations where the eye lands. The lines indicate the order in which fixations were generated.


