Overview
The approach to radiographic diagnosis of bone tumors goes far beyond conventional radiographs in the present era of multiplanar and functional imaging. Radiography is still the most pertinent step in initial diagnosis of bone tumors; however, a few limitations are known, such as assessment of lesions in complex anatomy, marrow assessment, and soft tissue resolution. [1]
Diagnosis is just one aspect of tumor evaluation; extent of marrow involvement seen by tumor growth, involvement of overlying soft tissue, involvement of adjacent joints, and knowledge about skip lesions and metastasis are equally important to explore for staging and treatment of the disease. Multimodality imaging such as computed tomography (CT) and magnetic resonance imaging (MRI) is helpful in all these aspects. Positron emission tomography (PET) CT/PET MRI has further revolutionized imaging of bone tumors by providing details of anatomic and morphologic characteristics simultaneously and by combining whole body scan in the same sitting. [1]
The prognosis of patients with musculoskeletal tumors has improved markedly because of the advent of new chemotherapeutic drugs and regimens and as the result of advances in imaging and surgical techniques. Limb salvage operations can now be performed with better outcomes; in the past, limbs with tumors were treated only with amputation. Accurate preoperative surgical staging of musculoskeletal tumors is currently possible because imaging techniques provide prognostic information and aid clinicians in choosing the most appropriate treatment option for each patient. [2, 3, 4]
(See the images below.)
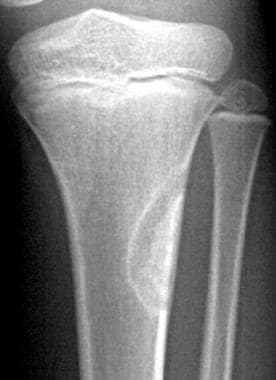 Frontal radiograph in a 9-year-old with trauma to the left knee shows a well-defined, cortically based lesion with sclerotic margins, situated on the lateral aspect of the left upper tibial metaphysis. The lesion has the typical appearance of a fibrous cortical defect. Enneking stage 0.
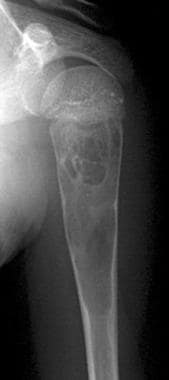 Frontal radiograph in a 10-year-old boy with pain in the left upper limb shows a well-defined, loculated, centrally located lesion in the left humeral metaphysis. Overlying cortical thinning is noted. The lesion has the typical appearance of a unicameral bone cyst. Enneking stage II.
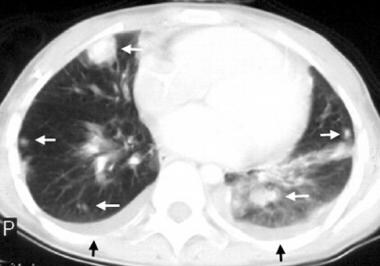 Computed tomography (CT) scan of the lungs shows multiple lung metastases (white arrows) and bilateral pleural effusions (black arrows) in a patient with osteosarcoma of the humerus. Enneking stage III.
Surgical Staging of Bone Tumors
The aims of surgical staging are to determine the surgical margins of resection and to facilitate interinstitutional and interdisciplinary communication regarding treatment data and results. [5]
The Enneking system for surgical staging of bone and soft tissue tumors is based on grade (G), site (T), and metastasis (M), and uses histologic, radiologic, and clinical criteria. It is the most widely used staging system and has been adopted by the Musculoskeletal Tumor Society. [6, 7, 8, 9] This system should be reserved for staging mesenchymal rather than nonmesenchymal lesions (such as lesions of Ewing sarcoma, lymphoma, and leukemia) because the biologic behavior of nonmesenchymal tumors differs from that of mesenchymal lesions. For example, studies have shown that the site of occurrence of Ewing sarcoma is not a significant factor when tumor size is considered.
Grade
In the Enneking system, bone tumors are graded as follows:
-
G0 - Benign lesion
-
G1 - Low-grade malignant lesion
-
G2 - High-grade malignant lesion
Surgical grade generally follows histologic grade; however, a higher surgical grade may be applied if radiographic features and clinical behavior of a lesion indicate an aggressiveness that is incompatible with its benign histologic features.
Site
In the Enneking system, site and local extent of bone tumors are classified as follows:
-
T0 - A benign tumor that is confined within a true capsule and the lesion's anatomic compartment of origin (ie, a benign intracapsular, intracompartmental lesion)
-
T1 - An aggressive benign or malignant tumor that is still confined within its anatomic compartment (ie, an intracompartmental lesion)
-
T2 - A lesion that has spread beyond its anatomic compartment of origin (ie, an extracompartmental lesion)
Metastasis
Metastatic classification in the Enneking system is as follows:
-
M0 - No regional or distant metastasis
-
M1 - Regional or distant metastasis
Staging
Under the Enneking system, malignant tumors are classified into stages I to III, with further subdivision into A and B. Grade 1 and grade 2 tumors are stage I and stage II, respectively. T1 and T2 tumors are stage A and stage B, respectively. Tumors with distant metastasis are stage III (Table 1).
Table 1. Enneking System for Surgical Staging of Malignant Bone and Soft Tissue Tumors (Open Table in a new window)
Stage |
Grade |
Site |
Metastasis |
IA |
G1 |
T1 |
M0 |
IB |
G1 |
T2 |
M0 |
IIA |
G2 |
T1 |
M0 |
IIB |
G2 |
T2 |
M0 |
III |
G1 or G2 |
T1 or T2 |
M1 |
In the Enneking staging system, benign tumors are divided into latent, active, and aggressive tumors (Table 2). Latent tumors are asymptomatic and are usually discovered incidentally. They reach a stage of nongrowth after a period of slow growth. Active tumors are mildly symptomatic and may be discovered if pathologic fracture occurs, or if the tumor is associated with mechanical dysfunction. Active tumors usually grow steadily. Aggressive benign lesions grow rapidly and usually are symptomatic and tender on palpation.
Table 2. Enneking System for Surgical Staging of Benign Lesions (Open Table in a new window)
Stage |
Description |
Grade |
Site |
Metastasis |
1 |
Latent |
G0 |
T0 |
M0 |
2 |
Active |
G0 |
T0 |
M0 |
3 |
Aggressive |
G0 |
T1 or T2 |
M0 or M1 |
Limb Salvage Surgery and Staging
The aim of limb salvage surgery is to cure disease while preserving limb function for the patient. This aim is usually achieved through a combination of limb salvage surgery and adjuvant therapy.
Limb salvage operations are indicated if the following conditions are satisfied:
-
Tumor is found in the extremities and/or in the axial skeleton
-
Tumor margins are amenable to surgery
-
Only moderate soft tissue extension is present
-
Neurovascular bundles are intact
-
Metastases are absent or are amenable to curative treatment
-
Patient is in good general health
Optimal surgical resection margins consist of 6 cm of healthy bone around bone margins and 2 cm of healthy soft tissue around the soft tissue extent of the tumor. If a malignant tumor is responsive to chemotherapy, smaller resection margins may be acceptable.
The Enneking classification correlates tumor stage with excision margins as described in the next sections.
Benign tumors
Staging is as follows:
-
Stage 1 - Intracapsular excision (or curettage) is adequate
-
Stage 2 - Extracapsular excision passing through the reactive zone is needed
-
Stage 3 - Wide margins of resection are required for stage III lesions (aggressive benign tumors). In areas that are not amenable to wide excision, marginal excision together with adjuvant treatment (eg, radiation therapy) may be acceptable
Malignant tumors
Staging is as follows:
-
Stage IA - Tumors are treated with wide excision and are usually amenable to limb salvage procedures
-
Stage IB - Tumors may be treated with wide excision, but the choice between amputation and limb salvage depends on the estimated amount of residual tumor left behind after a limb salvage procedure
-
Stage II - Tumors are high grade, are usually extracompartmental, and have significant risk for skip metastases. They usually are not amenable to limb salvage operations and most often require radical amputation or disarticulation. However, bone tumors responsive to chemotherapy may be treated successfully via wide excision and adjuvant therapy
-
Stage III - Tumors are responsive to chemotherapy and may be treated with aggressive resection. Those not responsive to adjuvant therapy should be treated with palliative resection
Imaging
The spectrum of musculoskeletal (MSK) interventions is continually broadening and rapidly evolving. MSK interventions for treatment of oncologic conditions and treatment of conditions related to sports injury can be performed with different imaging modalities; however, there is usually one optimal imaging modality for each procedure and patient. [10]
Radiography
Radiography is the initial imaging modality in evaluation of bone tumors. [11, 12] Some benign lesions have characteristic radiographic features that make biopsy unnecessary. Examples include fibrous cortical defects, bone islands, simple bone cysts, bone infarcts, and typical variants such as pseudocysts of the humerus and calcaneus.
Radiographs are commonly used as screening examinations for fractures and joint dislocations, in postsurgical follow-up of bone fixation procedures, and for arthritis assessment. Drawbacks include radiation exposure for the patient, relatively low sensitivity for certain types of subtle fractures such as nondisplaced intra-articular fractures, and low soft tissue contrast. [13]
(See the images below.)
Frontal radiograph in a 9-year-old with trauma to the left knee shows a well-defined, cortically based lesion with sclerotic margins, situated on the lateral aspect of the left upper tibial metaphysis. The lesion has the typical appearance of a fibrous cortical defect. Enneking stage 0.
Frontal radiograph in a 10-year-old boy with pain in the left upper limb shows a well-defined, loculated, centrally located lesion in the left humeral metaphysis. Overlying cortical thinning is noted. The lesion has the typical appearance of a unicameral bone cyst. Enneking stage II.
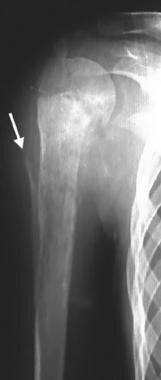 Frontal radiograph in a 16-year-old girl with pain in the right upper limb shows a metaphyseal lesion with ill-defined, permeative destruction. Cortical erosion and a Codman triangle are seen (arrow). These are the radiographic features of an aggressive lesion that was proven subsequently to be osteosarcoma. Enneking stage IIB.
Radiographic features can help distinguish malignant from benign bone lesions in many patients. [14] Lodwick and colleagues established a radiographic grading system based on analysis of the radiographic features of a bony lesion. [15, 16] Important radiographic signs for grading bone tumors are listed as follows, in order of priority:
-
Pattern of destruction - Geographic or not geographic; appearance of marginal interface zone
-
Penetration of cortex by the lesion
-
Absence or presence of a sclerotic rim
-
Absence or presence of expanded cortical shell, as well as its extent
The grading system developed by Lodwick and coauthors groups lesions into 3 grades:
-
Grade 1A, 1B, and 1C - Benign lesions with edge characteristics ranging from well defined to poorly defined
-
Grade 2 - Low-grade malignant lesions with invasive features; grade applies particularly to lesions demonstrating total penetration of the cortex
-
Grade 3 - High-grade malignant lesions with invasive, permeative, and destructive features
Sundaram's grading system divides bone lesions into 4 groups, each with individual management algorithms [17, 18] :
-
Group 1 - Radiographically benign lesions that do not require further investigation or treatment
-
Group 2 - Lesions with a high likelihood of being benign that should be confirmed as benign via clinical or radiographic follow-up examination
-
Group 3 - Benign lesions that require surgical resection because of aggressive behavior or a risk of pathologic fracture
-
Group 4 - Aggressive-appearing lesions that should be considered malignant but on which biopsy should be performed to confirm diagnosis and histologic grade
Computed tomography
In staging of bone tumors, computed tomography (CT) scanning has a role in providing detailed evaluation of local disease and in assessing the lungs for pulmonary metastases.
CT scans are commonly used for evaluating complex fractures (such as comminuted intra-articular fractures) and occult fractures (such as nondisplaced or mildly displaced intra-articular and spinal fractures), where osseous structures and fractures may be vague or obscured on radiographs. CT may also be used in bone or soft tissue tumor assessment, as well as for arthrograms in cases where MRI examination is contraindicated for a particular patient. As in the case of radiographs, drawbacks again include radiation exposure (higher than with a radiograph, although progress is being made toward lower radiation doses) and artifact from very dense objects within (hardware) or around (external fixators, monitoring devices) the patient. [13]
In evaluating local disease, CT scanning complements radiography because it can be used to assess disease in areas that are not easily visualized with radiography, such as the spine and the pelvis. In addition, CT scanning is better in determining the type of cortical destruction that has occurred and in assessing whether matrix mineralization is present. CT scanning is also helpful in determining the internal contents of some lesions.
(See the images below.)
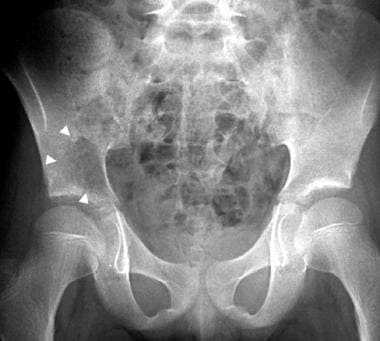 Frontal radiograph in an 11-year-old girl with back pain shows an ill-defined, lytic lesion in the right iliac bone, just above the acetabulum (arrowheads). The lesion was proven to be a Ewing sarcoma. The Enneking staging system is not used for nonmesenchymal lesions such as Ewing sarcoma.
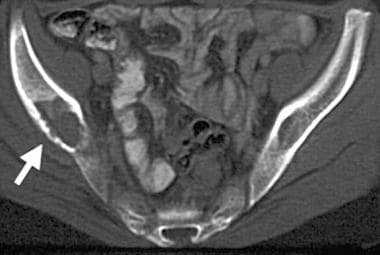 Computed tomography (CT) scan demonstrates the characteristics of a lytic lesion such as destruction of the thin, overlying cortex (arrow) of the right iliac bone.
Computed tomography (CT) scan of the lungs shows multiple lung metastases (white arrows) and bilateral pleural effusions (black arrows) in a patient with osteosarcoma of the humerus. Enneking stage III.
Computed tomography (CT) scan demonstrates the characteristics of a lytic lesion such as destruction of the thin, overlying cortex (arrow) of the right iliac bone.
Computed tomography (CT) scan of the lungs shows multiple lung metastases (white arrows) and bilateral pleural effusions (black arrows) in a patient with osteosarcoma of the humerus. Enneking stage III.
Magnetic resonance imaging (MRI) is generally accepted to be superior to CT scanning in evaluation of local tumor spread. CT scans have been shown to be more accurate than chest radiographs in evaluating the lungs for the presence of metastases. However, CT scans may produce false-positive results when small lung nodules are detected. Follow-up CT scans are useful in monitoring the nodules.
Magnetic resonance imaging
MRI has several advantages over other imaging modalities in visualizing and staging bone tumors. In particular, accurate depiction of soft tissues allows sensitive detection of soft tissue extension of and medullary involvement by a tumor. MRI can be performed in several orthogonal planes. Absence of ionizing radiation and of beam-hardening artifacts is an advantage of MRI over CT scanning. [19, 20, 21, 22] MRI is the modality of choice for imaging and staging of bone tumors. [23, 24]
Technical considerations
Technical considerations for MRI include the following:
-
Obtain magnetic resonance images before performing a biopsy
-
Position the patient comfortably to minimize motion artifacts
-
Use sedation if needed (sedation is often required in children)
-
Place a vitamin E or cod liver oil capsule over the site of interest
-
Use appropriate coils
-
Perform imaging in at least 2 planes
Sequences
Perform conventional T1-weighted and T2-weighted, spin-echo sequences because they provide reproducible images. Typically, pathology appears as areas of low signal intensity on T1-weighted images and as areas of high signal intensity on T2-weighted images.
Fast spin-echo sequences with fat suppression also are popular imaging sequences; they are used at many centers because of time-saving advantages. [25]
Short T1 inversion recovery (STIR) sequences provide fat-suppressed images with T1- and T2-additive effects. STIR sequences are particularly useful for detection of small lesions and bone marrow abnormalities. [26]
Contrast agents
Intravenous administration of gadolinium diethylenetriamine penta-acetic acid (Gd-DTPA) increases signal intensity on T1-weighted images by reducing T1 relaxation time. This feature is useful in distinguishing necrosis from active tumor and in differentiating cystic lesions from solid lesions. Although some authors have indicated that MRI contrast agents do not improve tumor detection or staging accuracy, most have found that administration of MRI contrast agents is useful in making difficult diagnoses.
Gadolinium-based contrast agents have been linked to the development of nephrogenic systemic fibrosis (NSF) or nephrogenic fibrosing dermopathy (NFD). This debilitating and sometimes fatal disease has occurred in patients with moderate to end-stage renal disease after they were given a gadolinium-based contrast agent to enhance MRI or magnetic resonance angiography (MRA) scans. [27, 28] Characteristics include red or dark patches on the skin; burning, itching, swelling, hardening, and tightening of the skin; yellow spots on the whites of the eyes; joint stiffness with trouble moving or straightening the arms, hands, legs, or feet; pain deep in the hip bones or ribs; and muscle weakness. [29]
Role in diagnosis
In many cases, MRI cannot provide a histologic diagnosis of soft tissue lesions. [30] However, some lesions have an appearance that is characteristic enough for a histologic diagnosis based on MRI findings. Examples of such lesions include lipomas, superficial and skeletal muscle hemangiomas, benign neural tumors, periarticular cysts, hematomas, and pigmented villonodular synovitis.
The most common soft tissue lesions diagnosed with MRI are lipomas. They appear well circumscribed, homogeneous, and isointense relative to subcutaneous fat on images obtained with all pulse sequences. Thin, low-intensity septa are sometimes seen in lipomas.
The following general guidelines regarding the relationship between MRI signals and histologic tissue types can be made:
-
Tumor tissue is usually low in signal intensity on T1-weighted images and high in signal intensity on T2-weighted images
-
Mineralized matrix is seen as areas of low signal intensity on T1-weighted and T2-weighted images
-
Areas of hemorrhage are seen as areas of high signal intensity on T1-weighted and T2-weighted images
-
Measurement of T1 and T2 relaxation times is useful in determining histologic features
Imaging criteria used in differentiating benign from malignant lesions on radiographs and on CT scans can be applied to MRI. [31] Typically, benign lesions are well defined and are sharply demarcated from surrounding healthy tissue. Malignant lesions are typically more extensive and involve surrounding tissue to a greater extent than do benign lesions. However, MRI signal intensity alone is not reliable in distinguishing between benign and malignant tumors.
MRI provides anatomic details of structures around joints such as tendons, ligaments, labrum, menisci, and cartilage. This modality also offers detailed evaluations of bone marrow in cases of tumor or infection, as well as of supporting muscles and nerves. In addition to standard MRI techniques, advanced technologies such as GE Extremity MRI—an open system dedicated to scanning hands, wrists, elbows, feet, ankles, and knees—offer patients the greatest level of comfort and convenience. [32]
MR arthrography provides fine image resolution of various joints, usually hip or shoulder. This test requires injection of diluted MRI contrast into the joint before MRI is performed. The presence of contrast allows for detailed evaluation of the joint, particularly of cartilage and labrum. MR arthrography also helps detect subtle tendon tears and is useful post surgery. [32]
Role in staging
MRI is the modality of choice for assessing local spread of tumor (Enneking sites T1 and T2). MRI can accurately detect tumor involvement of neurovascular structures, muscle compartments, growth plates, and joints.
MRI is accurate in determining involvement of the neurovascular bundle. MRA may provide additional information regarding neurovascular bundle involvement. MRA can help in assessing peripheral vascular branches and tumor neovascularity. By demonstrating treatment-induced changes in tumor neovascularity, MRI may help the clinician to assess the response of tumor to treatment.
Although MRI usually accurately depicts the intramedullary spread and soft tissue extension of a tumor, differentiating tumor edema from true tumor spread may occasionally be difficult. Typically, edema is seen as an ill-defined, homogeneous, hyperintense area with a featherlike appearance. Edema tends to follow the tissue planes; it has no mass effect, and, unlike the distinct pseudocapsule of tumor tissue, it possesses a fading margin. Administration of Gd-DTPA aids in distinguishing tumor tissue from tumor edema because tumor tissue enhances, and edema does not. Intramedullary spread and soft tissue extension of a tumor are more accurately assessed with MRI than with CT scanning.
The accuracy of MRI for evaluation of joint involvement is controversial. Enhancement of joint synovium after Gd-DTPA administration may mimic tumor involvement. Joint effusion alone is not diagnostic of tumor involvement.
Role in assessing response to treatment
MRI is increasingly used to assess tumor response to preoperative chemotherapy. This assessment is achieved by evaluating changes in tumor size, margins, signal intensity, and enhancement patterns. [33, 34, 35, 36, 37, 38, 39]
After chemotherapy, poor tumor response with no reduction in tumor size usually indicates a poor histologic response; however, a substantial reduction in tumor size does not necessarily indicate a good prognosis. In most patients with Ewing sarcoma, a marked decrease in tumor size is an expected finding. [40] MRI findings of residual soft tissue components and tumor volume are usually correlated with the histologic response of tumor to chemotherapy. Tumors that decrease in size by 25% and 75% after chemotherapy show substantial overlap between good responses and poor responses.
Postchemotherapeutic MRI signal intensity changes
MRI patterns are often unpredictable because tumors undergo necrosis, hemorrhage, edema accumulation, granulation tissue formation, and fibrosis after chemotherapy. [41, 42] General indicators of good response to chemotherapy include the following:
-
Decreasing signal intensity on T2-weighted images
-
Circumferential hypointense rim combined with decreased size of the soft tissue component in patients with Ewing sarcoma
-
Increased homogeneous signal intensity on T2-weighted images in Ewing sarcoma (indicating tumor replacement by a hypocellular mucomyxoid matrix)
Contrast-enhanced MRI
Intravenous administration of Gd-DTPA helps differentiate remnant tumor from nontumorous tissue. Because of its greater vascularization, tumor tissue enhances more than does nontumorous tissue. However, the presence of vascularized granulation tissue, neovascularity in necrotic areas, or reactive hyperemia also may cause Gd-DTPA enhancement on static MRI, making tumor-free tissue difficult to differentiate from tumor tissue.
Dynamic, contrast-enhanced magnetic resonance images are better than static images for determining a tumor's response to chemotherapy. Images in patients who respond well to chemotherapy show a reduction in enhancement, whereas those in patients who respond poorly show little or no reduction. Images should be acquired by using short time intervals because reactive changes may show contrast enhancement indistinguishable from that of tumor in later phases of enhancement.
Parametric first-pass imaging and subtraction MRI have been used to improve detection of early arterial enhancement of residual viable tumor.
Use of magnetic resonance spectroscopy with phosphorus-31 to assess changes in tumor metabolism and to monitor changes in spectra has been evaluated. This technique has limitations because of the difficulty of obtaining representative spectra in all locations within the tumor, contamination of tumor spectra with phosphorus in adjacent soft tissues, and insensitivity of the technique to tumor heterogeneity.
Role in detecting recurrence
Differentiation between tumor recurrence and chronic post-therapeutic changes remains a difficult challenge. In general, recurrence is suggested when T1-weighted imaging demonstrates a hypointense lesion, which then enhances after Gd-DTPA administration and appears hyperintense on T2-weighted images. Chronic, post-therapeutic changes in a nonnodular lesion have low to intermediate signal intensity on T1-weighted images and lack high signal intensity on T2-weighted images.
Static, contrast-enhanced MRI may not always be helpful in distinguishing recurrent tumors from post-therapeutic changes because the latter may also show enhancement after administration of Gd-DTPA. Dynamic, contrast-enhanced MRI may prove beneficial by demonstrating early enhancement in tumor tissue that is not seen in post-therapeutic changes.
Fatty marrow may reconvert to hemopoietic marrow in children with osteosarcoma who have been treated with chemotherapy and granulocyte colony-stimulating factor. [43] When such reconversion occurs in a patient, marrow on magnetic resonance images may resemble recurrent tumor, although reconverted marrow usually appears bilateral and symmetric. Signal intensity of reconverted marrow is similar to that of skeletal muscle and is unlike signal intensity of recurrent tumor.
Tumor recurrence may be difficult to detect when orthopedic implants are in close proximity to tumor sites. Orthopedic implants may cause susceptibility artifacts, making evaluation of surrounding tissues difficult. Susceptibility artifacts occur at interfaces of structures with markedly different magnetic susceptibilities. Pure titanium orthopedic implants are nonferromagnetic, whereas some alloys are ferromagnetic. Susceptibility artifacts may be decreased by optimally positioning patients with orthopedic implants, by switching the orientation of frequency- and phase-encoding gradients, by using the smallest voxel size, and by choosing fast spin-echo sequences. Susceptibility artifacts are more severe in gradient echo sequences and in sequences with long echo time.
Novel techniques such as diffusion-weighted MRI, spectroscopy, and chemical shift are expanding the role of MRI in characterization of musculoskeletal tumors. MRI-defined "habitats" in sarcoma provide another novel and evolving method for characterizing and quantifying features on MRI so as to provide prognostic and therapeutic information. [44]
Musculoskeletal tumor ultra-high field (UHF) MRI is promising. Higher resolution and enhanced signal-to-noise ratio have improved tumoral assessment, infiltration, and cortex changes. One could expect this nonradiating technique to replace CT investigation for bone tumor assessment and to open new perspectives in the fields of vascular or nerve salvage and response to chemo/radiotherapy. Healthy tissue sparing might be facilitated with impact on function, complications, or reconstruction type. [45]
Radiologic studies and interventions
Nuclear medicine studies
Radionuclide bone scans are commonly obtained by using technetium-99m (99mTc)–labeled diphosphonate to stage bone tumors.
Radionuclide bone scanning has a role in detecting metastases, skip lesions, lesion multiplicity, and postoperative tumor recurrence. Bone-forming, metastatic lesions in the lungs (eg, osteosarcoma) are occasionally detected with bone scintigraphy (see the image below). [46, 47, 48]
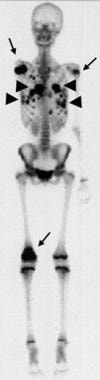 Disarticulation of the right shoulder was performed in this patient with right humeral osteosarcoma. A radionuclide bone scan obtained 5 months after surgery shows abnormal focal areas of increased tracer uptake in the right scapula, left upper humerus, and right distal femur (arrows). These uptake areas correspond to bony metastases. Abnormal areas of increased tracer uptake are seen in the lungs, corresponding to pulmonary metastases (arrowheads). Enneking stage III.
Areas showing increased tracer uptake in the skeleton should be evaluated by using radiography. Further evaluation with CT scanning or MRI may be necessary if plain radiographic findings are negative. Biopsy may be necessary if a positive result might change the patient's treatment.
Ultrasonography
Soft tissue masses and soft tissue components of bony tumors may be visualized on ultrasonography (US). [49] The histologic diagnosis of lesions usually cannot be made by using US. The aim of US in evaluation of musculoskeletal lesions is to confirm the presence of a lesion, to determine if the lesion is cystic or solid, to assess the relationship of the mass to surrounding structures (eg, neurovascular bundle), to evaluate the vascularity of the mass, and to guide interventional procedures if indicated.
Although color Doppler ultrasonographic evaluation of the mass is unreliable in determining the histologic diagnosis of the lesion and whether the lesion is benign or malignant, color Doppler US is a useful tool for monitoring regression of tumor neovascularity induced by therapy in patients with musculoskeletal sarcoma. When clinical findings suggest recurrence of a soft tissue sarcoma, US can be used as the initial imaging technique for evaluation. US can be used in addition to MRI when susceptibility artifacts secondary to orthopedic hardware (including prostheses) prevent evaluation of specific areas.
Angiography
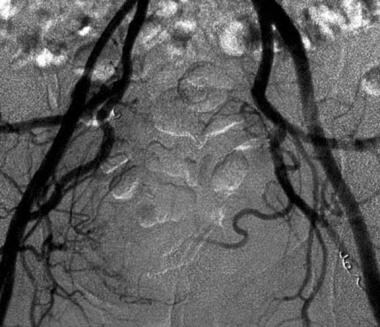
Currently, angiography is used only occasionally to evaluate neurovascular bundle involvement. Its role has largely been replaced by those of cross-sectional imaging modalities. Angiography still has a postoperative role in decreasing hemorrhage through embolization of tumor-supplying vessels (see the images below).
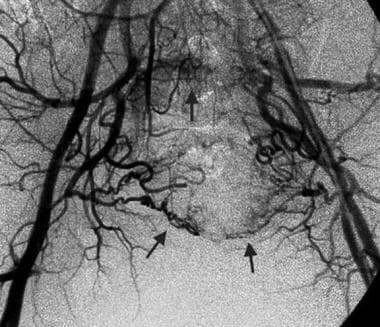 Pre-embolization, bilateral iliac angiogram in a 51-year-old man with sacral chordoma shows tumor hypervascularity (arrows). Image courtesy of Austin MM Htoo, FRCP, FRCR.
 Postembolization angiogram shows a reduction in tumor vascularity. Embolization was performed with Gelfoam and coils. Image courtesy of Austin MM Htoo, FRCP, FRCR.
Positron emission tomography
Positron emission tomography (PET) scanning was developed in the 1960s and has increasingly been used at some centers for detecting and staging malignancy. PET scanning can be used to image tumor metabolism through detection of photons emitted from tissue after intravenous injection of a pharmaceutical such as 2-[fluorine 18]-fluoro-2-deoxy-D-glucose (FDG). [50, 51, 52, 53, 54, 55, 56]
These photons are detected by the PET scanner and are reconstructed into a 3-dimensional image. Tumor metabolism is higher than that of normal tissue and shows higher FDG uptake. In bone tumors, the degree of FDG uptake is related to the histologic grade of the tumor. However, increased FDG uptake in a tumor does not necessarily indicate malignancy, because increased uptake can also be seen in benign bone lesions, such as nonossifying fibromas, fibrous dysplasia, giant cell tumors, eosinophilic granulomas, and aneurysmal bone cysts.
PET has been shown to have sensitivity similar to that of serial CT scanning and MRI for detecting lesions and for distinguishing postsurgical scarring from recurrent tumors. However, the specificity of PET is higher than that of serial CT scanning or MRI.
In evaluating musculoskeletal sarcomas, when it comes to detecting recurrent tumor, FDG-PET scanning has higher sensitivity and specificity, as well as a greater positive and negative predictive value, than does iodine-131-meta-iodobenzylguanidine (MIBG) scanning.
In summary, PET scanning appears to be better than CT scanning and MRI in depicting residual or recurrent tumor after treatment. The main disadvantage of PET scanning is the high cost of the equipment, which limits the modality's availability.
Radiologic interventions
Image-guided biopsy is less expensive and safer than open biopsy. The biopsy site should be located where the needle tract will be excised in future surgery because of possible tumor seeding along the needle tract. Fluoroscopy with C-arm guidance, CT scanning, and MRI can be used to locate the most appropriate biopsy site. The primary advantage of fluoroscopy is its ability to create dynamic images.
CT-guided biopsy is usually employed if the lesion is located in a complicated part of the anatomy, such as the upper thoracic spine or pelvis (see the image below). [57]
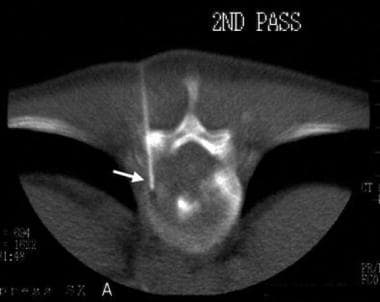 Biopsy of a vertebral body tumor. A 17-gauge bone-cutting needle is inserted through the left T11 pedicle (arrow).
For aspiration cytology, a fine-gauge needle is used. For a lesion that predominantly consists of soft tissue components, a cutting needle is usually chosen. For bone tumors, a combined trephine and cutting needle is utilized. The needle tract should pass through bony and soft tissue components of the tumor, allowing for complete histologic examination. Hemorrhage, infection, and trauma to surrounding tissues are complications of biopsy.
Conclusions
Imaging evaluation of musculoskeletal tumors involves a multimodality approach. Each modality provides different diagnostic information. The patient's history and physical examination findings and the location of the abnormality determine the type of imaging modality selected. Initial evaluation of bone and soft tissue tumors is typically performed with plain radiography, followed by a cross-sectional modality such as computed tomography (CT) or magnetic resonance imaging (MRI). Nuclear medicine scintigraphy, ultrasonography (US), and positron emission tomography (PET) may also be performed in conjunction with or after initial assessment. MRI is the technique of choice for imaging assessment of soft tissue tumors, whereas CT or MRI can be used to determine the extent of disease in bone tumors. [44]
-
Frontal radiograph in a 9-year-old with trauma to the left knee shows a well-defined, cortically based lesion with sclerotic margins, situated on the lateral aspect of the left upper tibial metaphysis. The lesion has the typical appearance of a fibrous cortical defect. Enneking stage 0.
-
Frontal radiograph in a 10-year-old boy with pain in the left upper limb shows a well-defined, loculated, centrally located lesion in the left humeral metaphysis. Overlying cortical thinning is noted. The lesion has the typical appearance of a unicameral bone cyst. Enneking stage II.
-
Frontal radiograph in a 16-year-old girl with pain in the right upper limb shows a metaphyseal lesion with ill-defined, permeative destruction. Cortical erosion and a Codman triangle are seen (arrow). These are the radiographic features of an aggressive lesion that was proven subsequently to be osteosarcoma. Enneking stage IIB.
-
Frontal radiograph in an 11-year-old girl with back pain shows an ill-defined, lytic lesion in the right iliac bone, just above the acetabulum (arrowheads). The lesion was proven to be a Ewing sarcoma. The Enneking staging system is not used for nonmesenchymal lesions such as Ewing sarcoma.
-
Computed tomography (CT) scan demonstrates the characteristics of a lytic lesion such as destruction of the thin, overlying cortex (arrow) of the right iliac bone.
-
Computed tomography (CT) scan of the lungs shows multiple lung metastases (white arrows) and bilateral pleural effusions (black arrows) in a patient with osteosarcoma of the humerus. Enneking stage III.
-
Osteosarcoma of the right humerus. Fast spin-echo, T2-weighted, coronal magnetic resonance image shows a large, metaphyseal-based lesion of mixed signal intensity with a large soft tissue component (arrows). Enneking stage IIB.
-
Short T1 inversion recovery (STIR), coronal magnetic resonance image shows the lesion's extent and a large, soft tissue component. Enneking stage IIB.
-
T1-weighted, fat-saturated, axial magnetic resonance image demonstrates the lesion and its soft tissue component (arrowheads). Enneking stage IIB.
-
T1-weighted, fat-saturated, axial magnetic resonance image acquired after intravenous administration of gadolinium diethylenetriamine penta-acetic acid shows marked enhancement and increased signal intensity in the lesion and in its soft tissue component (arrowheads). Enneking stage IIB.
-
Fast spin-echo, T1-weighted, axial magnetic resonance image obtained with fat saturation and administration of gadolinium diethylenetriamine penta-acetic acid in a 13-year-old boy with osteosarcoma of the left distal femur. The image shows enhancing tumor tissue that extends circumferentially into surrounding soft tissues. The distal femoral vessels are almost involved (arrowheads). Enneking stage IIB.
-
Fast spin-echo, T2-weighted, coronal magnetic resonance image with fat saturation demonstrates the presence of a tumor within the medullary cavity (small arrow) and extending to the midshaft of the femur (large arrow). Soft tissue tumor extension is shown (arrowheads). Enneking stage IIB.
-
Fat-saturated, T1-weighted, contrast-enhanced, coronal magnetic resonance image in an 8-year-old boy with osteosarcoma of the right upper humerus shows an enhancing tumor involving the shoulder joint. Enneking stage IIB.
-
Prechemotherapeutic, T1-weighted, axial magnetic resonance image in a 19-year-old man with B-cell lymphoma of the left humeral head shows a low–signal intensity tumor involving the left humeral head (H). A soft tissue mass surrounds the humeral head (arrowheads), with involvement of the glenohumeral joint (arrow). Enneking stage IIB.
-
Postchemotherapeutic, T1-weighted, axial magnetic resonance image shows that the humeral head has regained normal signal intensity (H). Resolution of the soft tissue mass is almost complete. No glenohumeral joint involvement is present at this time. Enneking stage IIA.
-
Osteosarcoma of the left upper humerus. Contrast-enhanced, dynamic, coronal, color magnetic resonance image shows degrees of enhancement of the tumor at different regions of interest (1-4). Enneking stage IIB.
-
Dynamic time intensity curves show steep uptake of contrast material in the region of the viable tumor. A nonviable tumor shows a gradual gradient of contrast agent uptake.
-
Disarticulation of the right shoulder was performed in this patient with right humeral osteosarcoma. A radionuclide bone scan obtained 5 months after surgery shows abnormal focal areas of increased tracer uptake in the right scapula, left upper humerus, and right distal femur (arrows). These uptake areas correspond to bony metastases. Abnormal areas of increased tracer uptake are seen in the lungs, corresponding to pulmonary metastases (arrowheads). Enneking stage III.
-
Pre-embolization, bilateral iliac angiogram in a 51-year-old man with sacral chordoma shows tumor hypervascularity (arrows). Image courtesy of Austin MM Htoo, FRCP, FRCR.
-
Postembolization angiogram shows a reduction in tumor vascularity. Embolization was performed with Gelfoam and coils. Image courtesy of Austin MM Htoo, FRCP, FRCR.
-
Biopsy of a vertebral body tumor. A 17-gauge bone-cutting needle is inserted through the left T11 pedicle (arrow).
Tables
Stage |
Grade |
Site |
Metastasis |
IA |
G1 |
T1 |
M0 |
IB |
G1 |
T2 |
M0 |
IIA |
G2 |
T1 |
M0 |
IIB |
G2 |
T2 |
M0 |
III |
G1 or G2 |
T1 or T2 |
M1 |
Stage |
Description |
Grade |
Site |
Metastasis |
1 |
Latent |
G0 |
T0 |
M0 |
2 |
Active |
G0 |
T0 |
M0 |
3 |
Aggressive |
G0 |
T1 or T2 |
M0 or M1 |