Practice Essentials
Primary intra-axial brain tumors account for approximately two thirds of all brain neoplasms, whereas the remaining one third is made up of metastases. As a group, gliomas are the most common brain tumors and include astrocytomas, oligodendrogliomas, ependymomas, and choroid plexus tumors. [1] Astrocytomas account for approximately 80% of all gliomas and are the most common supratentorial tumor in all age groups. [2]
Astrocytomas are often divided into circumscribed or infiltrating tumors. Pilocytic astrocytomas [3, 4] and subependymal giant-cell astrocytomas are in the circumscribed group because they tend to respect anatomic boundaries and because they do not invade. Grade II, III, and IV astrocytomas are infiltrating because of their tendency to insinuate and invade. Tumor cells are often found distant from the imaged mass.
Pleomorphic xanthoastrocytomas occupy an intermediate position; although they are well circumscribed and slow growing, malignant progression may occur. [5]
(See images of brain astrocytomas below.)
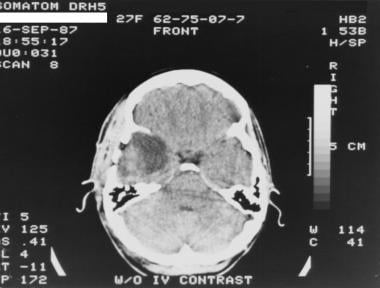 Grade II astrocytoma in a 27-year-old woman. Nonenhanced CT scan shows a heterogeneous, ill-defined, hypoattenuating area in the right temporal lobe.
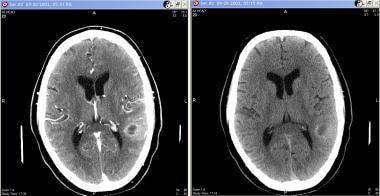
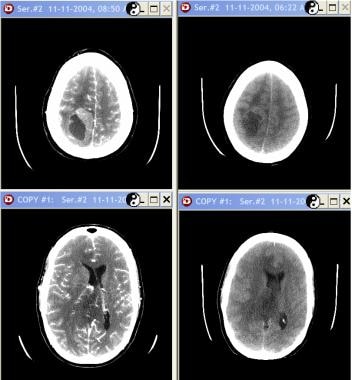 Grade III astrocytoma in a 33-year-old woman. Nonenhanced studies (right) show a mixed-attenuation lesion (solid and cystic areas) in the right parietal lobe with adjacent vasogenic edema. After contrast enhancement (left), the solid component is enhancing.
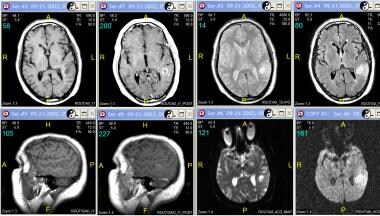
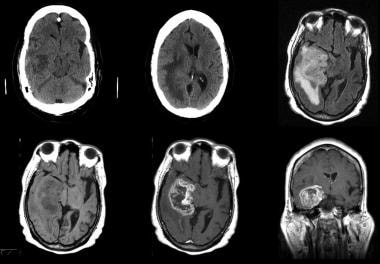 Grade IV astrocytoma in a 73-year-old man. Top row (left to right), Nonenhanced CT images and fluid-attenuated inversion recovery (FLAIR) MRI. Bottom row, Axial nonenhanced and enhanced and coronal enhanced T1-weighted MRIs. CT demonstrates an inhomogeneous area of abnormal attenuation in the right temporal lobe that extends to the parietal region, with surrounding edema and mass effect. Enhanced MRI demonstrates heterogeneous enhancement, extensive vasogenic edema, and mass effect. Note the ependymal and subependymal enhancement involving the adjacent lateral ventricle and enhancement of the adjacent dura; this finding is consistent with spread.
Classification of astrocytomas
The World Health Organization (WHO) classification system for astrocytoma is as follows [6, 7, 8] :
-
WHO grade I astrocytoma - Pilocytic astrocytoma, subependymal giant cell astrocytoma, and subependymoma.
-
WHO grade II astrocytoma – Low-grade fibrillary astrocytoma, pleomorphic xanthoastrocytoma, and mixed oligoastrocytoma
-
WHO grade III astrocytoma - Anaplastic astrocytoma
-
WHO grade IV astrocytoma - Glioblastoma multiforme
Grades to each tumor type are based on tumor growth rate: grade I-very slow growing; grade II-fast growing, grade III-faster growing, grade IV-fastest growing.
The World Health Organization Classification of Tumors of the Central Nervous System uses molecular parameters in addition to histology to define many tumor entities. The classification is as follows [9, 10] :
-
WHO grade I astrocytoma - Pilocytic astrocytoma; subependymal giant cell astrocytoma; subependymoma.
-
WHO grade II astrocytoma - Pleomorphic xanthoastrocytoma; diffuse astrocytoma, IDH-mutant; oligodendroglioma, IDH mutant and 1p/19q-codeleted
-
WHO grade III astrocytoma - Anaplastic astrocytoma, IDH-mutant; anaplastic pleomorphic xanthoastrocytoma; anaplastic oligodendroglioma, IDH mutant and 1p/19q-codeleted
-
WHO grade IV astrocytoma - Glioblastoma, IDH-wildtype; glioblastoma, IDH-mutant; diffuse midline glioma, H3 K27M-mutant
Preferred examination
Because of its soft tissue discrimination and multiplanar capabilities, contrast-enhanced MRI is the imaging modality of choice. The sensitivity of MRI studies is 82-100%, and the specificity is 81-100%. The addition of contrast material and additional sequences can substantially improve the specificity. Additional techniques include MR spectroscopy (MRS), which allows clinicians to characterize the chemical composition of the mass by determining the presence and/or alteration of components such as lactate, N -acetylaspartate (NAA), choline (Cho), and myo-inositol (Ins). [11, 12, 13, 14, 3, 15, 16]
(See the images below.)
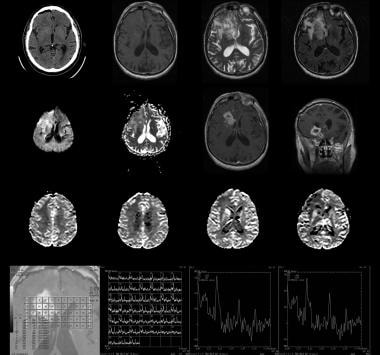
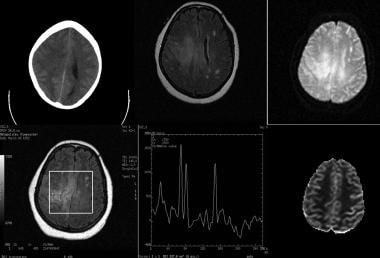 Low-grade astrocytoma in a 52-year-old woman. Top row (left to right), Nonenhanced CT scan, fluid-attenuated inversion recovery (FLAIR) MRI, and diffusion-weighted MRI. Bottom row (left to right), Single-voxel spectroscopic image showing with region of interest, spectrum, and perfusion image. Images show an ill-defined, hypoattenuating lesion in the right centrum semiovale extending to the left side through the body of the corpus callosum. The lesion has increased signal intensity on the FLAIR image. The true nature of the lesion cannot be easily established on anatomic imaging. Magnetic resonance spectroscopy (MRS) shows mild elevation of the choline (Cho) peak in relation to the N-acetylaspartate (NAA) peak with an inverted lactate peak. The findings are compatible with a low-grade neoplasm.
Two investigational sequences are often helpful in difficult cases, although the resultant images should be interpreted with caution. The first is perfusion-weighted imaging, which improves characterization of the tumor and aids in equivocal cases when other causes of signal abnormality are suggested, such as with demyelinating lesions, infarcts, and abscesses. The second is diffusion-tensor imaging, which can demonstrate the relationship of the tumor to white matter tracts.
Although MRI has distinct advantages over CT scanning, contrast-enhanced CT scanning is still used in some centers as the imaging modality for the evaluation of intra-axial mass lesions. The sensitivity of contrast-enhanced CT scanning is 65-100%, and the specificity is 72-100%. Positive aspects of CT scanning include relatively short scanning times, decreased cost, and an open environment for patients with claustrophobia. [17, 18]
Limitations of techniques
MRI and CT scanning can depict the gross morphologic characteristics of the tumor, its relationship with adjacent tissue, and certain aspects of the chemical composition of the tumor (with MRS). Perfusion-weighted and diffusion-tensor images must be interpreted with caution.
Tumor margins can often be difficult to determine with accuracy. Studies have demonstrated that the extent of tumor involvement with higher grade lesions is underestimated when current conventional imaging is used. Although MRS has been useful, it also causes underestimation of the tumor burden. Tumor cells have been demonstrated well beyond the margin of any imaging abnormality.
Although imaging is instrumental in diagnosing the tumor and in evaluating the extent of disease or recurrence, only biopsy helps in determining the grade of tumor.
Computed Tomography
The appearance of astrocytomas on CT scans partly depends on their grade. Low-grade astrocytomas typically appear as homogeneous areas of decreased attenuation. They are relatively well circumscribed, and 20% have associated calcification. Although low-grade tumors usually do not enhance, rare tumors demonstrate minimal enhancement. [3]
Specific low-grade tumors have imaging characteristics that can increase the specificity of CT scanning. Pilocytic astrocytomas often appear as a cystic lesion with an eccentric mural nodule that strongly enhances after the administration of contrast agent. Subependymal giant-cell astrocytomas are typically near the foramen of Monro and usually occur in patients with tuberous sclerosis. Pleomorphic xanthoastrocytomas are typically supratentorial, cortically based masses with strong heterogeneous enhancement. The adjacent dura and meninges often enhance, creating the dural-tail appearance.
Grade III astrocytomas appear more heterogeneous. Edema is often appreciated, calcification is rare, and the enhancement pattern is usually more pronounced.
Grade IV astrocytomas are even more heterogeneous than tumors of other grades on CT scans, and they almost always enhance strongly. Hemorrhage and necrosis are common, but calcification is not. Extensive edema and mass effect are usually appreciated. This grade often involves both hemispheres by spreading by means of the corpus callosum or commissures.
With CT scanning, the scarcity of edema and mass effect with low-grade lesions may make the true extent of pathology difficult to ascertain. Furthermore, small lesions may not be visible if contrast material is not used. [3]
(See images of brain astrocytomas below.)
Grade II astrocytoma in a 27-year-old woman. Nonenhanced CT scan shows a heterogeneous, ill-defined, hypoattenuating area in the right temporal lobe.
 Grade III astrocytoma in a 71-year-old man. Contrast-enhanced (left) and nonenhanced (right) images show a cystic lesion with thick walls in the left parietal lobe, with thick rim enhancement on the enhanced image. Moderate surrounding vasogenic edema causes mass effect on the atrium of the left lateral ventricle.
Grade IV astrocytoma in a 73-year-old man. Top row (left to right), Nonenhanced CT images and fluid-attenuated inversion recovery (FLAIR) MRI. Bottom row, Axial nonenhanced and enhanced and coronal enhanced T1-weighted MRIs. CT demonstrates an inhomogeneous area of abnormal attenuation in the right temporal lobe that extends to the parietal region, with surrounding edema and mass effect. Enhanced MRI demonstrates heterogeneous enhancement, extensive vasogenic edema, and mass effect. Note the ependymal and subependymal enhancement involving the adjacent lateral ventricle and enhancement of the adjacent dura; this finding is consistent with spread.
Grade III astrocytoma in a 71-year-old man. Contrast-enhanced (left) and nonenhanced (right) images show a cystic lesion with thick walls in the left parietal lobe, with thick rim enhancement on the enhanced image. Moderate surrounding vasogenic edema causes mass effect on the atrium of the left lateral ventricle.
Grade IV astrocytoma in a 73-year-old man. Top row (left to right), Nonenhanced CT images and fluid-attenuated inversion recovery (FLAIR) MRI. Bottom row, Axial nonenhanced and enhanced and coronal enhanced T1-weighted MRIs. CT demonstrates an inhomogeneous area of abnormal attenuation in the right temporal lobe that extends to the parietal region, with surrounding edema and mass effect. Enhanced MRI demonstrates heterogeneous enhancement, extensive vasogenic edema, and mass effect. Note the ependymal and subependymal enhancement involving the adjacent lateral ventricle and enhancement of the adjacent dura; this finding is consistent with spread.
 Recurrent grade IV astrocytoma in the region of the right caudate and putamen in a 76-year-old man. Top row (left to right), Nonenhanced CT scan, nonenhanced T1-weighted MRI, T2-weighted MRI, and fluid-attenuated inversion recovery (FLAIR) MRI. Second row from top (left to right): Diffusion-weighted MRI, apparent diffusion coefficient (ADC) map, and axial and coronal contrast-enhanced T1-weighted MRIs. Third row from top: Perfusion-weighted MRIs show increased flow in the caudate and putamen but not in the other areas of abnormal signal intensity. Bottom row: Axial spectroscopic image shows the 2 regions of interest in the right caudate corresponding to the multivoxel spectra. Note the large, infiltrating mass centered in the right basal ganglia and extending to the right frontal lobe, temporal lobe, and insula. Image shows thick peripheral enhancement and central necrosis. Multivoxel spectroscopy demonstrates decreased N-acetylaspartate (NAA), elevated choline, and elevated lactate values in thecaudate.
Magnetic Resonance Imaging
MRI has increased the sensitivity and specificity in imaging astrocytomas. With the advent of MRS, perfusion-weighted imaging, and diffusion-tensor imaging, specificity has further improved. [19, 11, 20, 13, 14, 21, 22, 23, 6]
A variety of neoplastic and nonneoplastic conditions involve the corpus callosum, which may result in a "butterfly" appearance on conventional MRI. [24]
Texture analysis performed on MR images can detect quantitative features that are imperceptible to human visual assessment. Studies have shown that texture analysis performed on conventional preoperative MRI images can accurately predict histologic subtype of low-grade gliomas. [15, 16]
Anaplastic pleomorphic xanthoastrocytomas often have more aggressive MRI features mimicking high-grade astrocytomas than pleomorphic xanthoastrocytomas. [5]
Magnetic resonance spectroscopy
MRS allows cerebral metabolites to be assessed by suppressing the signal of water and by interrogating for entities, including NAA (located at 2.0 ppm and is a neuronal marker), Cho (located at 3.2 ppm and is a marker for cell membrane turn over), creatine (located at 3.0 ppm and is a cell energy metabolism marker), and lactate (located at 1.33 ppm and is a marker for necrosis). The 2 main MRS techniques are single-voxel spectroscopy (shown in the image below) and chemical-shift imaging. [25, 26] Single-voxel spectroscopy is used to detect the signal from a single region during one measurement. Chemical-shift imaging uses additional phase-encoding pulses to obtain signals.
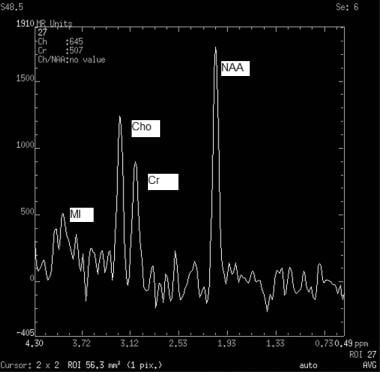 Normal pattern on single-voxel magnetic resonance spectroscopy (MRS) of 4 key molecules show relative heights and typical values. N-acetylaspartate (NAA) peaks at 2.0 ppm (tallest peak). Creatine (Cr) peaks at 3.0 ppm. Choline (Cho) peaks at 3.2 ppm. Myo-inositol (MI) peaks at 3.6 ppm.
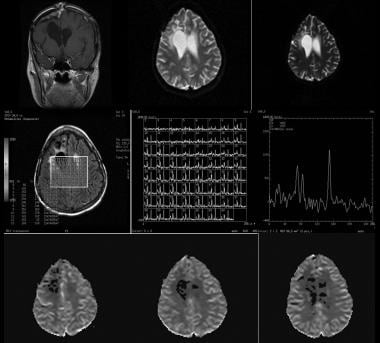 Image show no evidence of recurrence in a 37-year-old woman with a history of grade 3 astrocytoma who underwent resection 7 years ago. Coronal contrast-enhanced T1-weighted, diffusion-weighted, and apparent diffusion coefficient (ADC) imaging were initially performed, followed by multivoxel magnetic resonance spectroscopy (MRS) and perfusion imaging. Because findings on cross-sectional imaging were not conclusive, additional studies were performed. MRS shows low levels of N-acetylaspartate (NAA), creatine (Cr), and choline (Cho) in an area of encephalomalacia, with a normal spectrum in the rest of the brain. Perfusion imaging shows no increased activity in the area of concern. These findings are compatible with gliosis.
With cerebral gliomas, MRS is used to assess the spectral pattern, metabolite intensities, and ratios to help grade the tumor and/or predict treatment response. MRS can also help in evaluating for tumoral recurrence and treatment response. The intensity of NAA is correlated with neuronal density and viability. Cho is involved in the turnover of cell membranes and neurotransmitters. Cr serves as a reserve for high-energy phosphates in the cytosol of neurons. Cerebral lactate is always abnormal and indicates ineffective cellular oxidative metabolism. Free lipids are present in areas of necrosis. Compared with normal tissues, cerebral gliomas consistently show lowered NAA intensity, elevated Cho (indicating increased membrane metabolism), and a stable or reduced Cr concentration. An Ins peak is described in certain low-grade tumors.
Perfusion-weighted imaging
Perfusion-weighted imaging involves several image acquisitions during the first pass of a bolus of contrast agent. This method allows the imager to determine the relative cerebral blood volume (rCBV). In general, the greater the rCBV, the higher the grade of tumor. Lack of notable flow indicates a nonneoplastic etiology with abnormal signal intensity, such as demyelination. Of note, mixed oligodendrogliomas can have low rCBV. Besides the prognostic information it provides, perfusion-weighted imaging can increase the yield of brain biopsy and help in differentiating recurrent neoplasm from radiation necrosis.
Diffusion-tensor imaging
Diffusion-tensor imaging allows the evaluation of the structure and orientation of the white matter tracts. This sequence takes advantage of the fact that myelin restricts diffusion of water molecules in directions perpendicular to the fiber orientation. This sequence can help in determining whether neoplasm involves white matter pathways, improving the precision of surgical planning and the placement of radiation ports.
Functional MRI
Although not used in the diagnosis of astrocytomas, functional MRI (fMRI) deserves mention because it can be an important part of presurgical planning. A blood oxygen–dependent sequence is applied as the patient performs various tasks involving motor, sensory, visual, auditory, and language functions. Increased blood flow to a part of the brain is correlated with increased metabolic activity. The results are used to determine whether tumor involves vital structures (eloquent areas), a finding that may possibly affect surgical decisions.
Astrocyte characteristics on MRI
Low-grade astrocytomas are typically hyperintense on T2-weighted images. On T1-weighted images, most low-grade astrocytomas are hypointense relative to white matter. Contrast enhancement may be absent or, at best, mild. Exceptions include the mural nodule of pilocytic astrocytoma and the strong heterogeneous enhancement of pleomorphic xanthoastrocytomas. [5] Astrocytomas are often associated with enhancement of the adjacent dura and meninges, giving the dural-tail appearance. MRS typically shows an elevated Cho peak and decreased NAA peak. An elevated Cho-Cr ratio or a depressed NAA-Cr ratio suggests tumor. This holds true for all high-grade tumors and many, but not all, low-grade tumors. (Some low-grade tumors may not have an elevated Cho peak.) Perfusion MRI studies fail to demonstrate increased rCBV.
Grade III astrocytomas often invade structures without destroying them, causing their ill-defined borders. The mass is inhomogeneous and bright on T2-weighted images. Surrounding edema and/or tumor infiltration is usually appreciated. Enhancement is usually seen. Perfusion MRI demonstrates increased relative cerebral flow volume.
Grade IV astrocytomas (GBM) are usually discovered as bulky disease, and necrosis is a hallmark of this grade. These lesions usually enhance peripherally, in a nodular and irregular manner, and they cause a large amount of mass effect and edema. These tumors often cross the corpus callosum, giving them a typical butterfly shape. [24] Areas of hemorrhage and necrosis are common, and spectroscopy demonstrates high Cho, high lactate, high lipid, and low NAA values. Short–echo time (TE) studies demonstrate an absent or low myo-inositol peak. Perfusion studies demonstrate elevated rCBV.
(See MRI images of brain astrocytomas below.)
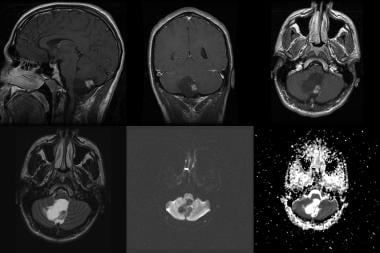 Pilocytic astrocytoma in a 20-year-old man. Top row (left to right), sagittal, coronal, and axial contrast-enhanced T1-weighted MRIs. Bottom row: Axial fluid-attenuated inversion recovery (FLAIR), diffusion, and apparent diffusion coefficient (ADC) images. Note the cystic mass with an intensely enhancing mural nodule in the inferior cerebellar vermis, as well as the mass effect on the brainstem, upper cervical cord, cerebellum, and fourth ventricle.
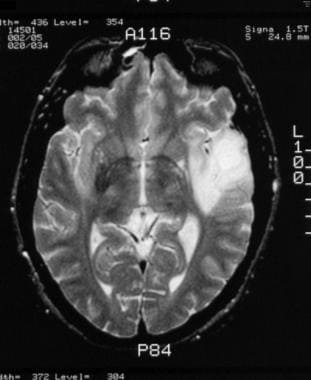 Grade II astrocytoma in a 30-year-old man. Nonenhanced T2-weighted MRI shows a well-circumscribed area of increased signal intensity in the left temporal lobe.
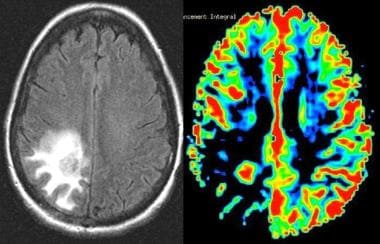 Grade II astrocytoma. Left, Fluid-attenuated inversion recovery (FLAIR) image demonstrates an area of increased signal intensity in the parietooccipital region. Right, Perfusion MRI demonstrates decreased relative cerebral blood volume (rCBV), consistent with a low-grade neoplasm. The final pathologic diagnosis was a grade II astrocytoma.
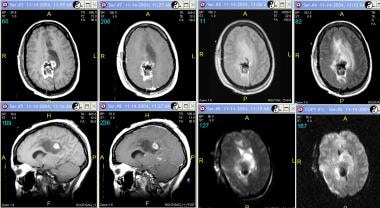 Grade III astrocytoma in a 33-year-old woman. Top row (left to right), Axial nonenhanced and contrast-enhanced T1-weighted, proton density–weighted, and fluid-attenuated inversion recovery (FLAIR) MRIs. Bottom row (left to right), Sagittal nonenhanced and contrast-enhanced T1-weighted MRIs, axial diffusion-weighted images, and axial apparent diffusion coefficient (ADC) map. T1-weighted images demonstrate a well-defined area of mixed signal intensity in the right parietal lobe extending to the corpus callosum with adjacent vasogenic edema. Mixed areas represent hemorrhage. Contrast-enhanced images show minimal enhancement of the lesion. Also appreciated is dural enhancement secondary to previous intervention.
 Grade III astrocytoma in a 71-year-old man. Top row (left to right), Axial nonenhanced and contrast-enhanced T1-weighted, proton density–weighted, and fluid-attenuated inversion recovery (FLAIR) MRIs. Bottom row (left to right), Sagittal nonenhanced and contrast-enhanced T1-weighted MRIs, axial diffusion-weighted images, and axial apparent diffusion coefficient (ADC) map. Images show a cystic, well-defined lesion in the left parietal region with surrounding vasogenic edema and a thick rim enhancement on enhanced images. Diffusion and ADC images shows no evidence of acute restriction.
Nuclear Imaging
Primary brain tumors generally have increased glucose metabolism on fluorodeoxyglucose (FDG) PET scan studies (see the image below). [27, 28] The degree of metabolic activity is correlated with the grade of the tumor and the patient's prognosis. Low-grade tumors may demonstrate little to no increased uptake, whereas grade IV lesions often have uptake that overshadows that of the gray matter.
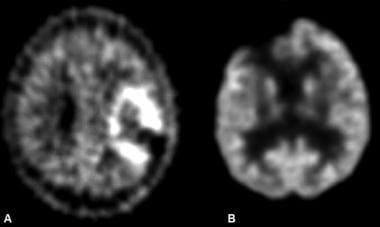 A, Image in a patient after resection of a left frontoparietal, high-grade astrocytoma. Positron emission tomography (PET) demonstrates increased activity in this region, consistent with recurrence. B, Image in another patient being evaluated for recurrence of a high-grade astrocytoma. Image shows no abnormally increased activity to suggest recurrence.
The heterogeneous nature of grade III or IV lesions is a specific feature for which PET scanning is helpful. Obtaining samples from active areas is of vital importance for accurate grading. PET scanning can be used to guide stereotactic biopsy to obtain a representative sample.
PET scanning has also been used to assess the response to therapy, and it can be used to detect transformation of a low-grade lesion to a high-grade one. [1]
-
Grade II astrocytoma in a 27-year-old woman. Nonenhanced CT scan shows a heterogeneous, ill-defined, hypoattenuating area in the right temporal lobe.
-
Normal pattern on single-voxel magnetic resonance spectroscopy (MRS) of 4 key molecules show relative heights and typical values. N-acetylaspartate (NAA) peaks at 2.0 ppm (tallest peak). Creatine (Cr) peaks at 3.0 ppm. Choline (Cho) peaks at 3.2 ppm. Myo-inositol (MI) peaks at 3.6 ppm.
-
Pilocytic astrocytoma in a 20-year-old man. Top row (left to right), sagittal, coronal, and axial contrast-enhanced T1-weighted MRIs. Bottom row: Axial fluid-attenuated inversion recovery (FLAIR), diffusion, and apparent diffusion coefficient (ADC) images. Note the cystic mass with an intensely enhancing mural nodule in the inferior cerebellar vermis, as well as the mass effect on the brainstem, upper cervical cord, cerebellum, and fourth ventricle.
-
Grade II astrocytoma in a 30-year-old man. Nonenhanced T2-weighted MRI shows a well-circumscribed area of increased signal intensity in the left temporal lobe.
-
Low-grade astrocytoma in a 52-year-old woman. Top row (left to right), Nonenhanced CT scan, fluid-attenuated inversion recovery (FLAIR) MRI, and diffusion-weighted MRI. Bottom row (left to right), Single-voxel spectroscopic image showing with region of interest, spectrum, and perfusion image. Images show an ill-defined, hypoattenuating lesion in the right centrum semiovale extending to the left side through the body of the corpus callosum. The lesion has increased signal intensity on the FLAIR image. The true nature of the lesion cannot be easily established on anatomic imaging. Magnetic resonance spectroscopy (MRS) shows mild elevation of the choline (Cho) peak in relation to the N-acetylaspartate (NAA) peak with an inverted lactate peak. The findings are compatible with a low-grade neoplasm.
-
Grade II astrocytoma. Left, Fluid-attenuated inversion recovery (FLAIR) image demonstrates an area of increased signal intensity in the parietooccipital region. Right, Perfusion MRI demonstrates decreased relative cerebral blood volume (rCBV), consistent with a low-grade neoplasm. The final pathologic diagnosis was a grade II astrocytoma.
-
Grade III astrocytoma in a 33-year-old woman. Nonenhanced studies (right) show a mixed-attenuation lesion (solid and cystic areas) in the right parietal lobe with adjacent vasogenic edema. After contrast enhancement (left), the solid component is enhancing.
-
Grade III astrocytoma in a 33-year-old woman. Top row (left to right), Axial nonenhanced and contrast-enhanced T1-weighted, proton density–weighted, and fluid-attenuated inversion recovery (FLAIR) MRIs. Bottom row (left to right), Sagittal nonenhanced and contrast-enhanced T1-weighted MRIs, axial diffusion-weighted images, and axial apparent diffusion coefficient (ADC) map. T1-weighted images demonstrate a well-defined area of mixed signal intensity in the right parietal lobe extending to the corpus callosum with adjacent vasogenic edema. Mixed areas represent hemorrhage. Contrast-enhanced images show minimal enhancement of the lesion. Also appreciated is dural enhancement secondary to previous intervention.
-
Grade III astrocytoma in a 71-year-old man. Contrast-enhanced (left) and nonenhanced (right) images show a cystic lesion with thick walls in the left parietal lobe, with thick rim enhancement on the enhanced image. Moderate surrounding vasogenic edema causes mass effect on the atrium of the left lateral ventricle.
-
Grade III astrocytoma in a 71-year-old man. Top row (left to right), Axial nonenhanced and contrast-enhanced T1-weighted, proton density–weighted, and fluid-attenuated inversion recovery (FLAIR) MRIs. Bottom row (left to right), Sagittal nonenhanced and contrast-enhanced T1-weighted MRIs, axial diffusion-weighted images, and axial apparent diffusion coefficient (ADC) map. Images show a cystic, well-defined lesion in the left parietal region with surrounding vasogenic edema and a thick rim enhancement on enhanced images. Diffusion and ADC images shows no evidence of acute restriction.
-
Image show no evidence of recurrence in a 37-year-old woman with a history of grade 3 astrocytoma who underwent resection 7 years ago. Coronal contrast-enhanced T1-weighted, diffusion-weighted, and apparent diffusion coefficient (ADC) imaging were initially performed, followed by multivoxel magnetic resonance spectroscopy (MRS) and perfusion imaging. Because findings on cross-sectional imaging were not conclusive, additional studies were performed. MRS shows low levels of N-acetylaspartate (NAA), creatine (Cr), and choline (Cho) in an area of encephalomalacia, with a normal spectrum in the rest of the brain. Perfusion imaging shows no increased activity in the area of concern. These findings are compatible with gliosis.
-
Grade IV astrocytoma in a 73-year-old man. Top row (left to right), Nonenhanced CT images and fluid-attenuated inversion recovery (FLAIR) MRI. Bottom row, Axial nonenhanced and enhanced and coronal enhanced T1-weighted MRIs. CT demonstrates an inhomogeneous area of abnormal attenuation in the right temporal lobe that extends to the parietal region, with surrounding edema and mass effect. Enhanced MRI demonstrates heterogeneous enhancement, extensive vasogenic edema, and mass effect. Note the ependymal and subependymal enhancement involving the adjacent lateral ventricle and enhancement of the adjacent dura; this finding is consistent with spread.
-
Recurrent grade IV astrocytoma in the region of the right caudate and putamen in a 76-year-old man. Top row (left to right), Nonenhanced CT scan, nonenhanced T1-weighted MRI, T2-weighted MRI, and fluid-attenuated inversion recovery (FLAIR) MRI. Second row from top (left to right): Diffusion-weighted MRI, apparent diffusion coefficient (ADC) map, and axial and coronal contrast-enhanced T1-weighted MRIs. Third row from top: Perfusion-weighted MRIs show increased flow in the caudate and putamen but not in the other areas of abnormal signal intensity. Bottom row: Axial spectroscopic image shows the 2 regions of interest in the right caudate corresponding to the multivoxel spectra. Note the large, infiltrating mass centered in the right basal ganglia and extending to the right frontal lobe, temporal lobe, and insula. Image shows thick peripheral enhancement and central necrosis. Multivoxel spectroscopy demonstrates decreased N-acetylaspartate (NAA), elevated choline, and elevated lactate values in thecaudate.
-
A, Image in a patient after resection of a left frontoparietal, high-grade astrocytoma. Positron emission tomography (PET) demonstrates increased activity in this region, consistent with recurrence. B, Image in another patient being evaluated for recurrence of a high-grade astrocytoma. Image shows no abnormally increased activity to suggest recurrence.