Practice Essentials
Portal hypertension (PH) represents an increase of the hydrostatic pressure within the portal vein or its tributaries. It is defined as an increase in the pressure gradient between the portal vein and hepatic veins or the inferior vena cava (IVC). Most patients with PH have intrinsic liver disease. The most common cause of portal hypertension is cirrhosis, with portal hypertension developing as a result of a progressive increase in resistance to portal vein blood flow. [1, 2, 3, 4, 5]
In PH, blood that normally flows through the liver is diverted into systemic veins because of increased resistance to portal venous flow. This diversion of portal venous blood occurs via exiting portosystemic communications (eg, the left gastric vein) and the opening of embryonic channels (eg, paraumbilical veins). The most common portosystemic anastomosis is via the left gastric-gastroesophageal route; it occurs in 80-90% of patients and gives rise to lower esophageal and gastric varices. [3, 4]
Portal hypertension has 2 components: the intrahepatic obstruction of portal blood flow and the transmitted venous pressure from the hepatic vein. Hepatic venous pressure gradient (HVPG) is considered the standard for quantifying portal hypertension. Normal portal venous pressure ranges from 5 mm Hg or less. Mild PH is 6 to < 10 mm Hg. Clinically significant portal hypertension (CSPH) is considered to be an HVPG ≥10 mm Hg, and severe portal hypertension is ≥12 mm Hg. [4, 6, 7, 8, 9, 10]
An HVPG ≥16 mm Hg is associated with higher mortality in patients with compensated and decompensated cirrhosis. A reduction of HVPG by >20% of baseline values or ≤12 mm Hg is correlated with considerable reduction in the risk of variceal bleeding during treatment with nonselective beta blockers. [2]
Patients with mild portal hypertension are unlikely to decompensate, but patients with clinically significant portal hypertension are more likely to decompensate (ie, develop ascites; bleed from varices; or develop encephalopathy). [1, 11, 12, 13, 14]
Hematemesis resulting from bleeding esophageal varices is the most common presentation in patients with portal hypertension, although some patients seek medical help because of decompensated liver disease. Findings from duplex ultrasonography (US) and color Doppler imaging (CDI), MRI, CT, and endoscopy may support the diagnosis of PH.
Treatment of the sequelae of portal hypertension can be achieved through endovascular management by referral to an interventional radiologist on an outpatient or emergent basis as required. Current techniques for treatment of the sequelae of PH include placement of peritoneovenous shunts and tunneled peritoneal drains, creation of transjugular intrahepatic portosystemic shunts, and obliteration of shunts via balloon-occluded retrograde transvenous obliteration (BRTO). [15]
Imaging modalities
In portal hypertension imaging, ultrasound techniques such as duplex ultrasonography or spectral Doppler imaging and color Doppler imaging or power Doppler imaging are the modalities of choice, because they are noninvasive, rapid, and highly sensitive and specific. In patients with known cirrhosis, Doppler ultrasound has a specificity greater than 80% for CSPH. Spectral and color Doppler can detect specific portosystemic collateral pathways such as recanalized paraumbilical vein, splenorenal collaterals, and dilated left and short gastric veins. [16, 17, 7] Microbubble contrast agents have improved detectability of peripheral blood flow [8, 9] When respiratory variation in the size of the portal, splenic, and superior mesenteric veins does not occur or when it is less than 20%, PH may be diagnosed with a sensitivity of 80% and a specificity of 100%.
Studies have also demonstrated four-dimensional flow MRI (4-D flow MRI) as promising in evaluating the splanchnic system with high spatial resolution. [7]
Plain radiographs are usually not indicated for patients with portal hypertension. Most plain radiographs are obtained for other reasons, and signs of PH are detected incidentally. Plain radiographs are not often obtained in cases of portal hypertension, but because most hospitalized patients undergo chest radiography, radiologists need to be aware of abnormalities that may be found in patients with PH. The appearance of calcification in the distribution of the portal vein on a plain abdominal radiograph may indicate PH. An upper GI tract barium series is often performed for the detection of esophageal varices.
(See the images below.)
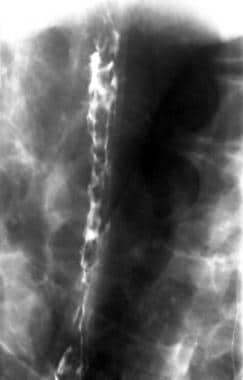 Barium swallow in the left lateral decubitus position shows multiple mucosal nodules in the mid to lower esophagus. In a patient with cirrhosis, these are suggestive of esophageal varices.
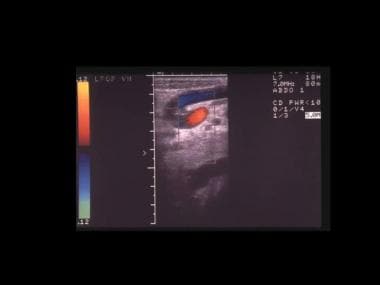
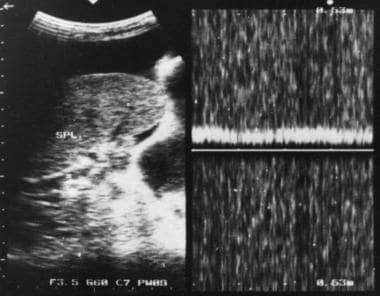 Doppler sonogram at the splenic hilum reveals hepatofugal venous flow in a patient with portal hypertension.
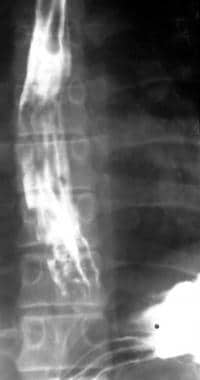 Barium swallow in a 56-year-old man with known cirrhosis who had a recent episode of hematemesis shows thickened mucosal folds and multiple polypoid filling defects at the lower end of the esophagus. These are suggestive of varices.
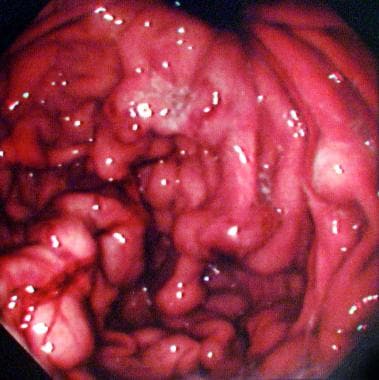 Endoscopic findings in a 47-year-old man with a history of polycythemia rubra vera who had a recent episode of hematemesis. Endoscopy showed a normal esophagus, but multiple polypoid submucosal lesions were seen in the fundus and body of the stomach). The final diagnosis was left-sided portal hypertension secondary to splenic vein thrombosis.
 Part of an upper gastrointestinal tract barium series (same patient as in the previous image) shows multiple polypoid filling defects within the fundus of the stomach. The final diagnosis was a left-sided portal hypertension secondary to splenic vein thrombosis.
Angiographic techniques such as splenosportography (SP), transhepatic portography, transumbilical catheterization, transjugular catheterization, wedge hepatic venography, and arterial portography are invasive. However, they are much more specific for the evaluation of PH hypertension; they are indicated when definitive surgery or radiologic intervention is contemplated.
The use of angiographic techniques is declining because noninvasive imaging techniques such as US, CT, computed tomographic angiography (CTA), and magnetic resonance angiography (MRA) are available and improving in specificity and sensitivity. [3, 4, 7, 8, 9, 16, 18, 19, 20]
Splenoportography and transumbilical catheterization are rarely performed. Arterial portography (indirect portography) and wedge hepatic venography with manometry is indicated before surgical portacaval shunt placement.
Carbon dioxide wedge hepatic venography is the most commonly used method for visualizing the portal vein before portal vein puncture for a transjugular intrahepatic portosystemic shunt (TIPS) procedure. TIPS is a radiology-guided creation of a shunt between the portal and hepatic veins in the liver by use of a percutaneous transjugular approach. Because of its proven safety and effectiveness, TIPS has largely replaced surgical decompressive shunt procedures. [21, 22, 23] In cases involving bleeding varices that are unresponsive to endoscopic sclerotherapy or when intractable ascites are present, a TIPS procedure is indicated. TIPS is performed after portal vein patency is documented at duplex US.
Transient elastography (TE) is a relatively new sonographic technique used as a noninvasive method to study portal hypertension in chronic liver disease, with variable results. TE has shown sensitivity in estimating the absence of liver fibrosis or the presence of high-degree liver fibrosis. Shear-wave elastography (SWE) has also been studied. [6, 8, 24, 25]
Shi et al, in a meta-analysis, studied the performance of TE for detection of significant portal hypertension, esophageal varices, and large esophageal varices. The analysis revealed that TE could be used as a good screening tool for significant portal hypertension but had only moderate diagnostic utility for the prediction of esophageal varices or large esophageal varices. [26]
Idiopathic portal hypertension (IPH) is frequently misdiagnosed as cryptogenic cirrhosis. Seijo et al studied 39 patients retrospectively to determine whether hepatic vein catheterization and liver stiffness measurements can differentiate IPH from noncirrhotic portal vein thrombosis. Patients with IPH frequently have hepatic vein-to-vein communications, despite signs of portal hypertension, and much lower mean hepatic venous pressure gradient and liver stiffness values than the cut-off for clinically significant portal hypertension in patients with cirrhosis. Thus, when these signs occur, it is obligatory that IPH is ruled out. [24]
Radiography
Plain radiographic findings
Calcification may be seen in the portal vein after prolonged portal hypertension and may occur within a thrombosed portal vein. The calcification is linear or strandlike, and it typically lies transversely across the upper abdomen, or it slopes upward and obliquely toward the liver hilum.
Generalized increase in the liver opacity may be seen in patients with hemochromatosis. Although this may be demonstrated by measuring the liver attenuation on CT scans, it rarely is demonstrable on plain abdominal radiographs.
Esophageal varices appear as lobulated posterior mediastinal masses in 5-8% of patients. Silhouetting of the descending aorta and an abnormal convex contour of the azygos-esophageal recess are further signs of portal hypertension (PH) that may be shown on plain radiographs. Signs of underlying liver disease may be noted, such as splenomegaly and ascites.
(Portal hypertension is displayed in the radiographic images below.)
Barium swallow in the left lateral decubitus position shows multiple mucosal nodules in the mid to lower esophagus. In a patient with cirrhosis, these are suggestive of esophageal varices.
Barium swallow in a 56-year-old man with known cirrhosis who had a recent episode of hematemesis shows thickened mucosal folds and multiple polypoid filling defects at the lower end of the esophagus. These are suggestive of varices.
Barium study findings of esophageal varices
Esophageal varices comprising dilated submucosal veins in the lower esophagus occur chiefly as a consequence of PH, mostly in patients with cirrhosis. Varices appear as beaded or serpiginous translucent filling defects.
Barium study may depict 90% of esophageal varices; however, demonstration of esophageal varices on barium examination is highly dependent on technique. Important factors include the intravenous administration of anticholinergic agents, use of barium paste, and examination of the esophagus in a relaxed state.
Esophageal peristalsis milks the blood out of the varices, whereas esophageal hypotonia allows the varices to distend with blood, making them easy to visualize.
A left anterior oblique projection with the patient recumbent or in the Trendelenburg position shows the varices to best advantage. Images are obtained by use of the Valsalva maneuver and/or deep inspiration. The Valsalva maneuver precludes swallowing and maintains the esophagus in a relaxed state. Exposure is made with the esophagus slightly underdistended. Overfilling produces distention, which may obliterate the varices.
After an acute episode of bleeding from esophageal varices, varices may collapse and become difficult to detect radiologically. Demonstration of varices in a patient with hematemesis does not necessarily establish the source as the varices because in one third of patients, bleeding occurs from other causes, such as peptic ulcer.
Anticholinergic drugs are contraindicated in patients with a history of glaucoma, heart disease, or urinary retention. Glucagon is not useful for demonstrating esophageal varices because it lowers esophageal sphincter pressure and does not abolish peristalsis in the body of the esophagus.
Large esophageal varices are obvious and appear as nodular or vermiform changeable filling defects within the esophagus. Smaller varices appear as scalloped esophageal folds that are better seen on recumbent films because they tend to disappear on upright films.
Gastric varices are seen in 2-78% of patients with PH. Gastric varices that occur in the absence of esophageal varices usually result from splenic vein thrombosis; bridging collaterals extend from the splenic hilum across the stomach to the left gastric vein and then on to the portal vein.
A higher incidence of portosystemic encephalopathy is noted in patients with gastric varices. Varices in the stomach usually are confined to the gastric cardia and are difficult to recognize. The rate of detection on a barium study has been reported to be 65-89%.
Gastric varices usually present as a slight thickening or scalloping of the cardiac folds, but large gastric varices presenting as large mucosal polypoid masses involving the fundus and cardia are sometimes encountered. Angiography is occasionally necessary to exclude gastric tumor. Gastric varices bleed less frequently than esophageal varices, but when they do bleed, the hemorrhage is more severe.
Barium study findings of varices in other parts of the gastrointestinal tract
Gastric antral and duodenal varices are sometimes seen, usually in association with gastric fundal and esophageal varices. Duodenal varices appear as lobulated filling defects on barium study and are demonstrated best with the patient in a prone position. Internal hemorrhoids frequently are found in patients with severe PH.
In rare cases, varices involve the colon via portosystemic collaterals through the retroperitoneal veins or through newly formed collaterals in adhesions or scars from previous surgery. In addition, the demonstration of varices on barium examination may include other features of PH, such as splenomegaly or ascites.
The enlarged spleen may compress the stomach and displace the splenic flexure of the colon downward. Ascites causes a central location of the small bowel loops and separation of the colon from flank fat stripes.
Degree of confidence
Plain radiography is not sensitive in the diagnosis of portal hypertension. With good operator technique, barium examination may depict more than 90% of varices. The rate of detection with barium study has been reported to be 65-89%.
Other causes of calcification overlying the liver may mimic portal vein calcification. One example is hepatic arterial calcification. Esophageal varices may occur with superior vena caval obstruction and may be seen as lobulated posterior mediastinal masses.
An enlargement of mucosal folds may be seen with esophagitis on barium swallow, but the enlarged folds are not position dependent and are seen equally well on upright films.
A rare neoplastic process that occasionally may be confused with varices is varicoid esophageal carcinoma. Primarily seen as a nodular fold thickening, it may be differentiated from varices by its lack of position dependence, the fact that the involvement does not extend to the lower esophagus, and the rigidity of the involved segment.
Downhill varices may occur as a result of collateral circulation extending from the superior vena cava through the esophageal plexus to the portal venous system. These varices are seen in patients with superior vena caval obstruction usually distal to the entry of the azygos vein. They most commonly result from bronchogenic carcinoma, mediastinal fibrosis, lymphoma, thymoma, or thyroid disease. Downhill varices may be seen only in the proximal part of the esophagus, or they may involve the entire esophagus.
Differentiation of gastric varices from gastric carcinoma may be difficult at times and may require angiography.
Computed Tomography
Computed tomography has been used to assess portal hypertension (see the images below). [18, 19, 20, 27, 28] Splenomegaly and ascites are readily demonstrated. In some patients, the liver is of nonuniform attenuation. Low-attenuating components probably represent residual foci of infiltration. Often, the attenuation of a cirrhotic liver is homogeneous and within the reference range.
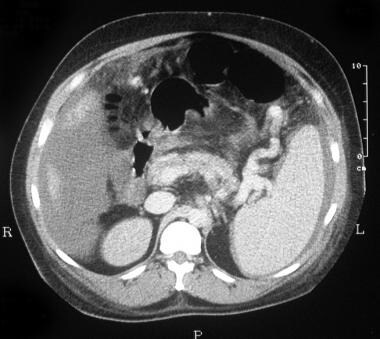 CT scan through the spleen of a 43-year-old man with a known history of intravenous drug abuse and hepatitis C cirrhosis. The patient presented to the emergency department with a sudden onset of a hypotensive episode and clinical features of hepatic encephalopathy. The scan shows splenomegaly with a dilated tortuous splenic vein/varices at the splenic hilum and free peritoneal fluid. The final diagnosis was hepatitis C cirrhosis, hepatocellular carcinoma of the left hepatic lobe (which had ruptured into the peritoneum), and arterioportal shunting (which had developed inside the ruptured tumor, giving rise to severe portal hypertension).
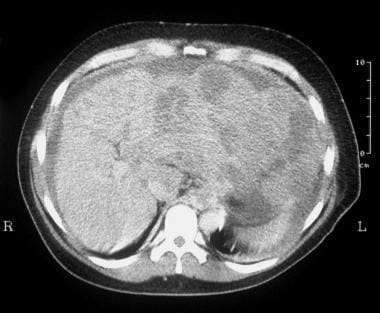 CT scan through the liver (same patient as in the previous image) was not of optimal quality because of patient movement, but the attenuation in the left lobe of the liver was patchy, suggestive of a mass lesion. The final diagnosis was hepatitis C cirrhosis, hepatocellular carcinoma of the left hepatic lobe (which had ruptured into the peritoneum), and portoarterial fistula (which had developed inside the ruptured tumor, giving rise to severe portal hypertension).
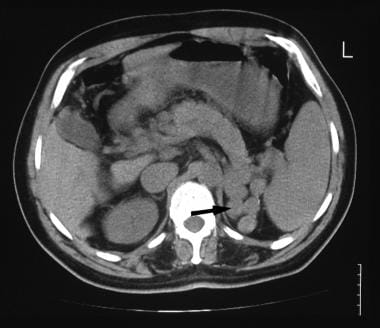 A 52-year-old man with known hepatitis B cirrhosis was found to have a hypoechoic mass in the region of the liver hilum. CT was performed for further characterization. Nonenhanced CT scan shows multiple polypoid masses at the splenic hilum (arrow), suggestive of a dilated tortuous splenic vein or varices. The final diagnosis was hepatocellular carcinoma, cirrhosis, and portal vein thrombosis/portal hypertension complicated by a spontaneous splenorenal shunt.
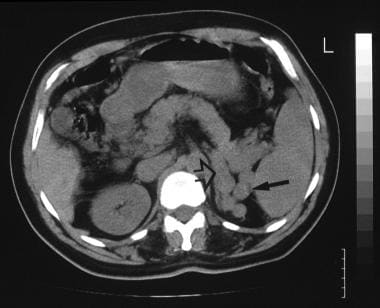 A 52-year-old man with known hepatitis B cirrhosis was found to have a hypoechoic mass in the region of the liver hilum (same patient as in the previous image). CT was performed for further characterization. Nonenhanced CT scan shows multiple polypoid masses at the splenic hilum (solid arrow), suggestive of a dilated tortuous splenic vein or varices, and the origin of a large splenic vein (open arrow). The final diagnosis was hepatocellular carcinoma, cirrhosis, and portal vein thrombosis/portal hypertension complicated by a spontaneous splenorenal shunt.
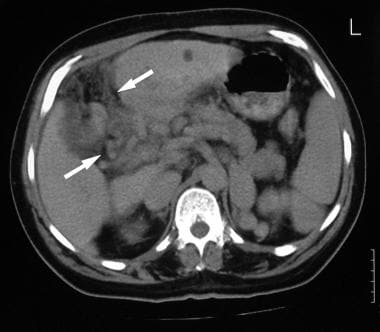 Contrast-enhanced axial CT (same patient as in the previous 2 images) shows a cavernous transformation at the porta hepatis (arrows) caused by portal vein thrombosis. The final diagnosis was hepatocellular carcinoma, cirrhosis, and portal vein thrombosis/portal hypertension complicated by a spontaneous splenorenal shunt.
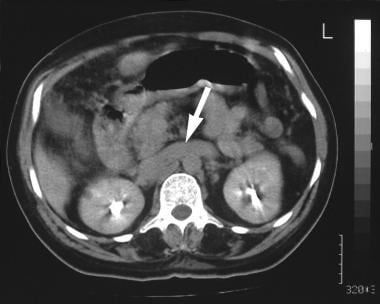 Contrast-enhanced axial CT scan shows a dilated left renal vein (arrow; same patient as in the previous 3 images). The final diagnosis was hepatocellular carcinoma, cirrhosis, and portal vein thrombosis/portal hypertension complicated by a spontaneous splenorenal shunt.
In the absence of obvious abnormality of size and shape, the liver may appear entirely normal on CT scans. Nonenhanced CT is necessary for identification of confluent fibrosis when a cirrhotic liver is imaged. Confluent fibrosis is characteristically of low attenuation and tends to become isoattenuating or minimally hypoattenuating after the intravenous administration of contrast material. Thus, confluent fibrosis is frequently missed if only contrast-enhanced CT is used.
Collateral veins are occasionally seen in the peritoneal cavity, the retroperitoneum, the abdominal wall, and the mediastinum. In the presence of hemochromatosis, liver attenuation is increased because of excessive iron load. As a result of poor inherent contrast between normal liver and many types of liver lesions, lesions are missed on plain CT.
The portal vein supplies 75% of blood flow to the liver; therefore, peak liver contrast enhancement occurs during the portal venous phase, approximately 60 seconds after the start of a bolus injection of contrast material. With helical CT, approximately 20 seconds is required to complete a liver examination; an image usually can be acquired in a single breath hold. The technique may be extended, and dual-phase contrast-enhanced CT scans may be acquired. In this technique, the liver is imaged twice with a single bolus of contrast agent, first during the arterial phase and then through the portal venous phase.
Dual-phase CT is indicated for some patients with benign and malignant lesions in which vascular characteristics suggest the correct diagnosis. Angiographically assisted CT may be used to achieve better delineation of the portal venous system and of the portal venous enhancement of the liver. An angiographic catheter is placed in the common celiac axis/hepatic/superior mesenteric artery by use of a modified Seldinger technique via the femoral artery.
CT scanning begins 3-5 seconds after the initiation of the contrast agent injection. The examination should be completed as soon as possible, before the contrast material recirculates. To prevent significant artifacts related to the contrast medium, 70 mL of dilute iodinated contrast agent (1–30%) is used, with an infusion rate of 2 mL/s.
Although angiographically assisted CT scanning may produce elegant images, it is invasive, it is expensive, and it has not gained widespread acceptance.
Portal vein thrombosis (PVT) may manifest as a hypoattenuating center in the portal vein surrounded by peripheral enhancement on contrast-enhanced CT. The attenuation of the portal vein is 20-30 HU less than that of the aorta after the administration of contrast material.
CT findings in Budd-Chiari syndrome (BCS) include inhomogeneous mottled-liver contrast enhancement with delayed enhancement in the periphery of the liver and around the hepatic veins. The caudate lobe is enlarged and has increased contrast enhancement compared with the rest of the liver. Thrombosis within the hepatic veins and the inferior vena cava (IVC) may sometimes be identified.
CT angiography
CTA is an application of helical CT. The speed of helical CT allows the maintenance of a higher concentration of intravenous contrast medium, particularly through the arterial enhancement phase, with the capability of 3-dimensional reconstruction. Both peripheral intravenous injections of contrast material and CT arterial portography have been used as a basis for CTA.
CTA has shown great promise in the evaluation of hepatic vessels before liver resection. It provides preoperative surgical information regarding the segmental location of liver tumors, the segmental venous anatomy, and significant arterial anomalies if present. The value of CTA for patients with PH remains unclear.
Degree of confidence
A diagnosis of portal hypertension frequently is made on the basis of the demonstration of signs of cirrhosis. Splenomegaly and ascites are demonstrated readily on CT; however, CT findings in cases of cirrhosis are highly variable. In some patients, the liver is of nonuniform attenuation; hypoattenuating components probably represent residual foci of infiltration.
Often, the attenuation of a cirrhotic liver is homogeneous and within the reference range. In the absence of obvious abnormalities of size and shape, the liver may appear entirely normal on CT scans. Nonenhanced CT is necessary when the cirrhotic liver is imaged for the identification of confluent fibrosis. Confluent fibrosis characteristically demonstrates low attenuation, which tends to become isoattenuating or minimally hypoattenuating on CT following intravenous contrast enhancement. Thus, confluent fibrosis is frequently missed if only contrast-enhanced CT is used.
Collateral veins are occasionally seen in the peritoneal cavity, retroperitoneum, abdominal wall, and mediastinum. CT lacks the dynamic capability of angiography in demonstrating the exact sites of portosystemic shunts and the feeding vessels.
In patients with cirrhosis, CT scans may appear entirely normal. Other causes of diffuse liver disease, such as splenomegaly and ascites, must be considered.
Magnetic Resonance Imaging
The vascular anatomy of the liver may be outlined by use of spin-echo and gradient-recalled echo MRI, but these techniques cannot demonstrate the direction of portal flow. Time-of-flight MRI with bolus tracking has been found to be successful in imaging portal hypertension and its sequelae.
Phase-contrast sequences may be used to evaluate the portal vein, and phase-contrast cine MRA may show the direction of portal venous flow and the presence of portal vein thrombus.
MRI evaluation of the portal venous system is accurate in demonstrating thrombosis and collateral circulation; however, MRI remains an expensive tool with limited availability.
Standard MRI findings reported in Budd-Chiari syndrome (BCS) include hepatic vein thrombosis, hepatic vein occlusion and narrowing, hepatomegaly, atrophy of the right lobe of the liver, and enlargement of the caudate lobe. Liver parenchyma is inhomogeneous (64%). IVC abnormalities, as demonstrated on MRI, include diffuse narrowing or focal thrombosis.
Venous collaterals are readily shown. Liver transplantation is regarded by many as the definitive treatment for portal hypertension. Although portal vein thrombosis is no longer considered as a contraindication to liver transplantation, demonstration of a portal vein thrombus is necessary for patient care. MR is an ideal noninvasive method for detection of portal vein thrombus. Although it is not critical, visualization of venous collaterals is useful for assessing the severity of disease. All major portosystemic collaterals may be detected by using MRA.
Comma-shaped intrahepatic varices are a characteristic finding not appreciated by other modalities. These collaterals are formed in an attempt to bypass the obstructed flow.
In patients with elevated creatinine levels who cannot undergo a CT scan with intravenous contrast enhancement, MRI with gadolinium enhancement may often be performed. These contrast-enhanced images are typically breath-hold fast spoiled gradient-echo sequences, which may be dynamically obtained in both the arterial and portal venous phases. [29, 30, 31]
Gadolinium-based contrast agents have been linked to the development of nephrogenic systemic fibrosis (NSF) or nephrogenic fibrosing dermopathy (NFD). The disease has occurred in patients with moderate to end-stage renal disease after being given a gadolinium-based contrast agent to enhance MRI or MRA scans. NSF/NFD is a debilitating and sometimes fatal disease. Characteristics include red or dark patches on the skin; burning, itching, swelling, hardening, and tightening of the skin; yellow spots on the whites of the eyes; joint stiffness with trouble moving or straightening the arms, hands, legs, or feet; pain deep in the hip bones or ribs; and muscle weakness.
Degree of confidence
MRI does not offer an advantage over CT in the diagnosis of cirrhosis; however, morphologic changes identified on US or CT are clearly depicted on MRI. One advantage of MRI over CT is its capacity to characterize regenerative nodules in a cirrhotic liver. MRA may offer a noninvasive, non–operator dependent evaluation of the portal venous system; however, the exact sensitivity and specificity still need to be determined.
Ultrasonography
Flow studies of hepatic vessels may provide important information about the hemodynamic effects of hepatic parenchymal disease (see the images below). [16, 17, 32, 33, 34, 35] Examination results are not always straightforward because the liver may move during respiration, but breath holding may facilitate the demonstration of blood flow and hepatic waveforms, particularly in the hepatic veins. [10, 36]
Examination is undertaken with as small an angle as possible between the axis of the US beam and the long axis of the vessel. This approach is usually straightforward because the hepatic veins course posteriorly to the inferior vena cava (IVC), whereas the portal vein curves forward as it passes through the porta hepatis. The blood flow waveform from the left hepatic vein frequently shows artifact caused by cardiac pulsation. Thus, when the hepatic veins are examined, the middle and right hepatic veins are usually encountered. The hepatic artery is small, and usually, it must be examined on suspended respiration.
Doppler analysis of vascular flow patterns is a valuable adjunct to real-time 2-dimensional scanning. Color-flow analysis is a valuable means of differentiating vessels from other fluid-filled structures. Power Doppler analysis is particularly valuable for demonstrating low flow rates in small vessels.
Vascular indices, which are used in flow analysis, include the time-averaged mean velocity and the pulsatility index. The pulsatility index is low if the vascular bed is of low resistance and can accommodate sudden pressure waves. A high-resistance or low-compliance vascular bed shows a high pulsatility index.
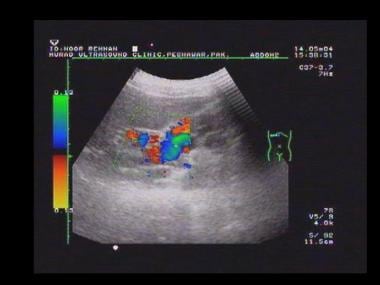
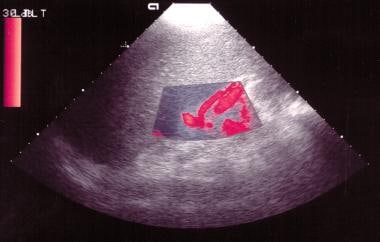 Power Doppler sonogram through the spleen shows varices at the hilum of an enlarged spleen. The final diagnosis was hepatitis C cirrhosis, hepatocellular carcinoma of the left hepatic lobe (which had ruptured into the peritoneum), and portoarterial fistula (which had developed inside the ruptured tumor, giving rise to severe portal hypertension).
 Duplex spectral Doppler sonogram of the portal vein (same patient as in the previous image) shows a bidirectional flow within the vein. The final diagnosis was hepatitis C cirrhosis, hepatocellular carcinoma of the left hepatic lobe (which had ruptured into the peritoneum), and portoarterial fistula (which had developed inside the ruptured tumor, giving rise to severe portal hypertension).
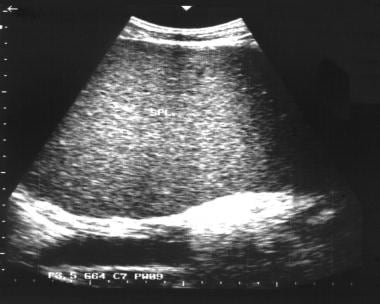
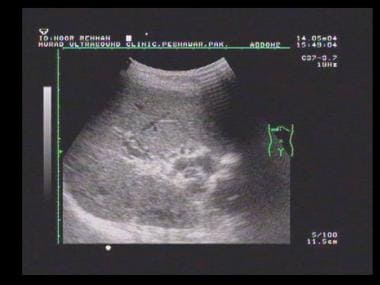
 Transverse sonogram of the liver in a patient with hepatitis B cirrhosis shows a coarse echo structure of the liver.
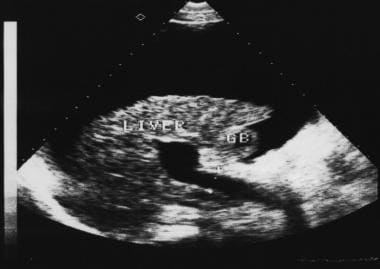
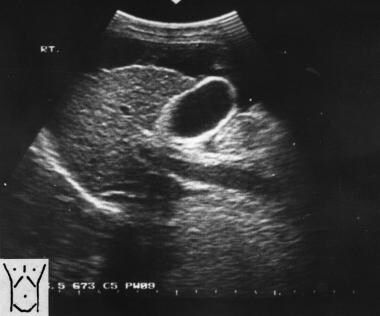 Sagittal oblique sonogram of the liver shows a small liver with an irregular surface, moderate ascites, and a dilated portal vein. Note the thick gallbladder wall.
 Sagittal oblique sonogram of the liver shows a dilated portal vein (22 mm in transverse diameter) in a patient with portal hypertension.
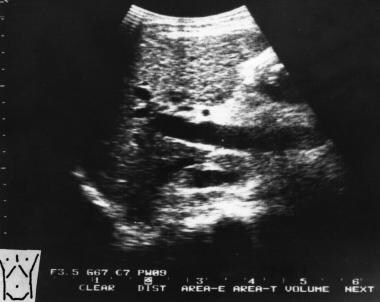
 End-stage liver cirrhosis showing a small liver, gross ascites, and a dilated portal vein
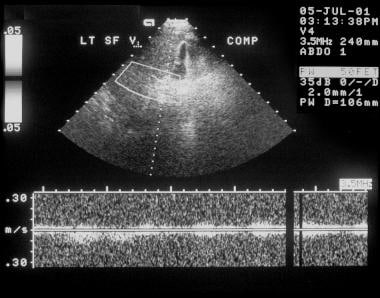
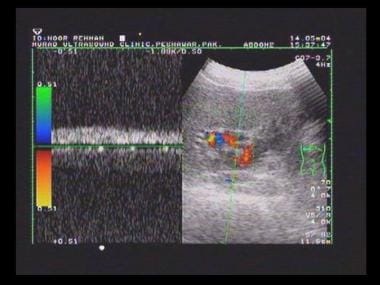
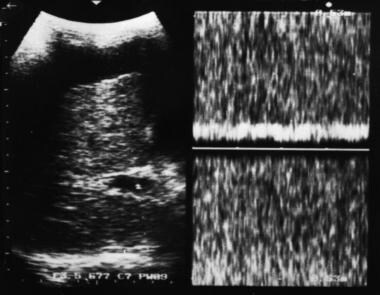 Doppler sample volume in portal vein reveals continuous venous flow without evidence of respiratory variation, consistent with a hypertensive portal venous system. Note the coarse liver echo structure and ascites.
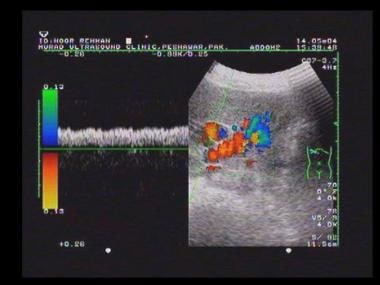
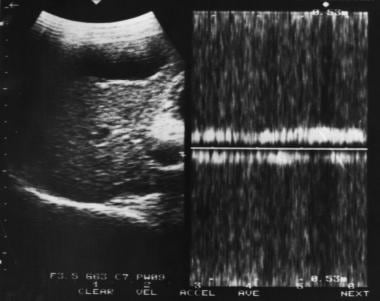 Doppler sample volume in portal vein reveals bidirectional flow in the portal vein associated with portal hypertension.
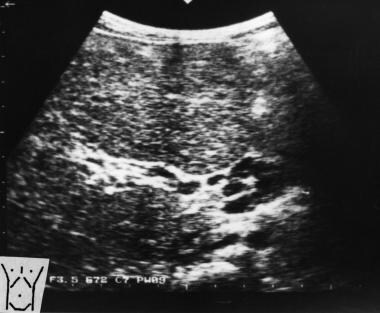
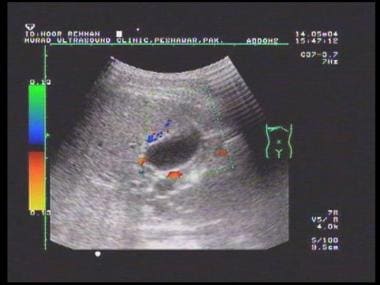
 Sagittal oblique sonogram of the liver shows several tubular structures at the porta hepatis resulting from cavernous transformation secondary to portal vein thrombosis.
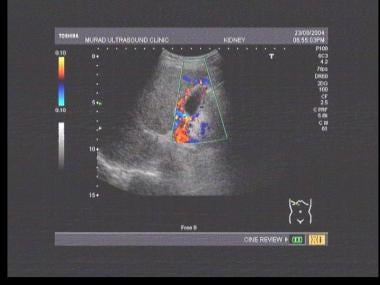
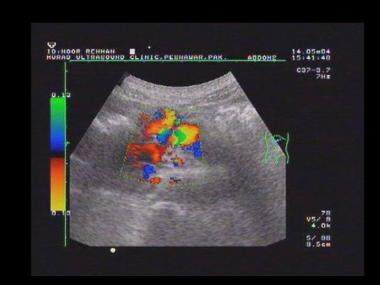
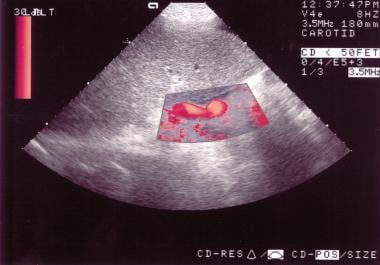 Duplex power Doppler sonogram shows an enlarged spleen; varices are apparent at the splenic hilum.
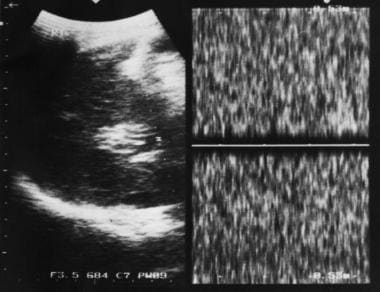
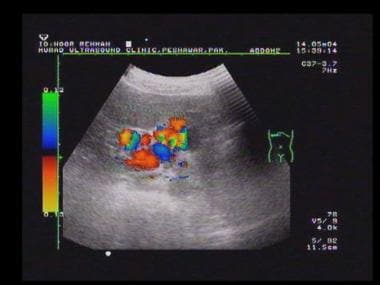
Doppler sonogram at the splenic hilum reveals hepatofugal venous flow in a patient with portal hypertension.
Duplex power Doppler sonogram shows an enlarged spleen; varices are apparent at the splenic hilum.
Doppler sonogram at the splenic hilum reveals hepatofugal venous flow in a patient with portal hypertension.
Portal vein waveforms
The portal vein typically shows continuous forward flow with minor modulation caused by respiration and transmitted arterial pulsation. The rate of blood flow is greatest at the center of the vessel and is least at its margins; therefore, the average flow across a segment of the vessel is used to overcome the internal variation resulting from respiration and transmitted cardiac pulsation. The time-averaged velocity usually is on the order of 12–14 cm/s in adults.
Flow within the portal vein changes rapidly in response to eating. Blood flow to the small bowel begins to increase within 2 minutes of taking the first mouthful of food. The time-averaged blood flow velocity in the portal vein may increase to 25 cm/s after a meal, and with minor increase in vessel diameter, the flow volume may increase 4–5 times.
Most patients with mild hepatic parenchymal disease have normal portal venous blood flow. As hepatic disease becomes more severe, the first detectable flow abnormality is a reduction in the level of increase in flow seen after a meal. Then, the splenic and superior mesenteric veins may begin to distend, and the change in vessel caliber that is seen normally with respiration is lost. In severe hepatic parenchymal disease, portal venous blood flow is reduced, and a rough correlation is noted between the degree of reduction in portal flow velocity and the severity of hepatic parenchymal disease (providing that studies are performed in strictly fasting patients).
As portal venous flow is compromised further, forward flow may be seen only during systole, with reversed flow occurring during diastole. Eventually, flow within the portal vein may be reversed continuously, but the rate and direction of flow may vary from day to day, particularly in patients with acute exacerbation of chronic liver disease. Therefore, serial examinations provide a better picture than single scans. Clearly reduced portal flow velocity is associated with an increase in the risk of thrombosis.
Portal venous shunts
Percutaneous creation of a shunt between the portal and hepatic veins with TIPS is becoming increasingly common as a treatment for portal hypertension. Doppler US may be used to assess patency and show the direction of flow within the portal vein and shunt. If the walls of an artificial shunt prevent direct analysis of blood flow within it, an analysis of flow at the ends of the shunt usually allows adequate assessment of shunt function.
Surgically created shunts include portocaval (end or side of main portal vein to IVC), mesocaval, and splenorenal shunts (Warren shunt). Mesocaval and splenorenal shunts are used more frequently to maintain portal venous patency for transport than for other purposes. Color Doppler imaging is valuable for the evaluation of shunts.
US evaluation of PH
The diameter of the portal vein is measured with the patient in a supine position, in quiet respiration, and having fasted for a minimum of 4 hours. Measurements are made at the point at which the portal vein crosses the IVC. In an individual without portal hypertension, the diameter of the portal vein is 13 mm or 16 mm during deep inspiration.
Under standard conditions, measurements greater than 13 mm indicate PH with a specificity of 100% but a low sensitivity of 45-50%. Sensitivity may be increased to 81% by measuring splenic vein and superior mesenteric vein diameters. An increase of 20-100% in diameter during deep inspiration is normal. An increase of less than 20% is associated with PH.
The differential diagnosis of a dilated portal vein includes PH splenomegaly (whatever the cause), acute portal vein thrombosis (PVT), and postprandial increase in portal vein diameter.
Liver stiffness quantified by ultrasound transient elastography has been used to determine liver cirrhosis. Ultrasound transient elastography has been demonstrated, in some studies, to identify CSPH with satisfactory diagnostic accuracy when compared with HVPG measurement. [37, 38, 39, 40, 41]
Portal flow direction and velocity
Usually, blood flow in the portal vein is hepatopetal (toward the liver) during the entire cardiac cycle. The mean velocity is 15-18 cm/s and varies with cardiac cycle. In PH, velocity fluctuations disappear, resulting in continuous flow. With a further increase in portal venous pressure, the blood flow direction becomes to-and-fro (biphasic), and finally, the direction is reversed (hepatofugal).
Differential diagnosis of hepatofugal portal venous flow includes PH, Budd-Chiari syndrome (BCS), side-to-side portocaval shunts, surgical or spontaneous splenorenal shunts with cirrhosis, and tricuspid regurgitation (tricuspid flow reversal). Differential diagnosis of portal venous flow reversal includes severe PH, tricuspid regurgitation, and congestive heart failure.
The differential diagnosis of reversal of hepatofugal-to-hepatopetal portal flow includes eating and the use of drugs that increase portal flow. Static flow without Doppler signal occurs occasionally.
Pulsatile portal vein flow
A pattern similar to that seen in patients with impaired right heart function occasionally is seen in patients with cirrhosis and/or PH. Patients with right-sided cardiac dysfunction with pulsatile portal venous flow invariably have abnormal liver function.
The differential diagnosis of pulsatile portal venous flow includes tricuspid regurgitation, aortic–right atrial fistula, fistula between the portal vein and hepatic vein, PH, and congestive heart failure. Rarely, it is a false-positive finding.
Decreased volume flow in the portal vein
In mild to moderate PH, the volume of flow in the portal vein is maintained. A reduction in volume flow occurs with advanced cirrhosis when intrahepatic obstruction to portal flow is severe, as indicated by hepatofugal flow and extensive portosystemic collaterals.
Congestive Index
PH may be recognized by use of the congestive index, in which the ratio of the portal vein (in units of square centimeter) is divided by the mean portal flow velocity (in units of centimeter per second). This ratio reflects the physiologic changes that occur in PH (ie, portal vein dilatation associated with diminished flow velocity). In individuals without PH, the ratio should not exceed 0.7.
Splenomegaly
The size of the spleen is not well correlated with the level of PH; however, if splenomegaly is absent, PH is unlikely. The spleen is best measured in the coronal plane. In the midaxillary line, a cephalocaudal measurement greater than 13 cm suggests enlargement.
Splenic interface sign
Linear reflective channels are observed in the splenic parenchyma in a variable number of patients with PH. Channels may be explained by dilatation of intrasplenic venous sinuses with increased collagen in the walls and by periarterial fibrosis. The pathologic changes are known to occur in PH. The splenic interface sign seldom is found in patients with splenomegaly that is unrelated to PH. The vascular nature of channels is readily confirmed by using CDI.
Ascites
Uncomplicated PH usually does not cause ascites. Usually, ascites occurs secondary to underlying liver diseases with liver cell failure.
Arterialization of hepatic blood supply
Hepatic arteries are enlarged and usually have aliased frequency shifts compared with those of normal hepatic arteries. The arteries also appear tortuous. As portal venous flow to the liver decreases, arterial flow increases. Increased arterial flow occurs with the development of large collaterals and hepatopetal flow.
The differential diagnosis of an enlarged hepatic artery includes an occluded or interrupted portal vein, a surgical portosystemic shunt, reversal of flow in the portal vein, parenteral feedings in newborns, hereditary hemorrhagic telangiectasia, cirrhosis or hepatic diseases associated with alcohol, vascular hepatic tumors, and primary hepatic artery dissection.
Portosystemic venous collaterals
The demonstration of portosystemic venous collaterals (PVCs) is diagnostic of PH.
Umbilical venous collateral flow is an important feature of PH because it has a specificity of 100%. Typically, an artery or vein with a diameter of 2 mm may be present within the ligamentum teres. Thus, the demonstration of a blood vessel in the ligamentum teres does not equate with the presence of a PVC. The diagnosis of PVCs requires the demonstration of venous flow away from the liver. The enlarged umbilical vein is usually solitary, originating in the left portal vein, which courses inferiorly through the falciform ligament and along the anterior abdominal wall to the umbilicus, seen on longitudinal or transverse scans.
The diameter of a typical left gastric vein is 4 mm; a diameter greater than 7 mm is evidence of an abnormal portosystemic gradient (>10 mm Hg). Because the left gastric vein may be seen in some individuals without PH, its presence does not indicate PH. A left gastric vein appears as a prominent cephalic-directed vessel that joins the portal vein near the termination of the superior mesenteric vein.
Splenosystemic collaterals may form as a result of splenic venous occlusion as well as PH. Demonstration of splenic venous occlusion with US is straightforward because in most patients, it is possible to trace the splenic vein to the portal vein. With splenic vein occlusion, collaterals may be identified in the pancreatic bed or the gastroesophageal area.
Tortuous short gastric and gastroesophageal veins near the upper pole of the spleen and gastroesophageal junction are seen primarily on coronal images. Large portosystemic collaterals at the esophagogastric junction may be mistaken for neoplastic masses if Doppler examination is omitted. Right gastric veins are cephalically directed and are seen along the inferior border of the left lobe of the liver on longitudinal scans.
Splenorenal veins are demonstrated as tortuous, inferiorly directed vessels from the splenic hilum to the left kidney; they are primarily seen on coronal images. The left renal vein may be dilated. Retroperitoneal portosystemic collaterals (varices) may mimic other masses (eg, pancreatic carcinoma or other retroperitoneal tumors) on both CT and US images. CDI may show the mass to be full of flow colors; other signs of PH are often present.
Banti syndrome
Banti syndrome, or noncirrhotic idiopathic PH, is a common cause of PH in India and Japan but is rare in the United States and Europe. The syndrome is characterized by signs of PH, but liver function test results tend to remain normal. Hepatic wedge pressure readings are usually normal or slightly elevated. Signs of hypersplenism are often present. US shows a normal-appearing liver; patent hepatic veins; and a patent portal vein, which may be associated with multiple portosystemic collaterals.
Portal venous thrombosis
PVT is being recognized with increasing frequency on US images. Reduced portal blood flow resulting from hepatic parenchymal disease and abdominal sepsis are the primary causes. Transient PVT is also being recognized with increasing frequency, in part because of the large increase in the use of US in evaluating patients with abdominal inflammation, such as appendicitis. Tumor within the portal vein may appear identical to thrombosis, but it is far less common. Tumor within the portal vein is most frequently related to a hepatocellular carcinoma, which gives rise to serpiginous filling defects in the portal venous luminal flow, but it usually persists around the tumor without complete occlusion.
Adults with acute PVT secondary to abdominal sepsis completely recover with vessel recanalization after successful treatment of underlying sepsis. In children, the portal vein may recanalize by developing multiple small collateral channels, which are seen as a partly echogenic band of small vessels running to the porta hepatis. These show reduced flow velocity of 2-7 cm/s. Nonvisualization of the portal vein is strongly suggestive of occlusion. Then, the portal vein may be seen as a band of high-level echoes at the porta hepatis.
Causes of PVT include idiopathic causes, malignancy (hepatocellular carcinoma, cholangiocarcinoma, pancreatic carcinoma, and stomach carcinoma), trauma (which may be iatrogenic, such as umbilical vein catheterization), and abdominal sepsis (pancreatitis, perinatal sepsis, omphalitis, appendicitis, diverticulitis, cirrhosis), especially in younger individuals.
On sonograms, clot exhibits variable echogenicity; it may be hypoechoic or anechoic if it has recently formed. Conversely, patent vessels may show increased intraluminal echogenicity because of artifact or erythrocyte rouleaux formation. In isolation, increased or decreased echogenicity in the lumen of the portal vein is not sufficient to make a diagnosis of PVT or to exclude PVT. In patients with PVT, the venous flow signal that is typically obtained from the lumen of the portal vein during pulsed or color-flow Doppler imaging is absent, and flow may be seen around a thrombus that partially occludes the vein. However, if flow is sluggish, the Doppler signal may not be detected. Color flow may be demonstrated in other small collaterals.
Incomplete occlusion (common in neoplastic invasion) or thrombolytic recanalization may occur. These cannot be differentiated by use of US. Hepatopetal flow may be demonstrated, and spontaneous shunts may be visualized (splenorenal).
US may demonstrate portosystemic collaterals, and the cause may be identified, such as hepatocellular carcinoma, metastases, cirrhosis, and pancreatic neoplasms. The incidence of PVT is reported to be low in patients with PH, but it is associated with sclerotherapy. The string sign, or thickening of the portal vein with narrowing of its lumen, which is interpreted as a portal phlebitis, is considered a precursor of PVT in patients with acute pancreatitis. The portal vein thrombus may become calcified.
Cavernous transformation of the portal vein
Cavernous transformation occurs in patients with long-standing PVT (19%) when numerous multiple collateral vessels develop around the occluded portal vein; these collateral vessels appear as vermiform tubular structures at the porta hepatis. Application of color-pulsed Doppler imaging shows blood flow in the periportal collaterals around the thrombosed portal vein. Cavernous transformation of the portal vein has been reported to appear as a subhepatic spongelike mass. This appearance also has been reported in patients with pancreatic hemangiosarcoma.
Bile duct varices, also called the pseudocholangiocarcinoma sign, are not infrequently observed during endoscopic retrograde cholangiopancreatography. In patients with PH, they result from cavernous transformation of the portal vein. Studies report that the sign may disappear after a TIPS procedure.
Assessment of TIPS
TIPS involves the percutaneous placement of a shunt via the jugular vein. TIPS is becoming popular as a definitive procedure for decompressing the portal venous system or as a prelude to liver transplantation.
Doppler US is a sensitive and relatively specific means of evaluating TIPS malfunction. US evaluation of the shunt is usually performed within 24 hours after shunt placement to establish baseline velocities within the portal vein, hepatic vein, and shunt. Follow-up studies are usually performed at 3-month intervals unless the clinical setting dictates a more emergent examination. The primary object of Doppler study of a TIPS is to document flow in the shunt and to demonstrate stenosis. The accuracy of Doppler US in shunt malfunction depends on several US parameters, which include the peak shunt velocity, distal shunt velocity, and antegrade flow in the left and right portal veins.
Flow velocities in the portal vein may double in comparison with the preoperative velocities in a successful TIPS placement. Direct observation of shunt thrombosis is possible with duplex or color Doppler US. Echo-enhanced color Doppler US may also be helpful in the assessment of TIPS.
Complications of TIPS that are detectable with US include early complications and delayed complications.
Early and delayed complications
Early complications include the following:
-
Intraperitoneal hemorrhage
-
Shunt thrombosis
-
Neck hematoma
-
Compromise of hepatic blood supply: PVT, hepatic artery occlusion, hepatic infarction
-
Failed stent deployment: inadequate stent expansion, stent migration, stent fracture
-
Biliary obstruction
Shunt stenosis may be a delayed complication, such as pseudointimal hyperplasia and hepatic vein stenosis.
Degree of confidence
The demonstration of portosystemic shunts is a specific sign of portal hypertension. Umbilical vein collateral flow is an important feature of PH because it has a specificity of 100%. In individuals without PH, the caliber of portal, splenic, and superior mesenteric veins shows significant variation during respiration. When respiratory variation does not occur or when it is slight (< 20%), PH may be diagnosed with a sensitivity of 80% and a specificity of 100%. A portal vein diameter greater than 13 mm is specific for PH, but it is not a sensitive indicator of PH.
False positives and negatives include the following:
-
The differential diagnosis of a dilated portal vein includes PH splenomegaly (of any cause), acute PVT, and postprandial increase in portal vein diameter.
-
The differential diagnosis of portal vein flow reversal includes severe PH, tricuspid regurgitation, and congestive heart failure.
-
The differential diagnosis of reversal of hepatofugal-to-hepatopetal portal flow includes eating and the use of drugs that increase portal flow. Static flow without Doppler signal occurs occasionally.
-
The differential diagnosis of pulsatile portal vein flow includes tricuspid regurgitation, aortic–right atrial fistula, fistula between the portal vein and hepatic vein, PH, and congestive heart failure. Rarely, it may be a false-positive finding.
-
Uncomplicated PH usually does not cause ascites. Usually, ascites occurs secondary to underlying liver diseases with liver cell failure.
-
The differential diagnosis of an enlarged hepatic artery includes an occluded or interrupted portal vein; a surgical portosystemic shunt; reversal of flow in the portal vein; parenteral feeding in newborns; hereditary hemorrhagic telangiectasia; cirrhosis or hepatic diseases associated with alcohol; vascular hepatic tumors; and primary hepatic artery dissection.
Angiography
Angiographic evaluation of the portal venous system may be performed (see the images below). Splenic pulp measurement provides an accurate reflection of the portal venous pressure, both in hepatic and prehepatic causes of PH. An intravenous injection of radiographic contrast medium into the splenic pulp outlines the portosystemic collaterals (ie, splenic and portal veins); it demonstrates well the intrahepatic portal radicles and enables an assessment of the rapidity of washout of the vessels in a hepatopetal direction. With reversal of flow within the portal vein resulting from severe PH, the splenic and portal veins are not visualized; the contrast outflow tract is via gastroesophageal collaterals. With splenic thrombosis/PVT, not only is the site of the obstruction evident but also portal-portal collateral veins, which regularly develop, are demonstrated as well.
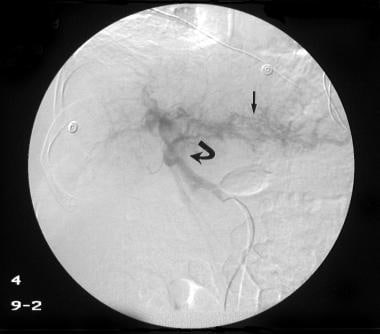
 Venous phase of a digital subtraction celiac-axis angiogram shows no splenic vein, but multiple collateral venous pathways are seen through the stomach wall (straight arrows), which feed a normal portal vein (curved arrows). Several varices are noted within the body of the stomach. The final diagnosis was left-sided portal hypertension secondary to splenic vein thrombosis.
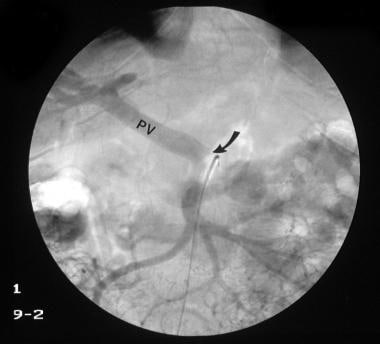 Venous phase of a digital subtraction superior mesenteric angiogram (same patient as in the previous image) shows a normal portal vein (PV) with no streaming effect from splenic venous flow (arrow), suggestive of splenic vein thrombosis. The final diagnosis was left-sided portal hypertension secondary to splenic vein thrombosis.
 Digital subtraction selective common hepatic artery angiogram shows immediate filling of the portal venous radicles in the left lobe of the liver (straight arrow) and early filling of portal vein (curved arrow), suggestive of hepatic arterial-portal vein fistula. The final diagnosis was hepatitis C cirrhosis, hepatocellular carcinoma of the left hepatic lobe (which had ruptured into the peritoneum), and portoarterial fistula (which had developed inside the ruptured tumor, giving rise to severe portal hypertension).
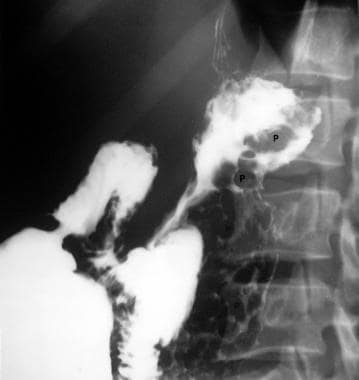
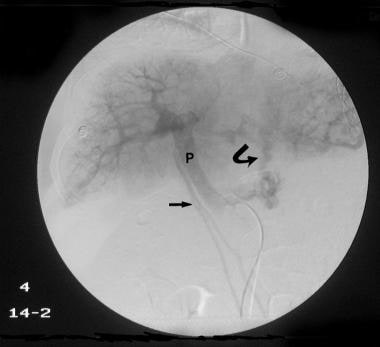 Delayed venous phase of a selective common hepatic angiogram (same patient as in the previous image) shows the portal vein (P), with filling of the left gastric vein caused by retrograde flow feeding gastric and lower esophageal varices (arrows). Retrograde flow in enlarged umbilical veins also is seen. The final diagnosis was hepatitis C cirrhosis, hepatocellular carcinoma of the left hepatic lobe (which had ruptured into the peritoneum), and portoarterial fistula (which had developed inside the ruptured tumor, giving rise to severe portal hypertension).
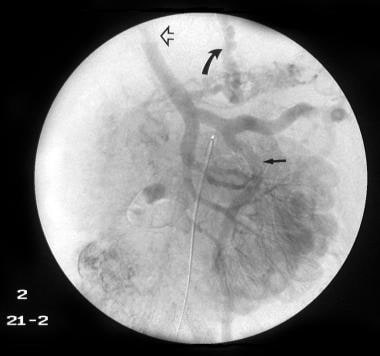 Digital subtraction venous phase of a superior mesenteric artery angiogram (same patient as in the previous 2 images) shows retrograde flow into the left gastric vein (curved arrow) and the inferior mesenteric vein (straight arrow). Note the flow defect of the distal portal vein caused by retrograde flow (open arrowhead). The final diagnosis was hepatitis C cirrhosis, hepatocellular carcinoma of the left hepatic lobe (which had ruptured into the peritoneum), and portoarterial fistula (which had developed inside the ruptured tumor, giving rise to severe portal hypertension).
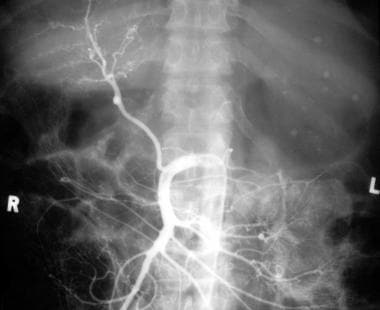 Conventional angiogram of the superior mesenteric artery shows a replaced hepatic artery in the right lobe of the liver in a patient with a previous history of abdominal tuberculosis and a recent history of hematemesis. Note the multiple calcific foci in the splenic region as a result of old healed tuberculous granulomas. Two previous liver biopsies had not revealed the changes of cirrhosis. The final diagnosis was tuberculous calcified lymph nodes at the porta hepatis causing portal vein stenosis by extrinsic pressure, portal hypertension, and esophageal and gastric varices.
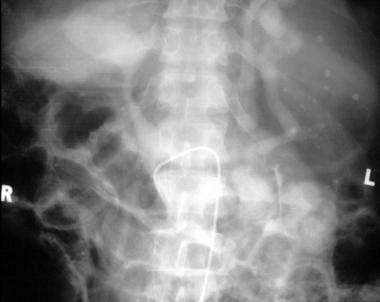 Venous phase of a superior mesenteric angiogram shows a stenosis of the portal vein near the porta hepatis with poststenotic aneurysmal dilatation of the portal vein. Filling of the gastric varices and the splenic vein are seen as a result of retrograde flow (same patient as in the previous image). The final diagnosis was tuberculous calcified lymph nodes at the porta hepatis causing portal vein stenosis by extrinsic pressure, portal hypertension, and esophageal and gastric varices.
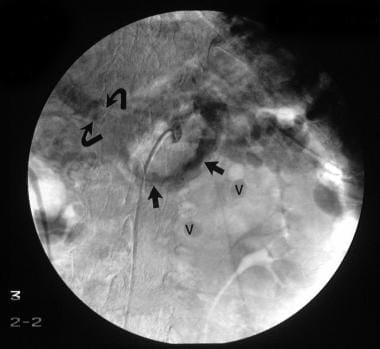
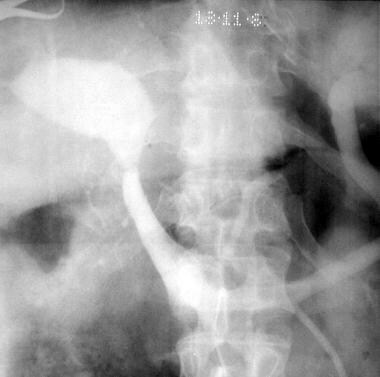 Intraoperative portogram shows portal vein stenosis and a portal vein aneurysm. The splenic vein is outlined because of retrograde flow (same patient as in the previous 2 images). The final diagnosis was tuberculous calcified lymph nodes at the porta hepatis causing portal vein stenosis by extrinsic pressure, portal hypertension, and esophageal and gastric varices.
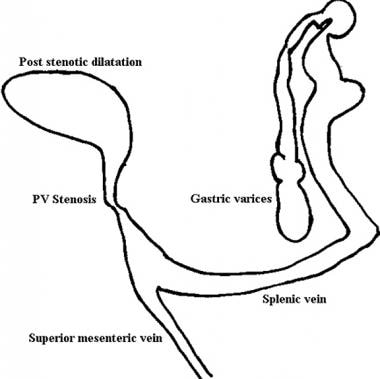 Line diagram of findings on portal venous phase angiogram (same patient as in the previous 3 images). The superior mesenteric vein has been added for anatomic clarity. The final diagnosis was tuberculous calcified lymph nodes at the porta hepatis causing portal vein stenosis by extrinsic pressure, portal hypertension, and esophageal and gastric varices.
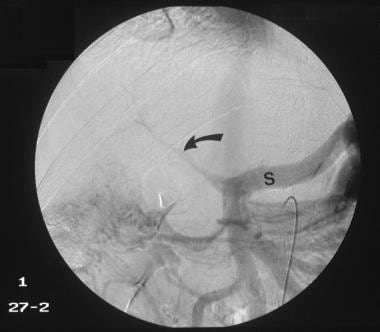 Venous phase of digital subtraction superior mesenteric angiogram shows the portal vein to be reduced to a threadlike structure (arrow). Retrograde flow into the splenic vein (S) is seen. The final diagnosis was hepatocellular carcinoma, cirrhosis, and portal vein thrombosis/portal hypertension complicated by a spontaneous splenorenal shunt.
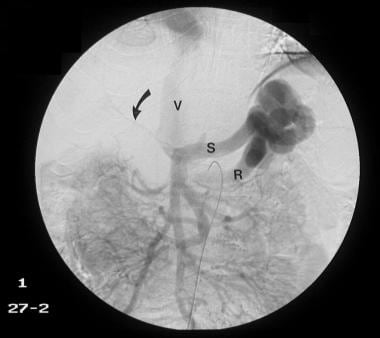 Venous phase of a digital subtraction superior mesenteric angiogram shows a shunt between the splenic vein (S) and the left renal vein (R), and the IVC (V) is outlined with contrast material. Arrows mark the tiny threadlike portal vein (same patient as in the previous image). The final diagnosis was hepatocellular carcinoma (not shown), cirrhosis, and portal vein thrombosis/portal hypertension complicated by a spontaneous splenorenal shunt.
Splenoportography
Because of the use of alternative imaging methods, the use of splenoportography (SP) has declined considerably after having played a primary role in the investigation of cirrhosis and PH for several years. However, restricted indications remain for the procedure. Even with the available methods of direct or indirect visualization of the portal vein, much of the information necessary to evaluate cirrhosis or PH may be obtained by use of SP (see the images below).
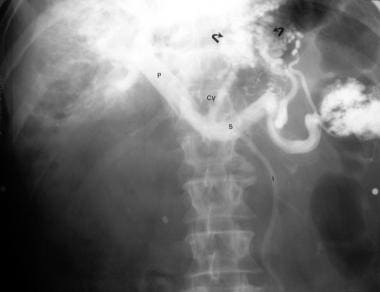 Splenoportogram in a patient with known alcoholic cirrhosis and two episodes of variceal bleeding in the past. The procedure was performed as a prelude to surgical portosystemic shunt placement. The splenoportogram shows a dilated left gastric vein (coronary vein, CV) feeding the lower esophageal and gastric varices (arrows). Retrograde filling of the inferior mesenteric vein (I) is present, but the main portal vein flow is hepatopetal in direction.
 Digital subtraction splenoportogram in a patient with portal hypertension shows a subcapsular contrast leak (arrows), which is a known complication of splenoportography.
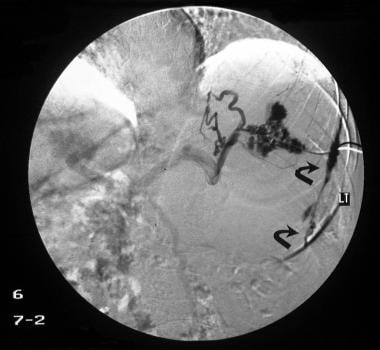
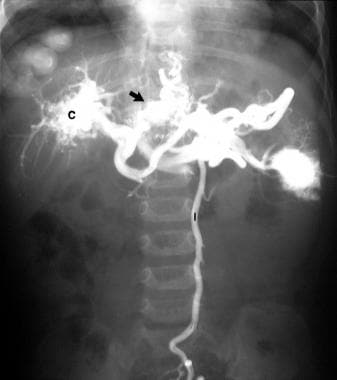 Splenoportogram in a 3-year-old child with a history of serious febrile illness in infancy and recent hematemesis. Splenoportogram shows a thrombosed distal portal vein and a cavernous malformation at the porta hepatis (C). The arrow marks gastric and esophageal varices. The inferior mesenteric vein is outlined because of reverse flow (I).
Intraoperative portogram shows portal vein stenosis and a portal vein aneurysm. The splenic vein is outlined because of retrograde flow (same patient as in the previous 2 images). The final diagnosis was tuberculous calcified lymph nodes at the porta hepatis causing portal vein stenosis by extrinsic pressure, portal hypertension, and esophageal and gastric varices.
Splenoportogram in a 3-year-old child with a history of serious febrile illness in infancy and recent hematemesis. Splenoportogram shows a thrombosed distal portal vein and a cavernous malformation at the porta hepatis (C). The arrow marks gastric and esophageal varices. The inferior mesenteric vein is outlined because of reverse flow (I).
Intraoperative portogram shows portal vein stenosis and a portal vein aneurysm. The splenic vein is outlined because of retrograde flow (same patient as in the previous 2 images). The final diagnosis was tuberculous calcified lymph nodes at the porta hepatis causing portal vein stenosis by extrinsic pressure, portal hypertension, and esophageal and gastric varices.
Contraindications to SP include coagulation defects, platelet count less than 50,000, ascites, an uncooperative patient, and splenic pathology (splenic mass lesions). To perform SP, the skin over the left side of the thorax and abdomen overlaying the spleen is prepared with an antiseptic after the spleen is localized. Historically, the spleen was localized by use of fluoroscopy and palpation and percussion, but currently, localization is more commonly performed by use of US. A skin bleb is raised near the lower pole of the spleen in mid respiration, and the soft tissues are infiltrated with local anesthetic down to the peritoneum.
The entry site of the needle usually is the 9th or 10th intercostal space in the midaxillary line. The needle is directed in a cephalic direction toward the splenic hilum. A nick is made at the site of the needle puncture, and a track is made into the soft tissues with a 12-gauge needle, which facilitates the placement of the SP needle. The SP needle is a 14-gauge, 6-inch-long polyethylene sheathed needle. With patient breath hold in mid respiration, the sheathed needle is introduced toward the direction of the splenic hilum, and the stilette is withdrawn, leaving the sheath in place. The patient is instructed to take shallow respirations during the examination.
If the spleen has been entered accurately, blood flows back via the sheath. Then, the sheath is connected to a spinal pressure manometer filled with saline, and the splenic pulp pressure is measured. The sheath is taped to the patient's side, and a test injection is made using 5 mL of contrast medium. When a sheath is placed correctly, contrast medium spreads into the splenic parenchyma, providing an uneven splenogram that rapidly drains into the splenic vein. With a subcapsular placement, the contrast agent is viewed as a homogeneous collection that spreads slightly as the agent is injected.
With subcapsular injection, the needle is withdrawn completely, and a fresh attempt is made to place the needle correctly. With the sheath correctly placed, a pump injection is performed using 40 mL of 75% contrast at a rate of 10 mL/s. The injection is usually painless; discomfort and shoulder pain may occur with subcapsular injection. After the procedure is complete, the needle tract is plugged with thromboembolic material, such as Gelfoam or Ivalon.
Complications of the procedure include hemorrhage, contrast agent extravasation, puncture of other organs, splenic hematomas, and capsular rupture. Capsular rupture may require emergency laparotomy and splenectomy. In addition to splenectomy, splenic artery embolization may be used to stop bleeding.
Indications for SP include the following:
-
Patency of the splenic vein is uncertain.
-
Arterioportography has been unsuccessful.
-
Portal pressure is required and other techniques have failed.
-
A more accurate imaging of the intrahepatic portal veins is required (eg, when phlebosclerosis is suggested).
In PH, the following findings may be noted with splenoportography (SP):
-
Tributary collaterals usually feed into the portal venous system and develop hepatofugal flow associated with elongation, tortuosity, and an increase in lumen size. The left gastric and short gastric veins lead to the gastroesophageal plexus and then to the hemiazygos and azygos systems and into the superior vena cava. The dilated veins in the esophageal submucosa that form varices may be outlined by contrast enhancement. The inferior mesenteric vein serves as another collateral, which may be demonstrated by reverse flow. Outflow is through the superior mesenteric vein via the retroperitoneum into the IVC. Abdominal surgery promotes the development of portosystemic shunts via adhesions.
-
Embryonic collaterals are no longer used under normal conditions, but they retain a potential lumen. In response to PH, these vessels open, dilate, and become elongated, tortuous, and beaded. They direct portal centrifugal flow. The paraumbilical collaterals are the only vessels in this group that commonly participate in the centrifugal flow. They communicate with the inferior or superior epigastric veins.
-
Watershed collaterals are usually tiny vessels that form communications between the portal and systemic circulations. They have virtually no blood flow. With an increase in the pressure gradient on either side, as occurs with PH or as a temporary result of the injection of contrast medium, significant flow occurs in the direction of the pressure gradient. With prolonged PH, the channels open permanently, dilate, elongate, and become tortuous. Splenorenal collaterals are the most common watershed collaterals; they may opacify with left adrenal and renal vein injections. Gastrorenal collaterals that also connect the splenic vein with the left adrenal and renal veins may opacify on rare occasions. Rarely, communications between the spleen, inferior phrenic vein, and left adrenal and renal veins are seen. Splenoretroperitoneal collaterals feed into the lumbar venous plexus and may communicate with intercostal veins. Unnamed collaterals frequently are observed.
-
Bridging collaterals with extrahepatic portal/splenic venous obstruction occur to preserve hepatopetal flow. With occlusion of the splenic vein, hepatopetal flow occurs via the short gastric veins into the left gastric vein and then on to the portal vein. Some flow also occurs via the gastroepiploic vein into the superior mesenteric vein. When the portal vein is occluded close to the hilum, bridging collaterals form a cavernoma or run parallel to the occluded portal vein. Numerous capsular vessels opacify the liver surface and feed the peripheral portal branches.
-
Intrahepatic portal vein changes depend on the severity of the cirrhotic process. Transit time of the contrast agent through the liver is diminished. In the early stages of cirrhosis, portal vein branches appear crowded but later are reduced in number. Portal radicles appear tortuous with abrupt caliber changes.
-
Occlusion/thrombosis of the portal vein is well demonstrated. A thrombotic plaque may be seen within the portal vein; this plaque should not be confused with nonopacified blood flowing in from the superior mesenteric vein. Note that nonopacification of the portal vein on SP does not necessarily mean that the portal vein is occluded; in severe hepatofugal flow, the portal vein may fail to opacify.
Carbon dioxide SP
Carbon dioxide has been employed as a contrast agent for SP; a 22- or 25-gauge needle is used (thereby exploiting the low viscosity of the gas). This technique is less traumatic than others, and it has been effective in visualizing the portal venous system. The hope is that the difference in the collateral venous filling patterns is significant, because carbon dioxide fills veins in the nondependent sites, whereas contrast material flows along the dependent sites. Contrast-enhanced SP has been infrequently used in the United States.
Transhepatic portography
With percutaneous transhepatic portography (PTP), the same technique is used as with percutaneous cholangiography. The portal vein is punctured directly and is replaced by a guidewire/catheter, and contrast material is injected into the splenic vein and/or the superior mesenteric vein, depending on the clinical setting. PTP is an easy and quick procedure. As a result of the straight course of the catheter through the liver substance, catheterization of several tributaries is possible, but the distance between the cutaneous entrance of the catheter and the liver makes catheter manipulation difficult. The few reported complications mostly result from nontarget organ puncture (gallbladder, pleura) and intra-abdominal hemorrhage. With US guidance, the incidence of nontarget organ puncture is expected to decrease.
Transcatheter obliteration of esophageal varices with various embolic agents is possible via transhepatic catheter placement, but this is not a procedure to be followed by suitable surgical procedure. Transcatheter obliteration should not be used as an elective procedure; even in an acute setting, hemostasis is best attempted with other methods.
Transumbilical catheterization
Transumbilical catheterization requires a surgical procedure in which a transverse incision is made 3–5 cm above the umbilicus, and the umbilical vein is catheterized. Complications are few, but the procedure is difficult and time consuming. With so many noninvasive procedures currently available, the procedure is seldom indicated.
Transjugular catheterization
The transjugular approach to the portal vein first was described by Rösch et al in 1969. Since then, the technique has improved; currently, it is used more for therapeutic applications, such as the establishment of a TIPS.
Wedged hepatic venography
When a catheter is placed in a small hepatic vein via the inferior vena cava (IVC) or jugular vein, pressures may be measured either with a transducer or with a saline manometer. In patients with sinusoidal or postsinusoidal portal venous obstruction, as occurs in cases of cirrhosis, pressure measured in this way accurately reflects the total portal pressure. The wedged hepatic venous pressure is the same as the splenic pulp pressure measured by use of SP. Normal portal pressure levels measured in this way are 40-150 mm of saline. Pressures above 150 mm of saline indicate PH.
Two components contribute to PH. The first is intrahepatic resistance to portal venous flow, and the second is transmitted pressure from the IVC. In addition, IVC pressures are measured, and the corrected sinusoidal pressure is derived by subtracting the IVC pressure from the wedged hepatic pressure. The corrected sinusoidal pressure is useful clinically because it reflects the true status of the liver disease responsible for development of portosystemic shunts and variceal bleeding. Corrected sinusoidal pressure readings of as high as 100 mm of saline are considered normal.
Although corrected sinusoidal pressure makes the most significant contribution to variceal bleeding in patients with cirrhosis, the total pressure usually contributes to bleeding from esophageal varices. Thus, a patient with both cirrhosis and congestive heart failure may bleed from esophageal varices because of a temporary increase in central venous pressure; conversely, esophageal bleeding may cease when the central venous pressure decreases. Typically, patients with cirrhosis do not bleed from varices with portal venous pressures of 200-250 mm of saline. Patients with cirrhosis who bleed at pressures lower than 200 mm of saline almost always bleed from an alternative source.
Arterial portography
Arterial portography (AP) is currently the preferred method of evaluating the portal venous system because it is less invasive and has a lower complication rate. AP involves the indirect opacification of the portal venous system with the injection of contrast material into the celiac axis (delayed images outline the splenic, gastric, and portal veins) or into the superior mesenteric artery (outlining superior mesenteric and portal veins).
The 3 major indications for AP include the following:
-
To perform workup in patients with PH and its sequelae, particularly when surgical treatment is planned.
-
To determine the resectability of hepatic and pancreatic tumors when both arterial- and venous-phase angiograms make significant contributions.
-
To perform transcatheter embolization, as in islet cell tumor metastases and carcinoid metastases, or to perform chemoembolization, as in hepatocellular carcinoma (demonstration of a patent portal vein is a prerequisite for these treatments).
Preparation and contraindications for AP are identical to those of standard conventional angiography. Selective catheters are used to cannulate the appropriate artery. In a superior mesenteric artery injection, the tip of the catheter is placed such that it opacifies all the branches with contrast medium. Before delivery of the contrast agent, administration of a vasodilator (tolazoline, papaverine, nitroglycerin) improves opacification of the portal vein. Manual or digital subtraction imaging improves resolution. If digital subtraction is used, administration of an anticholinergic drug before filming reduces bowel movement. Left gastric artery injection consistently demonstrates esophageal varices.
AP findings in PH include the following:
-
Arterial-phase findings: pancreatic carcinoma, hepatocellular carcinoma, pancreatitis
-
Venous-phase findings: splenic vein thrombosis, superior mesenteric vein thrombosis, portal vein thrombosis, collateral channels
Degree of confidence
Splenoportography (SP) is a fairly accurate method of outlining the portal venous system and the portosystemic communications for patients with portal hypertension; for this, SP remains the criterion standard. Diagnostic modalities such as US, CT, and MRI have reduced the diagnostic importance of arteriography. The major role of angiography is in mapping the vascular anatomy before surgery and in guiding the transcatheter treatment of liver tumors. In celiac-axis and superior angiography, the venous phase provides sufficient detail to render direct portography unnecessary in most patients.
-
Barium swallow in the left lateral decubitus position shows multiple mucosal nodules in the mid to lower esophagus. In a patient with cirrhosis, these are suggestive of esophageal varices.
-
Barium swallow in a 56-year-old man with known cirrhosis who had a recent episode of hematemesis shows thickened mucosal folds and multiple polypoid filling defects at the lower end of the esophagus. These are suggestive of varices.
-
Endoscopic findings in a 47-year-old man with a history of polycythemia rubra vera who had a recent episode of hematemesis. Endoscopy showed a normal esophagus, but multiple polypoid submucosal lesions were seen in the fundus and body of the stomach). The final diagnosis was left-sided portal hypertension secondary to splenic vein thrombosis.
-
Part of an upper gastrointestinal tract barium series (same patient as in the previous image) shows multiple polypoid filling defects within the fundus of the stomach. The final diagnosis was a left-sided portal hypertension secondary to splenic vein thrombosis.
-
Venous phase of a digital subtraction celiac-axis angiogram shows no splenic vein, but multiple collateral venous pathways are seen through the stomach wall (straight arrows), which feed a normal portal vein (curved arrows). Several varices are noted within the body of the stomach. The final diagnosis was left-sided portal hypertension secondary to splenic vein thrombosis.
-
Venous phase of a digital subtraction superior mesenteric angiogram (same patient as in the previous image) shows a normal portal vein (PV) with no streaming effect from splenic venous flow (arrow), suggestive of splenic vein thrombosis. The final diagnosis was left-sided portal hypertension secondary to splenic vein thrombosis.
-
Splenoportogram in a patient with known alcoholic cirrhosis and two episodes of variceal bleeding in the past. The procedure was performed as a prelude to surgical portosystemic shunt placement. The splenoportogram shows a dilated left gastric vein (coronary vein, CV) feeding the lower esophageal and gastric varices (arrows). Retrograde filling of the inferior mesenteric vein (I) is present, but the main portal vein flow is hepatopetal in direction.
-
Digital subtraction splenoportogram in a patient with portal hypertension shows a subcapsular contrast leak (arrows), which is a known complication of splenoportography.
-
Splenoportogram in a 3-year-old child with a history of serious febrile illness in infancy and recent hematemesis. Splenoportogram shows a thrombosed distal portal vein and a cavernous malformation at the porta hepatis (C). The arrow marks gastric and esophageal varices. The inferior mesenteric vein is outlined because of reverse flow (I).
-
CT scan through the spleen of a 43-year-old man with a known history of intravenous drug abuse and hepatitis C cirrhosis. The patient presented to the emergency department with a sudden onset of a hypotensive episode and clinical features of hepatic encephalopathy. The scan shows splenomegaly with a dilated tortuous splenic vein/varices at the splenic hilum and free peritoneal fluid. The final diagnosis was hepatitis C cirrhosis, hepatocellular carcinoma of the left hepatic lobe (which had ruptured into the peritoneum), and arterioportal shunting (which had developed inside the ruptured tumor, giving rise to severe portal hypertension).
-
CT scan through the liver (same patient as in the previous image) was not of optimal quality because of patient movement, but the attenuation in the left lobe of the liver was patchy, suggestive of a mass lesion. The final diagnosis was hepatitis C cirrhosis, hepatocellular carcinoma of the left hepatic lobe (which had ruptured into the peritoneum), and portoarterial fistula (which had developed inside the ruptured tumor, giving rise to severe portal hypertension).
-
Power Doppler sonogram through the spleen shows varices at the hilum of an enlarged spleen. The final diagnosis was hepatitis C cirrhosis, hepatocellular carcinoma of the left hepatic lobe (which had ruptured into the peritoneum), and portoarterial fistula (which had developed inside the ruptured tumor, giving rise to severe portal hypertension).
-
Duplex spectral Doppler sonogram of the portal vein (same patient as in the previous image) shows a bidirectional flow within the vein. The final diagnosis was hepatitis C cirrhosis, hepatocellular carcinoma of the left hepatic lobe (which had ruptured into the peritoneum), and portoarterial fistula (which had developed inside the ruptured tumor, giving rise to severe portal hypertension).
-
Digital subtraction selective common hepatic artery angiogram shows immediate filling of the portal venous radicles in the left lobe of the liver (straight arrow) and early filling of portal vein (curved arrow), suggestive of hepatic arterial-portal vein fistula. The final diagnosis was hepatitis C cirrhosis, hepatocellular carcinoma of the left hepatic lobe (which had ruptured into the peritoneum), and portoarterial fistula (which had developed inside the ruptured tumor, giving rise to severe portal hypertension).
-
Delayed venous phase of a selective common hepatic angiogram (same patient as in the previous image) shows the portal vein (P), with filling of the left gastric vein caused by retrograde flow feeding gastric and lower esophageal varices (arrows). Retrograde flow in enlarged umbilical veins also is seen. The final diagnosis was hepatitis C cirrhosis, hepatocellular carcinoma of the left hepatic lobe (which had ruptured into the peritoneum), and portoarterial fistula (which had developed inside the ruptured tumor, giving rise to severe portal hypertension).
-
Digital subtraction venous phase of a superior mesenteric artery angiogram (same patient as in the previous 2 images) shows retrograde flow into the left gastric vein (curved arrow) and the inferior mesenteric vein (straight arrow). Note the flow defect of the distal portal vein caused by retrograde flow (open arrowhead). The final diagnosis was hepatitis C cirrhosis, hepatocellular carcinoma of the left hepatic lobe (which had ruptured into the peritoneum), and portoarterial fistula (which had developed inside the ruptured tumor, giving rise to severe portal hypertension).
-
Conventional angiogram of the superior mesenteric artery shows a replaced hepatic artery in the right lobe of the liver in a patient with a previous history of abdominal tuberculosis and a recent history of hematemesis. Note the multiple calcific foci in the splenic region as a result of old healed tuberculous granulomas. Two previous liver biopsies had not revealed the changes of cirrhosis. The final diagnosis was tuberculous calcified lymph nodes at the porta hepatis causing portal vein stenosis by extrinsic pressure, portal hypertension, and esophageal and gastric varices.
-
Venous phase of a superior mesenteric angiogram shows a stenosis of the portal vein near the porta hepatis with poststenotic aneurysmal dilatation of the portal vein. Filling of the gastric varices and the splenic vein are seen as a result of retrograde flow (same patient as in the previous image). The final diagnosis was tuberculous calcified lymph nodes at the porta hepatis causing portal vein stenosis by extrinsic pressure, portal hypertension, and esophageal and gastric varices.
-
Intraoperative portogram shows portal vein stenosis and a portal vein aneurysm. The splenic vein is outlined because of retrograde flow (same patient as in the previous 2 images). The final diagnosis was tuberculous calcified lymph nodes at the porta hepatis causing portal vein stenosis by extrinsic pressure, portal hypertension, and esophageal and gastric varices.
-
Line diagram of findings on portal venous phase angiogram (same patient as in the previous 3 images). The superior mesenteric vein has been added for anatomic clarity. The final diagnosis was tuberculous calcified lymph nodes at the porta hepatis causing portal vein stenosis by extrinsic pressure, portal hypertension, and esophageal and gastric varices.
-
A 52-year-old man with known hepatitis B cirrhosis was found to have a hypoechoic mass in the region of the liver hilum. CT was performed for further characterization. Nonenhanced CT scan shows multiple polypoid masses at the splenic hilum (arrow), suggestive of a dilated tortuous splenic vein or varices. The final diagnosis was hepatocellular carcinoma, cirrhosis, and portal vein thrombosis/portal hypertension complicated by a spontaneous splenorenal shunt.
-
A 52-year-old man with known hepatitis B cirrhosis was found to have a hypoechoic mass in the region of the liver hilum (same patient as in the previous image). CT was performed for further characterization. Nonenhanced CT scan shows multiple polypoid masses at the splenic hilum (solid arrow), suggestive of a dilated tortuous splenic vein or varices, and the origin of a large splenic vein (open arrow). The final diagnosis was hepatocellular carcinoma, cirrhosis, and portal vein thrombosis/portal hypertension complicated by a spontaneous splenorenal shunt.
-
Contrast-enhanced axial CT (same patient as in the previous 2 images) shows a cavernous transformation at the porta hepatis (arrows) caused by portal vein thrombosis. The final diagnosis was hepatocellular carcinoma, cirrhosis, and portal vein thrombosis/portal hypertension complicated by a spontaneous splenorenal shunt.
-
Contrast-enhanced axial CT scan shows a dilated left renal vein (arrow; same patient as in the previous 3 images). The final diagnosis was hepatocellular carcinoma, cirrhosis, and portal vein thrombosis/portal hypertension complicated by a spontaneous splenorenal shunt.
-
Venous phase of digital subtraction superior mesenteric angiogram shows the portal vein to be reduced to a threadlike structure (arrow). Retrograde flow into the splenic vein (S) is seen. The final diagnosis was hepatocellular carcinoma, cirrhosis, and portal vein thrombosis/portal hypertension complicated by a spontaneous splenorenal shunt.
-
Venous phase of a digital subtraction superior mesenteric angiogram shows a shunt between the splenic vein (S) and the left renal vein (R), and the IVC (V) is outlined with contrast material. Arrows mark the tiny threadlike portal vein (same patient as in the previous image). The final diagnosis was hepatocellular carcinoma (not shown), cirrhosis, and portal vein thrombosis/portal hypertension complicated by a spontaneous splenorenal shunt.
-
Transverse sonogram of the liver in a patient with hepatitis B cirrhosis shows a coarse echo structure of the liver.
-
Sagittal oblique sonogram of the liver shows a small liver with an irregular surface, moderate ascites, and a dilated portal vein. Note the thick gallbladder wall.
-
Sagittal oblique sonogram of the liver shows a dilated portal vein (22 mm in transverse diameter) in a patient with portal hypertension.
-
End-stage liver cirrhosis showing a small liver, gross ascites, and a dilated portal vein
-
Doppler sample volume in portal vein reveals continuous venous flow without evidence of respiratory variation, consistent with a hypertensive portal venous system. Note the coarse liver echo structure and ascites.
-
Doppler sample volume in portal vein reveals bidirectional flow in the portal vein associated with portal hypertension.
-
Sagittal oblique sonogram of the liver shows several tubular structures at the porta hepatis resulting from cavernous transformation secondary to portal vein thrombosis.
-
Duplex power Doppler sonogram shows an enlarged spleen; varices are apparent at the splenic hilum.
-
Doppler sonogram at the splenic hilum reveals hepatofugal venous flow in a patient with portal hypertension.
-
Spleen in portal hypertension, with a positive splenic interface sign.
-
Color Doppler ultrasound showing pericholecystic varices.
-
Color Doppler ultrasound showing pericholecystic varices.
-
Peripancreatic varices as shown on power Doppler.
-
Peripancreatic varices as shown on power Doppler.
-
Peripancreatic and perihilar varices as shown on real-time scanner.
-
Periportal varices on power Doppler
-
Periportal varices on conventional Doppler and power Doppler
-
Periportal varices conventional Doppler and power Doppler.
-
Dilatation of umbilical vein as shown on color Doppler.