Practice Essentials
Magnetic resonance imaging (MRI) was first used to visualize multiple sclerosis (MS) in the upper cervical spine in the late 1980s. [1] Spinal MS is often associated with concomitant brain lesions; however, as many as 20% of patients with spinal lesions do not have intracranial plaques. Contrary to the white and gray matter in the brain, white and gray matter can both be affected in the spine. No strong correlation has been established between the extent of the plaques and the degree of clinical disability. [2, 3, 4, 5, 6] Spinal cord atrophy is most relevant to progressive forms of MS (primary progressive and secondary progressive), in which it closely links to physical disability. [4, 5]
MS affects as many as 350,000 individuals in the United States and commonly presents before the age of 45 years. Patients with MS, as a general population, are likely to encounter degenerative spinal changes as they age. This often poses a unique challenge for both patients with MS and physicians, as degenerative spinal disorders and MS can show a great deal of symptomatic overlap despite stark differences in recommended management approaches. [7]
MRI is currently considered to be the most sensitive diagnostic imaging modality for revealing demyelinating plaques, as recommended by the Consortium of Multiple Sclerosis Centers. [8] No specific field strength is recommended. Gadolinium is typically favored. MRI shows abnormalities in 95% of patients with clinically definitive MS. [9, 10]
On long TR sequences, MRI scans show areas of demyelination as high-signal areas. Lesions of other etiologies (eg, viral myelitis, acute disseminated encephalomyelitis [ADEM]) may resemble MS plaques and must be considered along with the clinical history and the patient's presenting signs and symptoms.
According to an international group of neurologists and radiologists, the spinal cord MR imaging protocol for MS should include sagittal T1-weighted and proton attenuation, STIR (short-TI invervsion recovery) or phase-sensitive inversion recovery, axial T2- or T2*-weighted imaging through suspicious lesions, and, in some cases, postcontrast gadolinium-enhanced T1-weighted imaging. [11]
Some studies have shown that proton density (PD)–weighted images (WIs) are superior to T2 WIs in detecting MS lesions (plaques) in the spinal cord. Processed images of the fused images (PD/T2) have shown superior diagnostic sensitivity for MS lesions in the cervical spine when compared to PD images alone. [12]
Spinal cord infarction (SCI) is difficult to diagnose because it is rare, its cause is unknown, and diagnostic criteria have not been established. Researchers have found that a diffusion-weighted sequence of spine MRI may be helpful in the diagnosis of acute to subacute phase SCI and in differentiating this condition from acute MS. [13]
(See the image below).
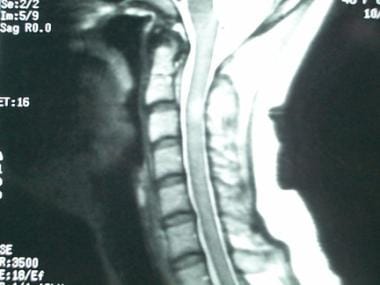 Sagittal, T2-weighted magnetic resonance image of the cervical spinal cord in a woman aged 27 years showing a fusiform area of increased signal intensity representing a multiple sclerosis plaque.
Careful review of the patient's medical history and an evaluation of the brain with MRI can prove helpful in the diagnosis, especially in young females. MS is considered to be the most common demyelinating process involving the central nervous system (CNS). [14, 15]
Imaging plays an important role in MS, as noted in the McDonald Criteria (see Table 1). It is important to note that the McDonald Criteria were largely collected from adult white European and North American populations. MRI is used to demonstrate lesion dissemination in time (DIT) and space (DIS). [16, 17, 18, 19]
Table 1. McDonald Criteria (Open Table in a new window)
| Number of lesions with objective clinical evidence | Additional data needed for a diagnosis of MS | |
| ≥2 clinical attacks | ≥2 | none |
| ≥2 clinical attacks | ≥1 (as well as clear-cut historical evidence of a previous attack involving a lesion in a distinct anatomic location) |
none |
| ≥2 clinical attacks | 1 | Dissemination in space demonstrated by an additional clinical attack implicating a different CNS site or by MRI |
| 1 clinical attack | ≥2 | Dissemination in time demonstrated by an additional clinical attack or by MRI OR demonstration of CSF-specific oligoclonal bands |
| 1 clinical attack | 1 | Dissemination in space demonstrated by an additional clinical attack implicating a different CNS site or by MRI AND dissemination in time demonstrated by an additional clinical attack or by MRI OR demonstration of CSF-specific oligoclonal bands. |
If the McDonald Criteria are fulfilled and there is no better explanation for the clinical presentation, the diagnosis is multiple sclerosis. If multiple sclerosis is suspected by virtue of a clinically isolated syndrome but the McDonald Criteria are not completely met, the diagnosis is possible multiple sclerosis. If another diagnosis arises during the evaluation that better explains the clinical presentation, the diagnosis is not multiple sclerosis.
Other aspects of the McDonald Criteria include the following:
-
Brain stem and cord lesions can be counted among the 2 lesions disseminated in space and time.
-
CSF oligoclonal bands can be used to substitute for demonstration of dissemination in time in some settings.
-
Both asymptomatic and symptomatic MRI lesions can be considered in determining dissemination in space (optic nerve lesions are still excluded).
-
Cortical lesions have been added to juxtacortical lesions as determinant for dissemination in space.
Radiologically isolated syndrome
Radiologically isolated syndrome (RIS) describes cases in which McDonald imaging criteria meet DIT and DIS but lack corresponding clinical symptoms. The exact significance is still a subject of debate. Some authors suggested that this could represent a stage preceding clinical isolated syndrome (CIS). In an extensive review of the RIS literature, Granberg et al [20] emphasized that approximately two thirds of cases show radiologic progression and one third develop clinical symptoms at 5-year follow-up. They also point out that clinical conversion is more likely when cervical cord lesions are present. However, further studies are needed to determine patient stratification and define the role of disease-modifying drugs in RIS.
Computed Tomography
Because computed tomography (CT) scanning has poor sensitivity, the detection, evaluation, and characterization of MS lesions and enhancement patterns are limited with this modality. As a result, with the advancement of MRI, evaluation of the spinal cord using axial CT scanning was abandoned.
On CT scans, large, masslike lesions can occasionally mimic a neoplasm, and characterizing them can be difficult. Primary and secondary neoplasms of the spinal cord (astrocytomas, ependymomas), infection, transverse myelitis, acute infarction, sarcoidosis, and systemic lupus erythematosus may mimic demyelinating MS plaques on CT scans.
Magnetic Resonance Imaging
MRI far exceeds CT scanning in the ability to demonstrate intramedullary pathology; MRI is used as the first-line investigation of spinal MS. [21] Depending on their age, MS plaques appear on unenhanced, T1-weighted images as areas of slightly low to low signal intensity. Spinal plaques may appear as nodules, rings, or arcs and generally are less than 2 vertebral bodies in length. [22] Plaques usually demonstrate prompt enhancement after the administration of a gadolinium-based contrast agent, which most often indicates active disease. [23] The enhancement may last 2-8 weeks. Classic chronic lesions do not demonstrate contrast enhancement. (See the image below.)
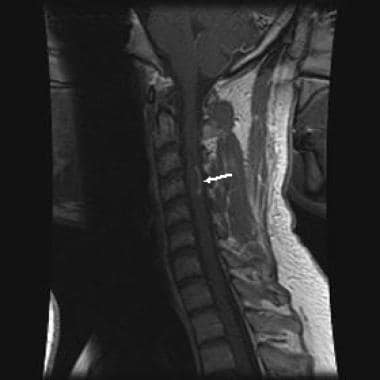 Sagittal, T1-weighted image following gadolinium contrast showing arciform enhancement along the edge of the plaque, typical of demyelination.
Most MS plaques appear hyperintense on T2-weighted images. The spinal cord may or may not be focally enlarged. Enlargement of the cord is usually seen with active disease. Larger active lesions may have extensive edema with associated cord expansion. Chronic lesions often demonstrate focal cord atrophy. Spinal lesions usually coexist with more severe concomitant brain plaques. As many as 20% of spinal MS lesions are isolated. Spinal cord narrowing due to atrophic changes is present in 10% of patients with spinal cord involvement. [24]
(See the images below.)
Sagittal, T2-weighted magnetic resonance image of the cervical spinal cord in a woman aged 27 years showing a fusiform area of increased signal intensity representing a multiple sclerosis plaque.
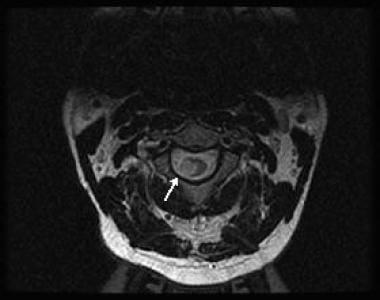
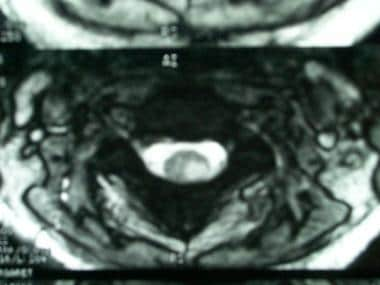 Axial, T2-weighted magnetic resonance image in a woman aged 27 showing a multiple sclerosis plaque located in the left dorsolateral region of the left hemicord.
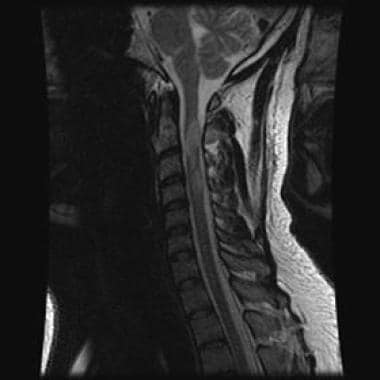 Sagittal, T2-weighted image showing areas of signal hyperintensity in the cervical spinal cord and pons.
 Axial, T2-weighted image showing a large area of signal hyperintensity in the right lateral aspect of the cord.
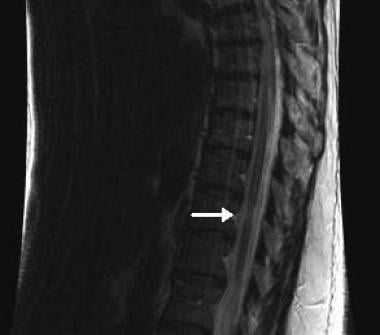 Sagittal, T2-weighted image showing a focal area of spinal cord atrophy in a patient with long-standing multiple sclerosis.
Tumefacient MS may mimic a neoplasm; a demyelinating process should always be considered if a masslike lesion is encountered. As is the case in the brain, a ring or arc of enhancement can often be found, as opposed to a more nodular or masslike enhancement. Follow-up studies are helpful.
Although not widely implemented, newer methods may be more specific in evaluating MS plaques. [25] These methods include magnetization transfer and diffusion, as well as proton MR spectroscopy (MRS). [26, 27, 28]
Typically, fast-FLAIR (fluid-attenuated inversion recovery) sequences have been shown to have a lower sensitivity than do fast spin-echo sequences (FSE) for depicting spinal cord MS lesions. [29, 30, 31]
Studies have suggested that more cervical cord MS lesions can be revealed with magnetization transfer–prepared gradient-echo and fast-STIR (short TI inversion recovery) sequences than with FSE sequences, with fast-STIR demonstrating the greatest sensitivity. [30, 32, 33, 34, 35]
In one study, 3.5-mm axial T2-weighted images with full spinal cord coverage showed 22% more lesions in patients with MS than 3-mm sagittal scans, especially for lesions with small axial diameters. In the study, 449/509 lesions (88.2%) were detected on 3.5-mm axial scans, and 337/509 (66.2%) on 3-mm sagittal scans. Only 277/449 (61.7%) axial lesions were also detected on sagittal images. [2]
Fluid and white matter suppression (FLAWS) allows synthetic imaging with amplified contrast and has showed high potential for imaging of the brain in patients with MS. A randomized, controlled trial by Emorine et al reported that imaging with compressed-sensing (CS)-FLAWS enabled improved cervical spinal cord exploration in patients with MS. [36]
In a retrospective, case-control study, by Chhugani et al, of 56 patients with progressive MS and 55 age- and sex-matched controls who underwent MRI, moderate-to-severe cervical spinal degeneration was found to occur more frequently in patients with progressive MS. In addition, foraminal stenosis was 3 times more likely to occur in patients with progressive MS than in controls and was twice as likely to occur in patients with progressive MS than in patients with relapsing-remitting MS. [37]
Gadolinium-based contrast agents have been linked to the development of nephrogenic systemic fibrosis (NSF), also known as nephrogenic fibrosing dermopathy (NFD). The disease has occurred in patients with moderate to end-stage renal disease after being given a gadolinium-based contrast agent to enhance MRI or MR angiography (MRA) scans. NSF/NFD is a debilitating and sometimes fatal disease. Characteristics include red or dark patches on the skin; burning, itching, swelling, hardening, and tightening of the skin; yellow spots on the whites of the eyes; joint stiffness with trouble moving or straightening the arms, hands, legs, or feet; pain deep in the hip bones or ribs; and muscle weakness.
Differentials
The main differentials include, but are not limited to, the following:
-
Primary or metastatic spinal cord neoplasms, such as astrocytomas and ependymomas
-
Sarcoidosis
-
Transverse myelitis
-
Infarct
-
Radiation myelitis
The presence of cysts and hemorrhage support the diagnosis of a neoplasm. ADEM may show enhancement. The concomitant presence of brain lesions is the rule. ADEM typically runs a monophasic course; therefore, it does not have the relapsing course of MS. A history of viral infection within the previous 3-4 weeks should alert the radiologist.
Sarcoidosis involves the CNS in approximately 5% of cases. Concomitant pial involvement is frequently encountered. Enhancement is usually the rule.
The term transverse myelitis is usually used for idiopathic inflammatory myelopathy. Cord swelling and enhancement may be present, often involving a longer segment than does MS. MRI of the brain may be helpful for showing additional lesions in cases of MS or ADEM. Transverse myelitis usually responds to steroid therapy; therefore, a treatment trial is often considered before proceeding with biopsy. This process is typically monophasic.
Infarct is more common at the thoracic level. Usually, only a single lesion is present. Contrast may be present, although this is not the dominant feature. Signal alteration usually and initially involves the anterior gray matter (anterior spinal artery distribution). The patient's clinical presentation will be acute. Particularly consider the possibility of an infarct if the patient is older and/or has a history of aortic/vascular surgery.
Processes such as systemic lupus erythematosus can result in spinal lesions that mimic MS. Often, multiple lesions are present. However, the clinical history is often known and can help establish the correct diagnosis.
Generally, doses higher than 4000 cGy are required to cause radiation myelitis. The latency period is 1-3 years. Chemotherapy may be synergistic. Images may show some peripheral enhancement.
Arteriovenous fistula usually occurs at the thoracolumbar level, and patients are usually older than 50 years, with a long history of back pain. The cord signal abnormality can involve a very long segment. Look for a serpiginous flow void along the cord surface.
Questions & Answers
Overview
What is the role of MRI in the workup of multiple sclerosis (MS)?
What are the McDonald diagnostic criteria for multiple sclerosis (MS)?
What is the role of CT scanning in the workup of multiple sclerosis (MS)?
Which findings on MRI suggest multiple sclerosis (MS)?
Which conditions are included in the differential diagnoses of multiple sclerosis?
How are spinal neoplasms differentiated from multiple sclerosis?
How is acute disseminated encephalomyelitis (ADEM) differentiated from multiple sclerosis?
How is sarcoidosis differentiated from multiple sclerosis?
How is transverse myelitis differentiated from multiple sclerosis?
How is infarct differentiated from multiple sclerosis?
How is vasculitis differentiated from multiple sclerosis?
How is radiation myelitis differentiated from multiple sclerosis?
How is arteriovenous fistula differentiated from multiple sclerosis?
-
Sagittal, T2-weighted magnetic resonance image of the cervical spinal cord in a woman aged 27 years showing a fusiform area of increased signal intensity representing a multiple sclerosis plaque.
-
Axial, T2-weighted magnetic resonance image in a woman aged 27 showing a multiple sclerosis plaque located in the left dorsolateral region of the left hemicord.
-
Sagittal, T2-weighted image showing areas of signal hyperintensity in the cervical spinal cord and pons.
-
Axial, T2-weighted image showing a large area of signal hyperintensity in the right lateral aspect of the cord.
-
Sagittal, T1-weighted image following gadolinium contrast showing arciform enhancement along the edge of the plaque, typical of demyelination.
-
Gadolinium-enhanced, T1-weighted image showing enhancement of the left optic nerve (arrow).
-
Axial image of the spinal cord showing enhancing plaque (arrow). (Same patient as in the previous image.) The combination of optic neuritis and spinal cord lesion constitutes Devic neuromyelitis optica.
-
Sagittal, T2-weighted image showing a focal area of spinal cord atrophy in a patient with long-standing multiple sclerosis.
Tables
| Number of lesions with objective clinical evidence | Additional data needed for a diagnosis of MS | |
| ≥2 clinical attacks | ≥2 | none |
| ≥2 clinical attacks | ≥1 (as well as clear-cut historical evidence of a previous attack involving a lesion in a distinct anatomic location) |
none |
| ≥2 clinical attacks | 1 | Dissemination in space demonstrated by an additional clinical attack implicating a different CNS site or by MRI |
| 1 clinical attack | ≥2 | Dissemination in time demonstrated by an additional clinical attack or by MRI OR demonstration of CSF-specific oligoclonal bands |
| 1 clinical attack | 1 | Dissemination in space demonstrated by an additional clinical attack implicating a different CNS site or by MRI AND dissemination in time demonstrated by an additional clinical attack or by MRI OR demonstration of CSF-specific oligoclonal bands. |