Practice Essentials
Aortic regurgitation (AR) affects 10% of all patients with valvular heart disease. AR is characterized by an abnormal backward leakage of blood from the aorta into the left ventricle (LV) during the diastolic phase of the cardiac cycle. The disease process may involve the aortic valve cusps and/or the aortic root. Most cases of aortic regurgitation are secondary to an aortic syndrome resulting from atherosclerotic aortic root dilatation or aortopathy that can coexist in patients with a bicuspid aortic valve. In chronic aortic regurgitation, the left ventricle increases diastolic volume to accommodate the aortic regurgitation, which results in increased diastolic wall stress. Systolic pressure, afterload, and systolic wall stress increase because the left ventricle must eject a greater stroke volume over the same systolic ejection period. The volume and pressure overload cause left ventricular dilatation, eccentric left ventricular hypertrophy, and increased interstitial fibrosis. These are progressive as the severity of aortic regurgitation increases, which can lead to heart failure and death. [1, 2, 3]
Clinically, aortic regurgitation manifests itself in a wide variety of ways; it may be recognized in association with an asymptomatic heart murmur on physical examination, or it may manifest itself in symptoms of substantial LV dysfunction and heart failure.
An enlarged cardiac silhouette is often the hallmark of a patient with significant aortic regurgitation. As aortic regurgitation becomes more severe, LV enlargement ensues, mainly in the transverse and caudal directions, leading to an increase in the cardiothoracic ratio. A cardiothoracic ratio in excess of 0.60 is associated with a diminished survival rate. Dilatation of the aorta, as well as aortic valvular calcification, is occasionally seen.
Rheumatic heart disease is the most common cause of severe aortic regurgitation. Over the past several decades, however, the frequency of aortic-root diseases as a cause of aortic regurgitation has increased.
The diagnosis of aortic regurgitation may be established through any of a number of noninvasive techniques. [4] Echocardiography has emerged as the most important imaging modality in the diagnosis of aortic regurgitation; three-dimensional (3D) echocardiography is useful in determining the causes and severity of aortic regurgitation, as well as in making decisions regarding management strategy. [3] Handheld echocardiographic devices (HEDs) are increasingly being used in clinical settings to screen high-risk populations for LV disease. [5]
Transthoracic echocardiography (TTE) is considered the noninvasive gold standard for quantifying aortic valve regurgitation. Severity can also be evaluated by estimating the regurgitant fraction by flow measurement in the ascending aorta using cardiovascular magnetic resonance imaging (CMR). In addition, regurgitant fraction (RF) can be estimated by Doppler examination of the left subclavian artery (LSA-Doppler). [6, 7, 8, 9] A study of severity of aortic regurgitation in 73 patients by Spampinato et al demonstrated that the quantitative RF values for AR grading using proximal isovelocity surface area (PISA) method, LSA-Doppler, and CMR correlated well with each other but differed in groups with mild and moderate AR when using a recognized multiparametric echocardiographic approach. [6]
The radiologic characteristics of aortic regurgitation are demonstrated in the images below. [10, 11]
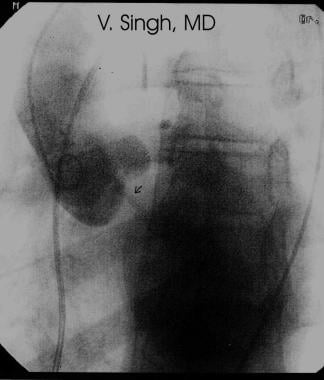 Aortic regurgitation. Aortic-root angiography shows regurgitation of contrast material into the left ventricle (LV).
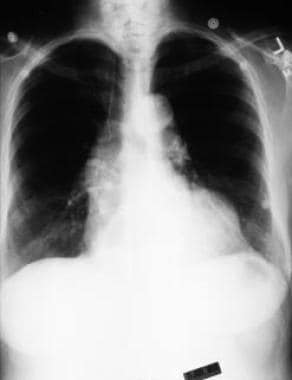 Aortic regurgitation. Chest radiograph in a patient with aortic dissection and acute aortic regurgitation shows a cardiac silhouette of essentially normal dimension.
Preferred examination
Two-dimensional (2D) transthoracic, color, and Doppler echocardiography have become preferred imaging techniques in the diagnosis and assessment of aortic regurgitation. With these modalities, the disease may be identified, and the severity and (in many instances) the etiology may be determined with high sensitivity and specificity. In addition, analysis of the LV function and end-diastolic dimension may be used to determine the optimal timing of valve surgery. [12, 13, 14] Severity can also be evaluated by estimating the regurgitant fraction by flow measurement in the ascending aorta using cardiovascular magnetic resonance imaging (CMR). In addition, regurgitant fraction (RF) can be estimated by Doppler examination of the left subclavian artery (LSA-Doppler). [6, 7, 8, 9]
Cardiac computed tomography (CT) scanning and magnetic resonance imaging (MRI) have not yet achieved widespread adoption in the management of aortic regurgitation, although support in the literature is increasing for the potential clinical use of these imaging techniques. [15]
Some studies have shown the validity of 4D flow MRI when compared with echocardiography and 2D phase-contrast MRI. [16, 17, 18, 19]
Harris et al noted that cardiac magnetic resonance-derived regurgitant volume was more predictive of clinical outcomes than that derived by transthoracic echocardiography in patients with aortic regurgitation, whereas the 2 imaging modalities demonstrated similar performances for patients with mitral regurgitation. Regurgitant volume greater than 50 mL on cardiac magnetic resonance identified those with aortic regurgitation at high risk, with 50% undergoing valve surgery, compared to 0% in those whose regurgitant volumes were 50 mL or less. [20]
Radioisotope studies may occasionally be used to quantify the severity of aortic regurgitation. Likewise, the LV function may be assessed. Determination of preexercise and postexercise LV ejection fraction (LVEF) may often show a failure of the ejection fraction to increase during exercise; this is an indicator of early LV dysfunction. Generally, echocardiography, which has demonstrated reasonable reliability, has come to replace these tests.
Cardiac catheterization is used mainly for evaluating concomitant coronary artery disease before surgery. Noninvasive techniques have supplanted angiocardiography for the evaluation of aortic regurgitation.
Limitations of techniques
Chest radiographic findings of an increase in the cardiothoracic ratio may aid in the diagnosis of aortic regurgitation, but such findings alone cannot be used to make a diagnosis.
Echocardiography is pivotal to making the diagnosis of aortic regurgitation, as well as in determining its severity and the timing of surgery. Limitations, which are minimal, may include poor acoustic windows. Findings may be equivocal for determining the onset of LV dysfunction, in which case a radioisotope technique may be helpful. Certain patients may need to undergo cardiopulmonary exercise testing to determine the optimal time for valve replacement.
Radiography
The size of the heart is represented by the size of the cardiac shadow or silhouette on the chest radiograph (see the image below). In patients with chronic aortic regurgitation, the size of the heart depends on the severity and duration of the regurgitation. Radiographic findings are nonspecific for aortic regurgitation.
In patients with aortic regurgitation, chest radiographs show cardiac enlargement, as manifested by an increase in the cardiothoracic ratio (ie, the diameter of the cardiac shadow divided by the diameter of the thoracic cavity). The LV is enlarged laterally and inferiorly. Therefore, the vertical diameter increases more prominently than the horizontal diameter. The left atrium may also be enlarged.
Dilatation of the aortic root may be seen as well. In some patients with combined aortic stenosis and regurgitation, aortic valvular calcification may also be present. Linear calcifications in the wall of the ascending aorta may be seen in cases of syphilitic aortitis.
Aortic regurgitation. Chest radiograph in a patient with aortic dissection and acute aortic regurgitation shows a cardiac silhouette of essentially normal dimension.
Magnetic Resonance Imaging
Magnetic resonance imaging (MRI) may be a valuable tool in the assessment of aortic regurgitation. MRI may be used if echo windows are poor. For instance, the lung may block echo views, and aortic-root calcifications may produce echo image artifacts. Aortic regurgitation is easily detected with MRI by use of gradient recalled echo (GRE; FIESTA) sequences; regurgitation may be accurately quantified by use of dynamic 2D phase contrast. This method creates a series of images at the level of the aortic root that show the direction and speed of blood movement throughout the cardiac cycle.
The forward and regurgitant volumes may be calculated more accurately with MRI than with ultrasonography to compute regurgitant volume and regurgitant fraction. In patients with aortic regurgitation, MRI may be helpful in cases in which the Doppler echocardiographic results are insufficient or are not consistent with the clinical data. [21, 22, 23, 24]
Some studies have shown the validity of 4D flow MRI when compared with echocardiography and 2D phase-contrast MRI. [16, 17, 18, 19]
Pulse sequences
Advances in MRI computer technologies have enabled the use of many pulse sequences for cardiac imaging. The 2 main pulse sequences may be classified as dark-blood and bright-blood techniques. In the dark-blood techniques, such as spin-echo (SE) and fast SE (FSE) imaging, the fast-flowing blood is black and of low intensity. This method is principally useful for delineating the structure of cardiac chambers and the lumens of blood vessels. In contrast, the bright-blood techniques, such as GRE sequences, depict flowing blood as white and of high intensity. This method can be used to determine gradients and flows.
In some cases, the cause of the regurgitation may be inferred by examining SE images. Examples include aortoannular ectasia, aortic dissection, and endocarditis. Certain structural changes related to valvular regurgitation, such as LV enlargement, may also be demonstrated on SE images.
Blood has high signal intensity on cine GE images. An abnormal flow pattern caused by aortic regurgitation creates dephasing of the spins in a voxel, causing signal loss, or flow void. This is better demonstrated with longer echo time (TE).
Cine GE images enable quantitative assessment of aortic regurgitation on the basis of the area and the length of the signal void. Aortic regurgitation is best seen on a coronal plane as a signal void extending from the aortic valve into the LV during diastole. Fast cine GE imaging may be used to measure ventricular and stroke volumes and to calculate the regurgitant fraction (regurgitant volume divided by LV stroke volume).
Imaging planes
The imaging planes for MRI of the thorax are the 3 orthogonal planes: transverse, sagittal, and coronal. Because the cardiac axes are not parallel to the body axes, planes parallel and orthogonal to cardiac axes (short axis and long axis of the heart) are used for cardiac imaging.
Velocity-encoded MRI
Velocity-encoded MRI is the best way to calculate LV and right ventricular stroke volumes and to quantify the aortic regurgitant fraction. This technique may be used to measure the blood flow in the ascending aorta and the pulmonary artery or to display phase shift. Fixed areas appear gray, whereas blood flow in a forward and a backward direction along a flow-encoding axis appears bright and dark, respectively. These findings permit the estimation of antegrade and retrograde flow, which may also be color coded.
Curves of flow versus time during cardiac cycle are then plotted. The area of the curve beneath the baseline indicates the regurgitant volume; the area above the baseline represents the stroke volume. The regurgitant fraction may then be calculated.
Degree of confidence
Cine GE images with measurements such as the area and depth of signal void provide only a semiquantitative assessment of the severity of aortic regurgitation. The signal void is generally traced manually; it may vary, depending on the image display settings. This method has limitations, because the display of signal void may vary, inasmuch as it is affected by the difference in TE, display parameters, and even physiologic factors, such as variance in LV volume and pressure. Cine GE is not a determinant of MRI confidence.
Two-dimensional phase-contrast analysis does not rely on the assumptions commonly used with echo Doppler study, and it produces reliable, model-independent measurements. However, arrhythmias, electrocardiographic gating problems, and obesity may reduce MRI quality. Good-quality MRI offers a high degree of confidence, but with gating or other problems, the confidence level may be low.
False positives/negatives
There is essentially never a false-positive MRI. The display of the signal void on cine GE images depends on several technical parameters, such as display parameters (including window level and window width); flip angle; and, most importantly, the TE. With a short TE, the signal void may even disappear, whereas with a long TE, it tends to show up well. This dependency must be taken into account, and the TE should be kept long. One way to decrease the acquisition time by a factor of 2 or 3 is to use segmentation of k space, depending on the heart rate.
Two-dimensional phase-contrast imaging may produce a false-negative result if the parameters are set incorrectly (few temporal bins, low velocity sensitivity, or velocity aliasing) or if gating is poor. Simple GE imaging may produce a false-negative result if MRIs are acquired with only a short TE, but this is much less of an issue with GRE.
Ultrasonography
Echocardiography is generally the most important diagnostic imaging study for evaluating patients with aortic regurgitation. The presence or absence of regurgitation is reliably established by means of Doppler echocardiography. However, quantification of the severity is difficult, and it requires integration of several M-mode, 2D, and Doppler indices; no one index alone has proved reliable. [12, 14, 24, 25, 26, 27, 28]
The degree of confidence is high. In the assessment of the severity of aortic regurgitation with color-flow Doppler techniques, the measurements depend on imaging the jet in its minor axis. An eccentric jet that crosses across the outflow tract results in a finding that is disproportionate to the jet's true dimension. Transesophageal echocardiography often provides more accurate visualization of the true direction and size of the regurgitant jet. Doppler echo imaging may produce a false-positive result if a continuous Doppler wave, a side lobe, or a distant multiple pulsed wave picks up a similar flow pattern (eg, from a resistive ventricular septal defect). Doppler echo ultrasonography may produce a false-negative result if the valve is not studied thoroughly at varied angles and if the regurgitant jet is angulated or is off-center (as may occur, for example, from a leaflet perforation).
(See the images below.)
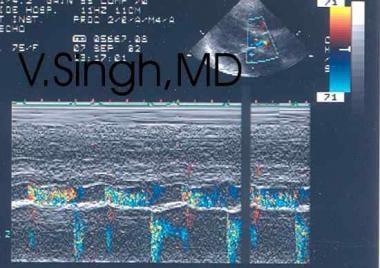
 Aortic regurgitation. Doppler echocardiographic signals may be reviewed to evaluate the severity of disease.
M-mode echocardiography
M-mode echocardiography shows diastolic fluttering of the anterior mitral leaflet (AML), which is a finding of diagnostic significance. It results from the aortic regurgitation jet hitting the AML, and it may be seen in cases of aortic regurgitation of even mild degree.
In severe cases, the AML may fully close from the impact of the jet; this finding may serve as an indication for valve surgery. Diastolic flutter of the interventricular septum may also be seen in some patients. Aortic root and LV dimensions are increased. M-mode echocardiography may show systolic anterior motion of the anterior mitral valve leaflet or chordae.
2D echocardiography
The structural integrity of the aortic valve leaflet, the LV outflow tract, and the aortic root may be examined in detail in several planes by means of 2D transthoracic echocardiography (TTE). [6, 7] Often, the cause of aortic regurgitation may be determined from these images. For example, the presence of aortic valve vegetation, a flail aortic leaflet, aortic cusp retraction and shortening, or aortic root abnormalities are discernible with reasonable ease. Determination of LV dimensions and systolic function is central to the decision regarding the timing of surgery.
Some of the echocardiographic indices that represent indications for surgery include dilatation of the LV beyond 70 mm in diastole or beyond 55 mm in systole; a fractional shortening of less than 25%; and progressive dilation of the LV of 1.0 cm or more over a 12-month period.
Color-flow imaging
Aortic regurgitation may be quantified in terms of its severity by color-flow and Doppler echocardiography. Color-flow imaging may display the regurgitant jet in various planes. Whereas the size and depth of the jet is only poorly correlated with the severity of aortic regurgitation, measurement of the width or the cross-sectional area of the regurgitant jet as a ratio of the total width or cross-sectional area of the outflow tract is more reliable.
Aortic regurgitation may be classified as mild, moderate, or severe on the basis of whether the width of the regurgitant jet occupies less than 20%, 20-40%, or more than 40% of the total width of the LV outflow tract, respectively. Another way of estimating the severity of regurgitation is by examining the regurgitant color-flow Doppler jet, which involves measuring the linear distance the jet travels into the LV cavity, or by mapping the area of the color jet.
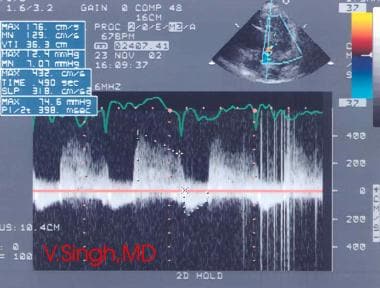
Continuous-flow Doppler echocardiography
By using continuous-wave Doppler imaging from the apex, the actual velocity of the regurgitant flow may be recorded. A relatively flat slope of velocity and pressure decay indicates mild aortic regurgitation, whereas a steep slope of velocity decay over the diastolic pressure curve (rapid deceleration or short pressure half-time) indicates severe disease.
A pressure half-time value of the aortic regurgitation jet of greater than 450 ms indicates mild regurgitation; one less than 250 ms indicates severe regurgitation. Often, the continuity equation may be used to calculate the regurgitant volume.
Retrograde flow should be assessed in the descending aorta. Small, retrograde, early diastolic signals are normal in the descending thoracic or abdominal aorta. However, any degree of holodiastolic retrograde flow indicates severe aortic regurgitation.
Pulsed wave Doppler echocardiography
Pulsed wave (PW) Doppler echocardiography can be used in the descending aorta (DAO) to assess aortic regurgitation severity. [29]
Nuclear Imaging
Radioisotope techniques, especially first-pass multiple-gated acquisition (MUGA) scanning, may be used to determine the LVEF. Such techniques may also be used to assess the severity of aortic regurgitation.
In patients who are minimally symptomatic or asymptomatic, an evaluation of LVEF before and after dynamic exercise may provide valuable clues regarding the onset of the early stages of LV dysfunction. In patients in whom myocardial dysfunction begins to develop, the ejection fraction does not increase after exercise.
The degree of confidence is moderate. Often, patients have LV dysfunction, but the studies may not show that the ejection fraction does not increase during exercise.
Angiography
Invasive evaluation of moderate to severe degrees of aortic regurgitation may be indicated when clinical deterioration appears to have begun, as evidenced by progressive symptoms, by an increase in the cardiothoracic ratio on the chest radiograph, by ST-T changes on electrocardiography, and by a fractional shortening of less than 25% on the echocardiogram in conjunction with an end-diastolic LV diameter of more than 7 cm. Angiography helps determine the presence of concomitant coronary artery disease, which may be found in 20% of patients. Regurgitation of contrast material is shown in the angiogram below. [30]
Aortic regurgitation. Aortic-root angiography shows regurgitation of contrast material into the left ventricle (LV).
Hemodynamic arterial tracings typically show greatly increased pulse pressure. In cases of severe aortic regurgitation, the aortic and LV pressures tend to equalize at end diastole. A regurgitant fraction may be calculated by using green dye. A regurgitant fraction under 0.3 represents mild regurgitation, whereas a fraction over 0.5 represents severe regurgitation. An overall LVEF of less than 50% is of prognostic value; such a finding has been found to be predictive of greater postoperative mortality and of failure to recover cardiac pump function.
Degree of confidence
The degree of confidence is high. However, in the current era of thorough echocardiographic evaluation, the need for cardiac catheterization has diminished tremendously. Often, the only indication for performing catheterization in patients with chronic aortic regurgitation is the need to rule out the presence of significant coronary stenosis in patients older than 40 years.
False-positive and false-negative results are infrequent. A false-positive result may occur because of ectopy or because of the catheter's interfering with valve closure. A false-negative result may occur because of ectopy and/or outflow tract obstruction.
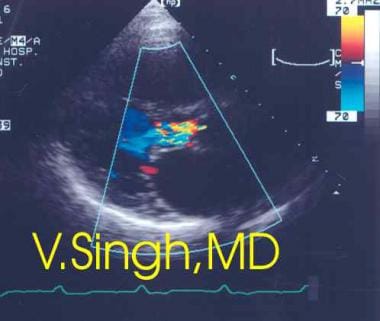
-
Aortic regurgitation. Color Doppler echocardiogram.
-
Aortic regurgitation. Doppler echocardiographic signals may be reviewed to evaluate the severity of disease.
-
Aortic regurgitation. Two-dimensional (2D) color Doppler echocardiography.
-
Aortic regurgitation. Aortic-root angiography shows regurgitation of contrast material into the left ventricle (LV).
-
Aortic regurgitation. Chest radiograph in a patient with aortic dissection and acute aortic regurgitation shows a cardiac silhouette of essentially normal dimension.