Practice Essentials
Alzheimer disease (AD) is biologically defined by the presence of β-amyloid–containing plaques and tau-containing neurofibrillary tangles. AD is a genetic and sporadic neurodegenerative disease that is a common cause of cognitive impairment acquired in midlife and in late life, but its clinical impact is modified by other neurodegenerative and cerebrovascular conditions. Researchers are struggling to find targets within this framework that can substantially change the clinical course in persons with AD. [1]
Although diagnosing dementia is largely a clinical endeavor, neuroimaging plays an increasingly important role in accurately determining the underlying etiology, which extends beyond its traditional role in excluding other causes of altered cognition. New neuroimaging methods not only facilitate diagnosis of the most common neurodegenerative conditions (particularly AD) after symptom onset but also show diagnostic promise even at very early or presymptomatic phases of the disease. [2]
Alzheimer disease is diagnosed via clinical, neuropsychological, and neuroimaging assessments. Routine structural neuroimaging evaluation has long been based on nonspecific features such as atrophy, which is a late feature in the progression of the disease. A variety of imaging modalities, including structural and functional magnetic resonance imaging (MRI) and positron emission tomography (PET) studies of cerebral metabolism, have shown characteristic changes in the brain of patients with Alzheimer disease in prodromal and even presymptomatic states. [3, 4, 5]
Alzheimer disease was first described in 1907 by Alois Alzheimer. Although it was regarded as a rare disease when it was first described, Alzheimer disease has become one of the most common diseases in the aging population, ranking as the fourth most common cause of death. Alzheimer disease is a progressive neurodegenerative disorder characterized by gradual onset of dementia. Pathologic hallmarks of the disease include beta-amyloid (Aβ) plaques, neurofibrillary tangles (NFTs), and reactive gliosis. [6, 7, 8]
(See the images below.)
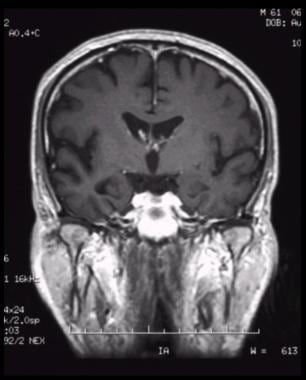 Coronal, T1-weighted magnetic resonance imaging (MRI) scan in a patient with moderate Alzheimer disease. Brain image reveals hippocampal atrophy, especially on the right side.
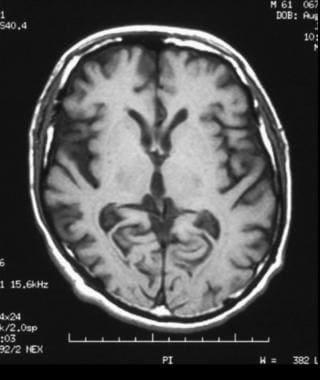
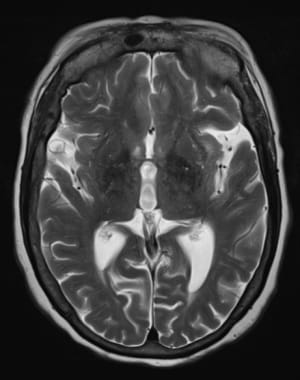 Axial, T2-weighted magnetic resonance imaging (MRI) scan reveals atrophic changes within bilateral temporal lobes with prominence of the sylvian fissures.
Imaging modalities
Structural imaging, preferably with MRI when possible and with computed tomography (CT) when not, should be performed as a first-tier approach. MRI can be considered the preferred neuroimaging examination for Alzheimer disease because it allows accurate measurement of the 3-dimensional (3D) volume of brain structures, especially the size of the hippocampus and related regions. Second-tier imaging with molecular methods, preferably with fluorodeoxyglucose positron emission tomography (FDG-PET) (or single-photon emission CT [SPECT] if PET is unavailable), can provide greater diagnostic specificity. [9, 10]
Neuroimaging is widely believed to be generally useful for excluding reversible causes of dementia syndrome such as normal-pressure hydrocephalus, brain tumor, and subdural hematoma, and for excluding other likely causes of dementia such as cerebrovascular disease. [5]
Practice parameters for diagnosis and evaluation of dementia, as published by the American Academy of Neurology (AAN), consider structural brain imaging to be optimal. [11, 12] Nonenhanced CT scanning and MRI are appropriate imaging methods. [9] The AAN suggests that neuroimaging may be most useful for patients with dementia characterized by early onset or an unusual course.
The dopamine transporter (DaTScan) is used to distinguish Lewy body dementia from Alzheimer disease. Numerous studies are under way to identify specific imaging markers for different types of dementia, including cerebral volumetric measurements, diffusion imaging, spectroscopy, very-high-field MRI scans of senile plaques, and PET scan markers of senile plaques. [13]
Neurovascular dysfunction, including blood-brain barrier (BBB) breakdown and cerebral blood flow (CBF) dysregulation and reduction, is increasingly recognized as contributing to Alzheimer disease. [14] Age, gender, ApoE status, vascular risk factors, and baseline Mini-Mental State Examination score have not explained variability in BBB integrity. BBB impairment as a possible modifier of disease progression is suggested by correlations between the CSF-albumin index and measures of disease progression over 1 year. [15] The BBB is dysfunctional in a proportion of all patients with Alzheimer disease, primarily among men. BBB dysfunction may influence the clearance of both harmful and beneficial substances across the barrier. Renal function may have an impact on the BBB. [16]
Findings on PET scan performed with the use of Pittsburgh compound B have been observed to match histopathologic reports of Aβ distribution in aging and dementia. Schindler and associates measured brain amyloid burden by using Pittsburgh compound B to predict when cognitively normal individuals with brain amyloidosis will develop symptoms of AD. They transformed the mean cortical standardized uptake value ratio (SUVR) into a timescale using longitudinal data. Researchers concluded that age at symptom onset in sporadic AD is strongly correlated with the age at which an individual reaches a tipping point in amyloid accumulation. [17]
Combined use of conventional imaging such as MRI or fluorodeoxyglucose PET (FDG-PET) scanning with selected CSF biomarkers can incrementally contribute to early and specific diagnosis of Alzheimer disease. Low CSF concentrations of the amyloid-β (Aβ1-42) peptide, in combination with high total tau and phosphorylated tau, are sensitive and specific biomarkers that are highly predictive of progression to Alzheimer disease dementia in patients with mild cognitive impairment (MCI). Moreover, selected combinations of imaging and CSF biomarker measures are important in monitoring the course of Alzheimer disease and, therefore, are relevant when clinical trials are evaluated. [18, 19]
Several in vivo neuroimaging techniques can be used to noninvasively assess aspects of neuroanatomy, chemistry, physiology, and pathology. Neuroimaging biomarkers may assist in the diagnosis of neurodegenerative dementia and may provide prognostic information. Structural MRI, FDG-PET, and amyloid PET may be useful adjuncts to clinical examination. Novel MRI techniques and new PET radiotracers may further expand diagnostic capability. [6]
Although therapy for Alzheimer disease involves enhancers of cholinergic function, disease-modifying agents may become available in the future. Neuroimaging is used to exclude other causes of dementia such as normal-pressure hydrocephalus, brain tumors, subdural hematoma, and multiple infarctions. [5, 7]
Computed Tomography
Initial criteria for CT diagnosis of Alzheimer disease include diffuse cerebral atrophy with enlargement of cortical sulci and increased ventricle size. Many studies have indicated that cerebral atrophy is significantly greater among patients with Alzheimer disease than among aging patients without this diagnosis.
This concept was soon challenged, however, because cerebral atrophy can be present in elderly and healthy persons, and some patients with dementia may show no cerebral atrophy, at least at early stages. The extent of cerebral atrophy has been determined by using linear measurements—in particular, bifrontal and bicaudate diameters and diameters of the third and lateral ventricles. Various measurements are adjusted according to the diameter of the skull to account for normal variation.
To complement this modification, volumetric studies of the ventricles have been done. Despite these efforts, it is still difficult to distinguish between findings in a healthy elderly patient and those in a patient with dementia. A review of serial CT scans obtained over several months was not clinically useful for primary diagnosis of the disease.
Rate of change in brain atrophy
Changes in the rate of atrophy progression can be useful in diagnosing Alzheimer disease. [20, 21, 22] Longitudinal changes in brain size are associated with longitudinal progression of cognitive loss, [23] and enlargement of the third and lateral ventricles is greater in patients with Alzheimer disease than in those without this diagnosis. [24]
CT scan indices of hippocampal atrophy are highly associated with Alzheimer disease, but specificity is not well established. Use of a nonquantitative rating scale shows sensitivity of 81% and specificity of 67% in differentiating patients with Alzheimer disease with moderate dementia from age-matched control study participants. [25]
Changes in brain structure
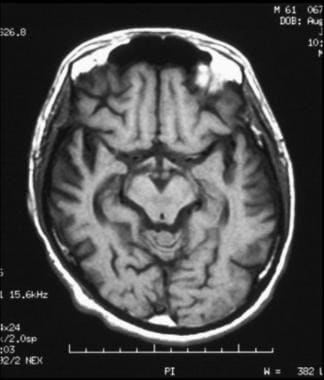
Diffuse cerebral atrophy can be observed with widened sulci and dilatation of lateral ventricles. Disproportionate atrophy of the medial temporal lobe, particularly of the volume of hippocampal formations (< 50%), may be seen.
The hippocampus is one of the brain regions affected earliest in Alzheimer disease; its dysfunction is believed to underlie the core feature of the disease—memory impairment. Changes in hippocampal volume, shape, symmetry, and activation are reflected by cognitive impairment. [26]
Dilatation of the perihippocampal fissure is a useful radiologic marker for initial diagnosis of Alzheimer disease, with predictive accuracy of 91%. [27] The hippocampal fissure is surrounded laterally by the hippocampus, superiorly by the dentate gyrus, and inferiorly by the subiculum. These structures are all involved in the early development of Alzheimer disease and explain enlargement at early stages. At the medial aspect, the fissure communicates with the ambient cistern, and its enlargement on CT scanning is often seen as hippocampal lucency or hypoattenuation in the temporal area medial to the temporal horn.
Temporal horns of the lateral ventricles may be enlarged. Prominence of choroid and hippocampal fissures and enlargement of the sylvian fissure may be noted. White matter attenuation is not a feature of Alzheimer disease.
Magnetic Resonance Imaging
Magnetic resonance imaging (MRI) is used to identify structural changes, including patterns of atrophy, that characterize neurodegenerative diseases; it can be performed to distinguish these from other causes of cognitive impairment such as infarcts, space-occupying lesions, and hydrocephalus. [28]
Rates of whole-brain and hippocampal atrophy derived from MRI scans can aid in disease diagnosis and tracking of pathologic progression of neurodegenerative disease. Studies have shown that cerebral atrophy is significantly greater in patients with Alzheimer disease than in those without this diagnosis. However, variability of atrophy in the normal aging process limits use of MRI as a definitive diagnostic technique. [21, 29, 30, 31, 32, 33]
(See the images below.)
Coronal, T1-weighted magnetic resonance imaging (MRI) scan in a patient with moderate Alzheimer disease. Brain image reveals hippocampal atrophy, especially on the right side.
Axial, T2-weighted magnetic resonance imaging (MRI) scan reveals atrophic changes within bilateral temporal lobes with prominence of the sylvian fissures.
 Axial, T1-weighted magnetic resonance imaging (MRI) scan shows bilateral cortical atrophy with accentuated cortical sulci; there is decreased involvement posteriorly compared to anteriorly.
 Axial, T1-weighted magnetic resonance imaging (MRI) scan shows bilateral cortical atrophy with accentuated cortical sulci; there is decreased involvement posteriorly compared with anteriorly.
Changes in hippocampal volume, shape, symmetry and activation are reflected by cognitive impairment. [26] Early MRI studies performed to evaluate the size of the hippocampus in patients with Alzheimer disease relative to patients without this diagnosis showed large reductions in hippocampal volumes (approximately 50%) and high sensitivity and specificity for classification. [34] Over time, enlargement of the temporal horns, as well as of the third and lateral ventricles, was noted in patients with Alzheimer disease as compared to patients not given this diagnosis.
On structural MRI, atrophy of the entorhinal cortex is already present in mild cognitive impairment (MCI). In autosomal dominant forms of Alzheimer disease, the rate of atrophy of medial temporal structures differentiates affected individuals from nonaffected individuals as early as 3 years before clinical onset of cognitive impairment. The accelerated annual rate of brain atrophy is a surrogate tool for evaluating new therapies that may save time and resources.
MRI measurements of hippocampus, amygdala, cingulate gyrus, head of the caudate nucleus, temporal horn, lateral ventricles, third ventricle, and basal forebrain yield a predictive rate of 77% for conversion to Alzheimer disease from questionable Alzheimer disease. [35, 36]
Functional MRI (fMRI) techniques can be used to measure cerebral perfusion. Dynamic susceptibility contrast (DSC) MRI consists of passage of a concentrated bolus of a paramagnetic contrast agent that sufficiently distorts the local magnetic field to cause transient loss of signal with pulse sequences, especially T2-weighted sequences. Passage of contrast material is imaged over time by sequential rapid imaging of the same section. In animal studies, the rate of change in signal intensity over time yields a measure directly proportionate to cerebral blood volume. Studies in humans have shown a correlation between positron emission tomography (PET) and DSC MRI scan results, as well as between cerebral blood volumes measured with DSC MRI and perfusion on single-photon emission computed tomography (SPECT) scanning.
MRI with echo-planar imaging and signal targeting with attenuation radiofrequency (EPISTAR) was performed in patients with Alzheimer disease. Focal areas of hypoperfusion were noted in posterior temporo-parieto-occipital regions. Ratios of signal intensity in parieto-occipital and temporo-occipital areas to signal intensity on whole section were significantly lower among patients with Alzheimer disease when compared with those without it. Parieto-occipital ratios were not correlated with dementia severity as measured via the Blessed Dementia Scale Information Memory Concentration subset.
With fMRI, structural imaging can be done by using the same imaging plane, field of view, and section thickness. Activational fMRI studies have included blood oxygenation level–dependent (BOLD) imaging, which uses changes in the level of oxygenated hemoglobin in capillary beds to depict areas of regional brain activation. In Alzheimer disease, fMRI activation is decreased in hippocampal and prefrontal regions.
On fMRI, paradigms activate a larger area of parieto-temporal association cortex in persons at high risk for Alzheimer disease compared with those not at risk, whereas entorhinal cortex activation is relatively low in MCI. [37]
These techniques are reasonably sensitive and specific in differentiating Alzheimer disease from changes caused by normal aging, and studies with pathologic confirmation show good sensitivity and specificity in differentiating Alzheimer disease from other dementias. These techniques can also be used to detect abnormalities in asymptomatic or presymptomatic individuals, and they may help in predicting the decline to dementia.
Hippocampal volume has been shown in MRI studies to be associated with cognitive impairment in patients with Alzheimer disease; hippocampal texture has also been shown to be a predictor of conversion of mild cognitive impairment to Alzheimer disease, according to the Alzheimer's Disease Neuroimaging Initiative. [38]
Degree of confidence
MRI findings of hippocampal atrophy are highly associated with Alzheimer disease, but specificity is not well established. [39] Studies have shown that hippocampal volumes permitted correct classification in 85% of patients with Alzheimer disease and moderate dementia. [40] Among these patients, sensitivity was 77% and specificity was 80%. [41] Hippocampal volume was the best discriminator, although several medial-temporal lobe structures were studied, including the amygdala and the parahippocampal gyrus. [29]
Hippocampal atrophy appears to be a feature of vascular disease (multi-infarct dementia) and Parkinson disease, even among patients with Parkinson disease without dementia. Hippocampal and entorhinal cortical atrophy are features of frontotemporal dementia, but they do not appear to be as profound as in Alzheimer disease. [42]
Single-Photon Emission Computed Tomography
Single-photon emission computed tomography (SPECT) is not commonly used to assess Alzheimer disease. However, SPECT scanning is useful in diagnostic assessment of Alzheimer disease if standardized and semiquantitative techniques are used. SPECT does have diagnostic value, particularly in differentiating Alzheimer disease from frontotemporal dementia. It should not be used in isolation but rather as an adjunct, and results should be interpreted in the context of clinical information. [43]
SPECT scanning uses direct photon-emitting isotopes rather than radioisotopes. SPECT isotopes have an average half-life of 6 to 12 hours. SPECT instrumentation is highly variable; therefore, use of a SPECT scanner with poor resolution can result in poor clinical performance. Positron emission tomography (PET) uses tracers that measure regional glucose metabolism (rCMRGlc). SPECT imaging is most commonly used for measurement of blood flow.
Early SPECT studies of blood flow replicated findings of functional reductions in the posterior temporal and parietal cortex. Severity of temporoparietal hypofunction has been correlated with severity of dementia. [20, 44, 45] Reductions in blood flow and in use of oxygen can be observed in the temporal and parietal neocortex of patients with Alzheimer disease with moderate to severe symptoms. [7, 46] Early reductions in glucose metabolism are seen in the posterior cingulate cortex.
Trollor and coworkers examined 18 patients with early Alzheimer disease and 10 healthy, elderly control patients with high-resolution SPECT during performance of a simple word discrimination task and observed gradation of regional cerebral blood flow (rCBF) values in both groups. The lowest values were in hippocampus and the highest in striatum, thalamus, and cerebellum. In this study, SPECT images were co-registered with individual MRI scans, allowing delineation of predetermined neuroanatomic regions of interest (ROIs). [47]
Researchers found that patients with Alzheimer disease had low relative rCBF in the parietal and prefrontal cortices as compared to healthy control patients. Analysis of individual ROIs revealed bilateral reduction of rCBF in prefrontal poles and in the posterior temporal and anterior parietal cortex, with unilateral reduction of rCBF in the left dorsolateral prefrontal cortex, the right posterior parietal cortex, and the left cingulate body. No significant differences in hippocampal, occipital, or basal ganglia rCBF were found. Discriminant function analysis shows that rCBF in prefrontal polar regions permitted the best classification. [47]
Added value of SPECT scanning was found to be greatest when a positive test result was obtained in patients with mild dementia for whom the diagnosis of Alzheimer disease was substantially doubted. [48] In this situation, a positive SPECT result would have increased the posttest probability of Alzheimer disease by 30%, whereas a negative SPECT result would have increased the likelihood of absence of Alzheimer disease by only 10%. [49]
Degree of confidence
It is not surprising that clinically validated SPECT studies showing differences between patients with Alzheimer disease and those without the diagnosis reveal high sensitivities and specificities of 80 to 90%. [49] Alzheimer disease is defined as temporal lobe perfusion greater than 2 standard deviations below control values.
Holman and colleagues found that bilateral temporoparietal hypoperfusion had a positive predictive value of 82% for Alzheimer disease. [50] Using inhaled xenon-133 (133Xe) and injected technetium-99m (99mTc) hexamethylpropyleneamine oxime, researchers reported sensitivity of 76% and specificity of 73%, with a positive predictive value of 92% and a negative predictive value of 57%. [51] These studies may assist in early and late diagnosis of Alzheimer disease, as well as with differential diagnosis of dementias.
Positron Emission Tomography
Positron emission tomography (PET) is a powerful imaging technique that enables in vivo examination of brain function. It allows noninvasive quantification of cerebral blood flow, metabolism, and receptor binding. PET scanning helps reveal pathogenesis of the disease and assists in making the correct diagnosis and in monitoring disease progression and treatment response. [28, 52, 53]
PET scanning involves introduction of a radioactive tracer, usually via intravenous injection. A tracer is essentially a biological compound of interest that is labeled with a positron-emitting isotope such as carbon-11 (11C), fluorine-18 (18F), or oxygen-15 (15O). These isotopes are used because they have relatively short half-lives (from minutes to < 2 hr), allowing tracers to reach equilibrium in the body without prolonged exposure of patients to radiation. [54, 55, 56, 57, 58, 59, 60, 61, 62, 63, 64] Fifty radiopharmaceuticals for in vivo imaging of amyloid burden and other tracers are being developed for assessment of tauopathies and inflammatory processes, which may underlie onset of the amyloid cascade. [28]
The most common physiologic process measurements performed via PET scanning are glucose with fluorodeoxyglucose (FDG) and cerebral blood flow using water. [39] FDG-PET has been used extensively for the study of Alzheimer disease; it is evolving into an effective tool for early diagnosis and for differentiation of Alzheimer disease from other types of dementia. FDG-PET has been used to identify persons at risk for Alzheimer disease even before onset of symptoms. [46, 64, 65]
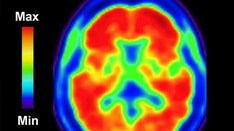
Patients with Alzheimer disease have characteristic temporoparietal glucose hypometabolism, the degree of which is correlated with the severity of dementia. [66] Temporal and parietal glucose hypometabolism is widely seen on PET images in patients with Alzheimer disease (see images below). With disease progression, frontal involvement may be evident. Glucose hypometabolism in Alzheimer disease is likely to be caused by a combination of neuronal cell loss and decreased synaptic activity. [67]
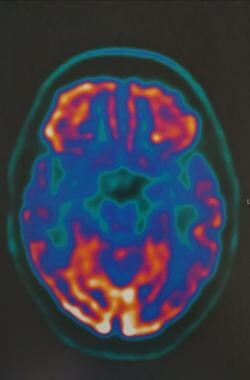 FDG-PET of axial brain in 75-year-old patient with cerebral atrophy and hypometabolism in the posterior cingulate, cuneus, bilateral parietal and temporal cortex. Courtesy of Dr Helga Castagnoli, Azienda Ospedaliera di Perugia.
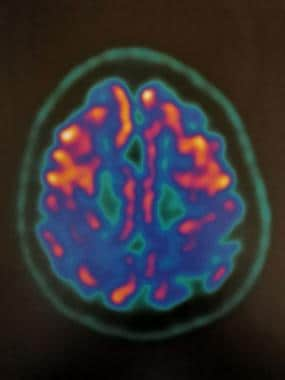 FDG-PET of axial brain in 75-year-old patient with cerebral atrophy and hypometabolism in the posterior cingulate, cuneus, and bilateral parietal and temporal cortex. Courtesy of Dr Helga Castagnoli, Azienda Ospedaliera di Perugia.
Entorhinal cortex hypometabolism on FDG-PET has predictive value for control patients in the progression of dementia to mild cognitive impairment (MCI) or even to Alzheimer disease. [68, 69] Identification of asymptomatic individuals at risk plays an enormous role in the treatment strategy for Alzheimer disease. [55] Individuals at high risk for Alzheimer disease (asymptomatic carriers of the APOE*E4 allele) exhibit a pattern of glucose hypometabolism similar to that of patients with diagnosed Alzheimer disease. After a mean follow-up of 2 years, the cortical metabolic abnormality continues to decline despite preservation of cognitive performance. [69, 70]
Teipel and colleagues found that time to conversion from MCI to Alzheimer disease was best predicted by increased AV45-PET signal in posterior medial and lateral cortical regions, decreased FDG-PET signal in medial temporal and temporobasal regions, and reduced gray matter volume in medial, basal, and lateral temporal regions. [71]
For patients with Alzheimer disease, PET performed with ligand PK11195 labeled with 11C, or (R)-[11C] PK11195, showed increased binding in the entorhinal, temporoparietal, and cingulate cortices. This finding corresponded to the postmortem distribution of Alzheimer disease pathology. [72]
Degree of confidence
Despite technical differences, results from PET and single-photon emission computed tomography (SPECT) are comparable, although data suggest that PET scanning is more sensitive than SPECT scanning. [73] On PET or SPECT scanning, mild Alzheimer disease may be more difficult to detect than moderate or severe disease. FDG-PET has sensitivity of 94% and specificity of 73% for Alzheimer disease. It can be used to correctly predict a progressive course of dementia with 91% sensitivity and a nonprogressive course with 75% specificity. [74] Efforts to develop a specific ligand for beta-amyloid (Aβ) plaques may further enhance the sensitivity of PET scanning for early diagnosis of Alzheimer disease and may provide a biological marker of disease progression. [72]
Boxer and coworkers reported that different amyloid-binding PET scan agents—Pittsburgh compound B and FDDNP (a PET radiotracer developed for in vivo visualization of tau and Aβ deposition in the brain)—may have differential sensitivity to prion-related brain pathology, and a combination of amyloid imaging agents may be useful in the diagnosis of early-onset dementia. [75]
Florbetapir F-18 (AMYViD), an FDA-approved diagnostic imaging agent, is indicated for PET brain imaging of Aβ neuritic plaques in adults being evaluated for Alzheimer disease or other cognitive decline. Florbetaben F-18 (Neuraceq), another agent approved by the FDA, yields images between 45 and 130 minutes after the injected dose.
Fluorine-18 AV1451 study results have shown that pathologic aggregation of tau is closely linked to patterns of neurodegeneration and clinical manifestations of Alzheimer disease, in contrast to the more diffuse distribution of Aβ pathology. [76]
The following guidelines for brain PET imaging using 18F-fluorodeoxyglucose (18F-FDG) were published by the European Association of Nuclear Imaging in the European Journal of Nuclear Medicine and Molecular Imaging [77] :
-
18F-FDG PET is recommended to support the diagnosis of Alzheimer disease in mild cognitive impairment, the diagnosis of dementia with Lewy bodies, and the diagnosis of frontotemporal lobar degeneration.
-
With PET/magnetic resonance imaging (MRI), patient safety regarding the magnetic field should be checked before MRI is performed, including the presence of incompatible devices such as pacemakers, neurostimulators, cochlear implants, non–MRI-compatible metal implants, and pumps; if there is doubt about ocular metal pieces, a low-dose radiograph can be obtained.
-
For women who are known or suspected to be pregnant, a critical decision must be made regarding whether benefits outweigh possible harms. Women should not breastfeed for 24 hours after application of PET tracer.
-
Patients should fast for at least 4-6 hours for optimal uptake of cerebral 18F-FDG.
-
Sedation, if necessary, should be performed as late as possible, with the intention to administer 18F-FDG at least 15 minutes before sedation.
-
Patients should be able to lie still for 15 minutes to 1 hour.
-
Current medications and timing of last administration should be recorded. This information, including duration and dosage, is particularly relevant for sedatives, psychotropic pharmaceuticals, antiseizure medication, and corticosteroids.
-
Blood glucose levels should be checked before 18F-FDG administration. When hyperglycemia is present (>160 mg/dl; >8.9 nmol/L), there is competition with elevated plasma glucose with 18F-FDG on carrier enzyme and, because it is usually associated with high intracellular glucose levels, on hexokinase enzyme.
-
Before scanning is performed, patients should void their bladder for maximum comfort during the study and to reduce radiation dose. To minimize radiation exposure, it is advisable for the patient to drink water and to void the bladder again after completion of the scanning session.
-
For static scans, patients should be positioned comfortably in a quiet, dimly lit room at least 15 minutes before 18F-FDG administration and during uptake of 18F-FDG (at least 20 minutes). The cannula for intravenous administration should be in place at least 10 minutes before 18F-FDG administration. Patients should be instructed not to speak, read, listen to music/sounds, or otherwise be active. Patients should be awake.
Future Challenges
The pathology of Alzheimer disease (AD) damages structural and functional brain networks, resulting in cognitive impairment. Results of connectomics studies have linked changes in structural and functional network organization in AD to patterns of amyloid-β and tau accumulation and spread, providing insights into neurobiological mechanisms of the disease. Detection of gene-related connectome changes might facilitate early diagnosis of AD, leading to the development of personalized therapeutic strategies that are effective at earlier stages on the disease spectrum. [78]
Palmqvist et al explored the use of plasma tau phosphorylated at threonine 217 (P-tau217) as a diagnostic biomarker for AD. They assessed the diagnostic accuracy of this biomarker for differentiating Alzheimer disease from other neurodegenerative disorders. Researchers reported that among 1402 participants from 3 selected cohorts, plasma P-tau217 differentiated AD from other neurodegenerative diseases with significantly greater accuracy than was achieved by established plasma- and MRI-based biomarkers, and its performance was not significantly different from key CSF- or PET-based measures. Further research is needed to optimize the assay, to validate these findings in unselected and diverse populations, and to identify the potential role of this biomarker in clinical care. [79]
PET neuroimaging of amyloid-β (Aβ) provides an in vivo biomarker for pathologic changes associated with Alzheimer disease. Several Aβ-targeted agents have been approved by the FDA. Additional agents, most notably those targeting tau, are currently under clinical investigation. Study of these agents, along with nonscintigraphic biomarkers from blood and CSF, has provided an opportunity to investigate the pathogenesis, prodromal changes, and time course of AD in living individuals. Our current understanding is that neuropathologic changes along the AD continuum begin up to 25 years before the onset of clinical symptoms. Opportunities afforded by in vivo biomarkers of AD, whether by serum or CSF examination or PET, have transformed the design of AD therapeutic trials by shifting focus to preclinical stages of the disease. [80]
PET is increasingly recognized as a key clinical tool for differentiating normal age-related changes in brain metabolism (using FDG) from those seen at the earliest stages of specific forms of dementia. However, FDG-PET reveals only nonspecific changes in altered parenchymal glucose uptake but not the specific etiologic proteinopathy causing abnormal glucose uptake. A growing class of radiotracers targeting specific protein aggregates for amyloid-β (Aβ) and tau is changing the way AD is diagnosed, as these radiotracers directly label the underlying disease pathology. As these pathology-specific radiotracers are making their way to the clinic, it is important for the clinical neuroradiologist to understand the underlying patterns of Aβ and tau deposition in the context of AD (across its clinical continuum) and in other causes of dementia and to grasp the implications of current research. [2]
Future disease-modifying therapies, should they be forthcoming, will rely heavily on the use of approved biomarkers or biomarkers currently under investigation to confirm the presence of target pathology. Understanding the progressive neuropathologic changes that occur in Alzheimer disease—and how scintigraphic findings relate to these changes—will help the interpreting physician to fully appreciate the implications of scintigraphic findings and will provide a basis for interpretation of examination findings. [80]
Questions & Answers
Overview
What is the role of neuroimaging in the diagnosis of Alzheimer disease?
What are the preferred imaging modalities for the diagnosis of Alzheimer disease?
Which findings on neuroimaging are characteristic of Alzheimer disease?
Which CSF biomarkers combined with neuroimaging assist in early diagnosis of Alzheimer disease?
What is the role of CT scanning in the diagnosis of Alzheimer disease?
Which brain structure changes on CT scans characteristic of Alzheimer disease?
What is the role of MRI in the diagnosis of Alzheimer disease?
How accurate is MRI in the diagnosis of Alzheimer disease?
What is the role of SPECT scanning in the diagnosis of Alzheimer disease?
How accurate is SPECT scanning in the diagnosis of Alzheimer disease?
What is the role of PET scanning in the diagnosis of Alzheimer disease?
How accurate is PET scanning in the diagnosis of Alzheimer disease?
-
Coronal, T1-weighted magnetic resonance imaging (MRI) scan in a patient with moderate Alzheimer disease. Brain image reveals hippocampal atrophy, especially on the right side.
-
Axial, T2-weighted magnetic resonance imaging (MRI) scan of the brain reveals atrophic changes in the temporal lobes.
-
Axial, T2-weighted magnetic resonance imaging (MRI) scan shows dilated sylvian fissure resulting from adjacent cortical atrophy, especially on the right side.
-
Axial, T1-weighted magnetic resonance imaging (MRI) scan shows a dilated sylvian fissure caused by adjacent cortical atrophy.
-
Axial, T1-weighted magnetic resonance imaging (MRI) scan shows bilateral cortical atrophy with accentuated cortical sulci; there is decreased involvement posteriorly compared to anteriorly.
-
Axial, T1-weighted magnetic resonance imaging (MRI) scan shows bilateral cortical atrophy with accentuated cortical sulci; there is decreased involvement posteriorly compared with anteriorly.
-
A slideshow presentation on Alzheimer disease.
-
FDG-PET of axial brain in 75-year-old patient with cerebral atrophy and hypometabolism in the posterior cingulate, cuneus, bilateral parietal and temporal cortex. Courtesy of Dr Helga Castagnoli, Azienda Ospedaliera di Perugia.
-
FDG-PET of axial brain in 75-year-old patient with cerebral atrophy and hypometabolism in the posterior cingulate, cuneus, and bilateral parietal and temporal cortex. Courtesy of Dr Helga Castagnoli, Azienda Ospedaliera di Perugia.
-
Coronal, T1-weighted magnetic resonance imaging (MRI) scan reveals hippocampal atrophy, especially on the left side.
-
Axial, T2-weighted magnetic resonance imaging (MRI) scan reveals atrophic changes within bilateral temporal lobes with prominence of the sylvian fissures.