Practice Essentials
Cardiac tumors may be primary or secondary, may be related to the heart muscle or pericardium, and may be direct extensions of primary tumors or metastases from adjacent structures. In general, primary cardiac tumors are of mesothelial or epithelial origin. Primary tumors of the heart are rare. Tumors include myxomas, fibromas, lipomas, rhabdomyomas, plasma cell granulomas, sarcomas, lymphomas, thymomas, hemangiopericytomas, fibroelastomas, angiomas, hemangiomas, angiomyolipomas/hamartomas, lymphangiomas, and mycosis fungoides. In autopsy studies, the overall prevalence ranges from 0.002% to 0.33%, with about 75-79% of these considered benign. [1] The most common primary cardiac tumor is atrial myxoma, which accounts for 40-50% of these neoplasms. Cardiac sarcoma, the most common primary malignant cardiac tumor, has a poor prognosis, with a 1-year survival rate of 45.3% after surgery. [2, 3, 4, 5, 6]
The World Health Organization (WHO) divides primary cardiac tumors into benign tumors, uncertain biological behavior tumors, germ cell tumors, and malignant tumors. The most common primary cardiac tumor is benign cardiac myxoma, constituting about 50% of cases. Sarcomas are the most common malignant primary cardiac tumors, accounting for about 95% of cases, with lymphomas accounting for about 5%. Malignant tumors that most often migrate to the heart include lung cancer, breast cancer, lymphoma, and malignant melanoma. Rhabdomyoma is the most common primary benign cardiac tumor in children. [7, 8]
Imaging modalities
Echocardiography, especially the transesophageal route, is usually the initial imaging modality. It can show the tumor, its extent, and its hemodynamic consequences. Cardiac MRI provides further information about morphology, location, and extent of the mass. Cardiac MRI is considered the reference standard for early assessment and differentiation between nonneoplastic and tumor masses. The multiplanar assessment of anatomy, tissue composition, and functional impact provided by MRI allows accurate confirmation of a space-occupying lesion, localization, and extent of involvement. In cases of suspected cardiac malignancies, CT scanning is also useful to assess extracardiac extent and distant metastases. Reports have been published on the use of FDG PET/CT showing cardiac neoplasia, particularly metastatic involvement, as well as being used in cases of suspected aggressive cardiac malignancy to support the diagnosis and detect occult distant disease. [9, 10, 11, 12, 13, 14, 15, 16, 17]
Initially, intracardiac tumors are best evaluated by using echocardiography. [18] Differentiation of left atrial masses from thrombi may be best achieved by using transesophageal echocardiography (TEE). Because magnetic resonance imaging (MRI), magnetic resonance angiography (MRA), and computed tomography (CT) provide a larger field of view, which affords a better opportunity to assess contiguous extracardiac involvement or the presence of metastatic disease, they are preferred over echocardiography for cases that are not as straightforward or for cases in which acoustic access is restricted. [19, 20, 21, 22, 23, 24, 7, 25, 26, 27]
Chest radiography may show the effects of intracardiac obstruction with features of pulmonary edema but, otherwise, may contribute little. Echocardiography is easily accessible, but it is limited by restricted acoustic access. CT scanning is accurate but requires radiation and contrast material. In suitable patients, MRI has the fewest limitations, provided that the patient can remain motionless during the examination. Although cardiac MRI has high accuracy for identifying benign tumors, pathology remains the gold standard for differentiating between tumor types. [28]
Pheochromocytomas may be imaged by using metaiodobenzylguanidine (mIBG) uptake studies. Otherwise, the use of nuclear medicine studies is limited. [23]
In cases of cardiac myxoma, CT can show calcification in the mass, and cine MRI images show a mobile lesion in the cardiac cavity. Myxoma typically display as isointense or heterogeneously intense on T1-weighted imaging and hyperintense or heterogeneously intense on T2-weighted imaging. [7]
Cardiac magnetic resonance (CMR) is the preferred method for evaluating fibroelastoma, the second most common benign cardiac tumor. It is hypointense on cine MR images, isointense on T1-weighted images, and isointense on T2-weighted images. [7]
Rhabdomyoma, the most common cardiac tumor in children, is benign, with most lesions regressing naturally and not requiring surgery. On ultrasonography, cardiac rhabdomyomas usually present as small, lobulated, uniform, hyperechoic masses originating from the myocardium or ventricular septum. CMR cine images show focal ventricular wall motion abnormalities. The tumors are isotense or slightly hyperintense on T1-weighted images and are usually hyperintense on T2-weighted imaging. [7]
(Cardiac tumors are shown in the images below.)
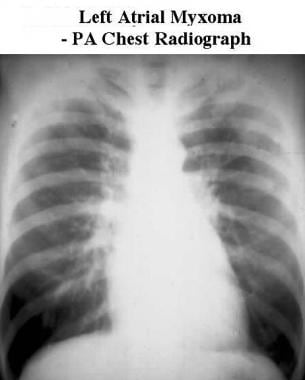 Posteroanterior (PA) chest radiograph shows pulmonary venous congestion and prominence of the left atrial appendage in a patient with a left atrial myxoma obstructing the mitral valve.
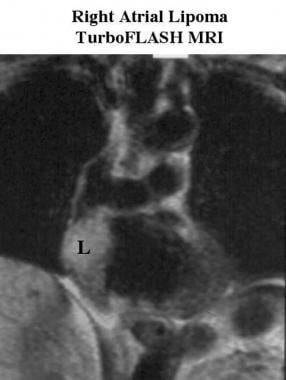 Coronal turbo fast low-angle shot (FLASH) MRI scan of a patient with a right atrial lipoma shows a high-signal-intensity mass (L) in the lateral wall of the right atrium. High signal intensity on T1 imaging is strongly suggestive of fatty tissue and identifies this mass as a lipoma.
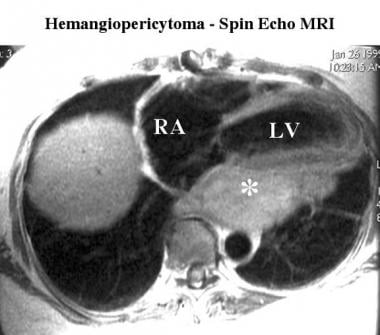 Spin-echo MRI scan in a patient with hemangiopericytoma shows a large intermediate-signal-intensity retrocardiac mass (*) behind the left ventricle (LV). These signal-intensity characteristics can indicate any of a large number of tissue types. RA indicates the right atrium.
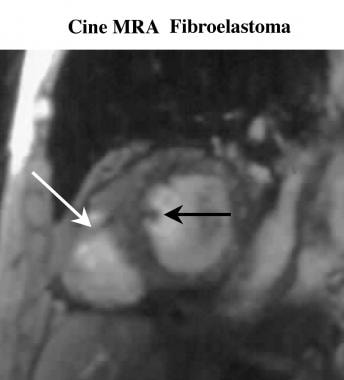 Cine short-axis magnetic resonance angiogram in a patient with a fibroelastoma shows a low-signal-intensity mass (black arrow) projecting from the interventricular septum and projecting into the left ventricle. The moderator band (white arrow) is seen crossing the right ventricular cavity. The moderator band is a normal structure that can sometimes mimic an abnormal mass.
Endodermal tumors
Atrioventricular (AV) nodal tumors may contain neuroendocrine cells and, thus, may be of endodermal origin (as in polycystic tumor of the AV node or congenital endodermal heterotopia of the AV node). [29, 30] Cardiac paragangliomas have also been described. [31, 32] These tumors tend to be left sided. Intracardiac pheochromocytomas also occur. [33, 34]
Pericardial tumors
Primary pericardial tumors include malignant spindle cell tumors, localized fibrous tumors (also called localized fibrous mesotheliomas), pericardial cysts (see the first image below), liposarcomas, lipomas (see the second image below), and teratomas. [35]
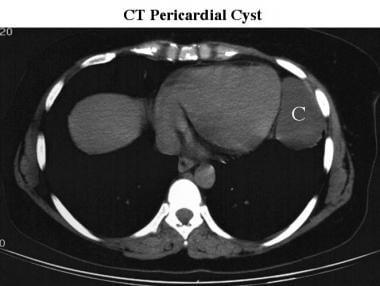 CT scan of a pericardial cyst. A well-defined apical mass (C) has the characteristic position and low attenuation of a pericardial cyst.
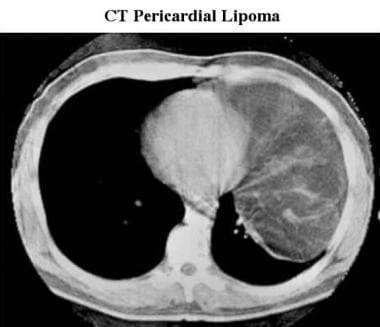 CT scan of a pericardial lipoma. A large, low-attenuating mass extends from the cardiac apex; this finding is characteristic of a lipoma.
Cardiac angiosarcomas tend to involve the pericardium secondarily and to produce hemorrhagic pericardial effusions. [36]
Cardiac valve tumors
Primary tumors of the cardiac valves and chordae are uncommon; however, when they do occur, they are usually fibroelastomas. [37] Fibroelastomas are small tumors that may be an incidental finding at autopsy (see the image below). They can be mistaken for heart valve vegetation. Lipomatous tumors of the heart valves also have been described. [38]
Cine short-axis magnetic resonance angiogram in a patient with a fibroelastoma shows a low-signal-intensity mass (black arrow) projecting from the interventricular septum and projecting into the left ventricle. The moderator band (white arrow) is seen crossing the right ventricular cavity. The moderator band is a normal structure that can sometimes mimic an abnormal mass.
Cardiac tumors in childhood
Primary cardiac tumors that present in children include rhabdomyomas, intrapericardial teratomas, myxomas, fibromas, hemangiomas, mesotheliomas, multicystic hamartomas, epicardial lipomas, and rhabdomyosarcomas; some tumors cannot be identified pathologically. [39, 40, 41] Rhabdomyomas are the most common pediatric cardiac tumors.
Metastatic disease
Metastatic disease may result from contiguous extension, lymphangitic spread, or hematogenous spread. [42] Many of the metastatic cardiac tumors are bronchogenic carcinomas (see the images below), breast carcinomas, lymphomas, leukemia, carcinoid tumors, or melanomas. [43, 44] Metastatic cervical carcinoma has also been reported. [45] Metastases to the heart tend to involve the myocardium rather than the valves or the endocardium.
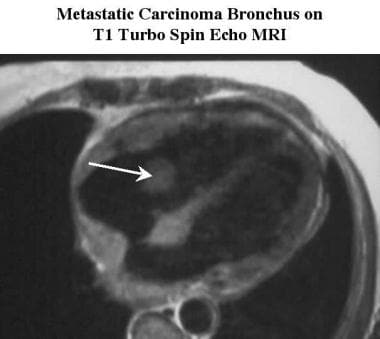 Axial T1-weighted turbo spin-echo MRI scan of a patient with a metastatic bronchogenic carcinoma shows a tumor invading the wall of the right atrium with a mass (arrow) in the area of the tricuspid valve.
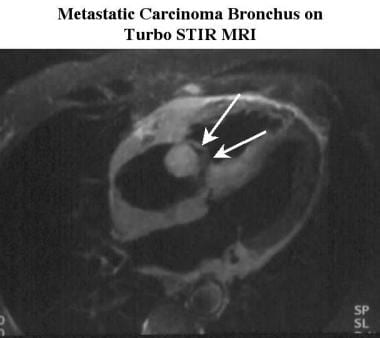 Oblique 4-chamber turbo short-tau inversion recovery (STIR) MRI scan of a patient with metastatic bronchogenic carcinoma shows the tumor invading the wall of the right atrium and the interatrial septum. The mass is separate from, but is obstructing, the tricuspid valve (arrows).
Content.
Radiography
Plain radiography is not an effective method for screening for cardiac neoplasms or for evaluating the extent of a tumor. Cardiac myxomas may be calcified; therefore, they may be visible on lateral chest radiographs. Left atrial enlargement may be noted; this may result from mitral valve obstruction. Diseases that expand the cardiac silhouette, either by bulk or by secondary effusion, may be suggestive of pericardial involvement. The degree of confidence is limited concerning cardiac tumors. Plain radiographic changes in cardiac tumors are nonspecific.
(See the images below.)
Posteroanterior (PA) chest radiograph shows pulmonary venous congestion and prominence of the left atrial appendage in a patient with a left atrial myxoma obstructing the mitral valve.
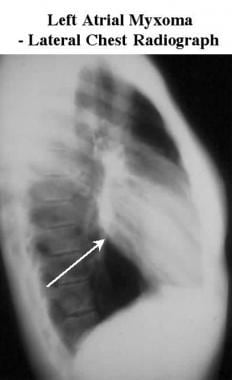 Lateral chest radiograph shows prominence of the left atrium (arrow) in a patient with a left atrial myxoma obstructing the mitral valve.
Computed Tomography
By virtue of its larger field of view, CT scanning is better than echocardiography for many situations in which mediastinal involvement or restricted acoustic access is suspected. The heart and contiguous structures can be assessed with CT scanning. Cardiac function, as well as the effects of a tumor on cardiac function, can be evaluated using electrocardiogram (ECG)-gated, multiring-detector spiral scanners or electron-beam scanners. Such functional imaging is on par with functional MRI. These techniques can also be used to detect the motion of a pedunculated tumor, such as an atrial myxoma.
Tumors that calcify (eg, myxomas) can also be imaged with CT scanning, which provides an excellent depiction of calcific, attenuating areas. Tumor tissue tends to have an attenuation of approximately 40-100 HU. [46] Cardiac or pericardial lipomas are easily identified by low attenuation (-100 HU) and look similar to the fat of the mediastinum (see the image below). [47]
The degree of confidence is high for detecting cardiac tumors on contrast-enhanced CT scanning. Tissue characterization is limited. ECG gating improves image quality and precision.
CT scan of a pericardial lipoma. A large, low-attenuating mass extends from the cardiac apex; this finding is characteristic of a lipoma.
Angiosarcomas frequently appear as right atrial masses with accompanying hemopericardium (see the image below). [46, 19]
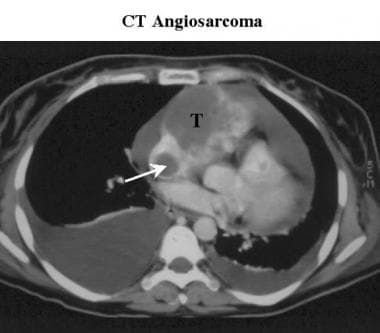 Contrast-enhanced CT scan of a patient with an angiosarcoma shows a tumor mass invading the right side of the heart (T) with extension rising up from the inferior vena cava (arrow). A large right pleural effusion and a smaller left pleural effusion are noted.
Magnetic Resonance Imaging
MRI and MRA are superior to echocardiography in detecting or excluding cardiac tumors, finding the precise location of cardiac tumors (ie, paracardiac, mural, or intracavitary), determining the extent of disease, detecting the presence of effusions, and detecting the presence of metastases. [20, 21, 24, 48, 10, 7, 27, 15, 17]
The effects of the disease on cardiac function can be assessed by using MRI/MRA via cine and tagging techniques (see the images below).
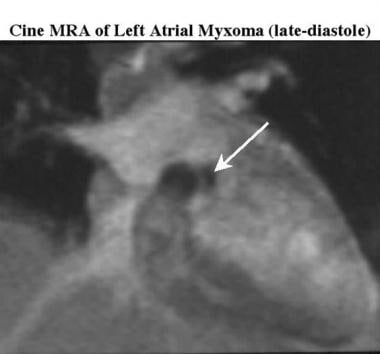 Cine magnetic resonance angiogram of a patient with a left atrial myxoma (in late diastole) shows only minor movement of the tumor during diastole with some loss of signal intensity (arrow), caused by flow dephasing resulting from turbulent flow around the tumor.
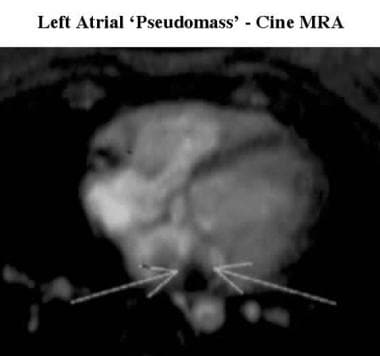 Axial cine magnetic resonance angiogram in a patient with a left atrial pseudomass shows loss of signal intensity caused by turbulent flow (arrows) around the region of the expansion of the pulmonary vein tissue entering the left atrium.
MRI may also be better than CT scanning at depicting tumor morphology via soft-tissue contrast resolution. [46] Another advantage of MRI over CT scanning is that MRI does not require intravenous contrast material. [19, 22] Moreover, with MRI, extracardiac disease and cardiac morphology are well demonstrated, and cardiac contractility can be evaluated. [49]
Contrast-enhanced MRI may define the extent of the tumor, although it is limited as a means of differentiating benign from malignant disease. Contrast-enhanced MRI can also be used to differentiate areas of slow flow from solid material (ie, thrombus or tumor). (See the image below).
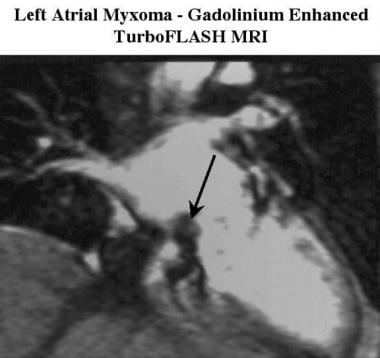 Gadolinium-enhanced turbo fast low-angle shot (FLASH) MRI scan of a patient with a left atrial myxoma shows lack of enhancement of the tumor mass (arrow). This is not a uniform finding, as some myxomas show mild contrast enhancement that may allow for differentiation of a myxoma from a thrombus.
Based on signal-intensity characteristics, an estimate of the tissue type may be possible with MRI. Fatty masses demonstrate high signal intensity on T1-weighted, spin-echo images (see the images below) and medium signal intensity on T2-weighted, spin-echo images.
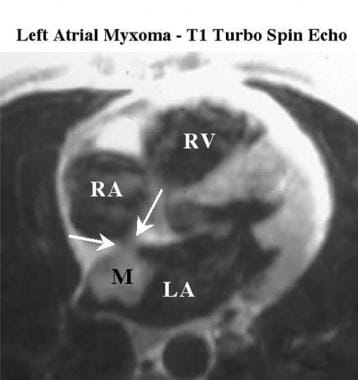 T1-weighted turbo spin-echo MRI scan shows intermediate signal intensity in a left atrial myxoma (M) attached to the margin of the fossa ovalis (between the arrows). LA indicates the left atrium; RA, the right atrium; and RV, the right ventricle.
Coronal turbo fast low-angle shot (FLASH) MRI scan of a patient with a right atrial lipoma shows a high-signal-intensity mass (L) in the lateral wall of the right atrium. High signal intensity on T1 imaging is strongly suggestive of fatty tissue and identifies this mass as a lipoma.
T1-weighted turbo spin-echo MRI scan shows intermediate signal intensity in a left atrial myxoma (M) attached to the margin of the fossa ovalis (between the arrows). LA indicates the left atrium; RA, the right atrium; and RV, the right ventricle.
Coronal turbo fast low-angle shot (FLASH) MRI scan of a patient with a right atrial lipoma shows a high-signal-intensity mass (L) in the lateral wall of the right atrium. High signal intensity on T1 imaging is strongly suggestive of fatty tissue and identifies this mass as a lipoma.
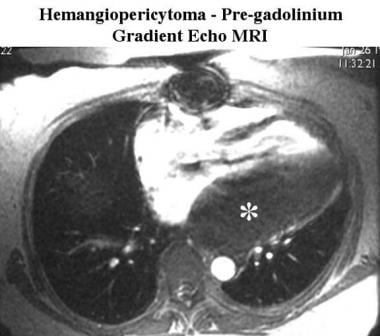 Pregadolinium gradient-echo MRI scan of a patient with hemangiopericytoma shows low signal intensity in the tumor (*).
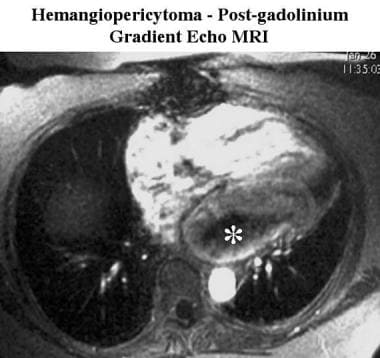 Gadolinium-enhanced gradient-echo MRI scan (taken 160 seconds after previous image) of a patient with a hemangiopericytoma shows slow peripheral enhancement of the tumor mass (*); this indicates only moderate vascularity.
Lipomatous hypertrophy of the interatrial septum (LHIAS) (see the image below) is a transformation of tissue rather than an actual neoplasm. LHIAS demonstrates high signal intensity on T1-weighted images and can extend to the free wall.
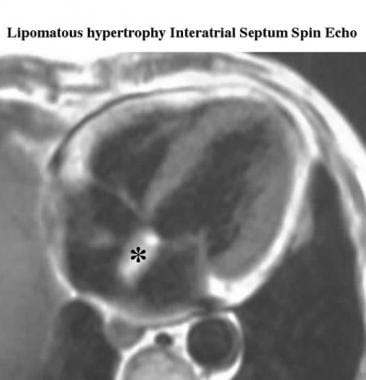 Axial ECG-gated spin-echo MRI scan shows high-signal-intensity thickening (*) resulting from lipomatous hypertrophy of the interatrial septum.
Myxomas tend to have low signal intensity on breath-hold cine images, and they are visually conspicuous against surrounding bright (hyperintense) blood (see the images below).
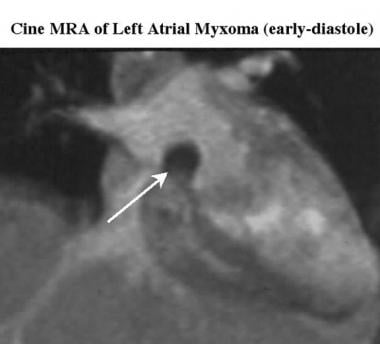 Cine magnetic resonance angiogram (in early diastole) shows low signal intensity in a sessile left atrial myxoma.
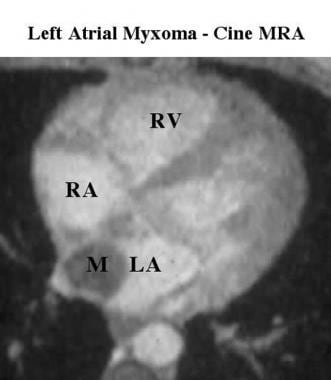 Cine magnetic resonance angiogram shows low signal intensity in a left atrial myxoma (M) surrounded by high signal intensity in flowing blood. LA indicates the left atrium; RA, the right atrium; and RV, the right ventricle.
Similarly, turbo short-tau inversion recovery images demonstrate a hyperintense tumor enveloped by hypointense blood within the atrium (see the images below); however, myxomas have variable amounts of calcification and fibrous, myxomatous tissue (which is bright on T2-weighted images). Water-rich myxomatous tissue tends to have a signal intensity higher than that of normal myocardium on T2-weighted images. [46]
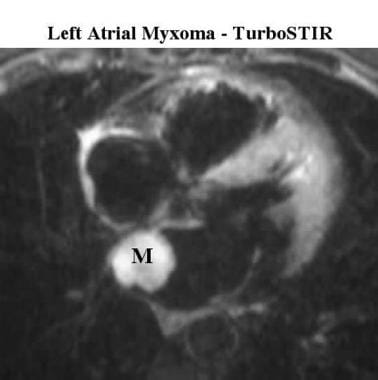 Turbo short-tau inversion recovery (STIR) MRI scan shows high signal intensity in a left atrial myxoma (M) attached to the margin of the fossa ovalis.
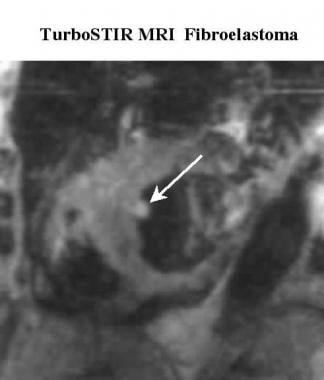 Turbo short-tau inversion recovery short-axis MRI scan of a patient with a fibroelastoma shows a high-signal-intensity mass (arrow) projecting from the interventricular septum into the left ventricle.
Angiosarcomas often have high signal intensity on T1-weighted images (see the image below). [50]
Gadolinium-based contrast agents have been linked to the development of nephrogenic systemic fibrosis (NSF) or nephrogenic fibrosing dermopathy (NFD). NSF/NFD has occurred in patients with moderate to end-stage renal disease, after being given a gadolinium-based contrast agent to enhance MRI or MRA scans. NSF/NFD is a debilitating and sometimes fatal disease. Characteristics include red or dark patches on the skin; burning, itching, swelling, hardening, and tightening of the skin; yellow spots on the whites of the eyes; joint stiffness with trouble moving or straightening the arms, hands, legs, or feet; pain deep in the hip bones or ribs; and muscle weakness.
MRI probably offers the most accurate noninvasive test for cardiac tumors in patients who can hold their breath. However, the prominence of the crista terminalis or Chiari network and juxtacardiac masses can be mistaken for tumors (see the image below).
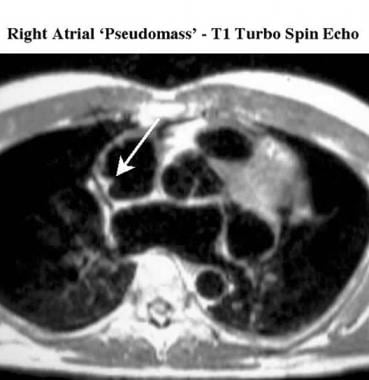 Axial T1-weighted turbo spin-echo MRI scan of a patient with a right atrial pseudomass shows a high-signal-intensity prominence (arrow) in the right atrium arising from the free wall of the right atrium, the crista terminalis.
Regarding cardiac tumors, few false findings occur. Errors most frequently result from patient movement or interpreter inexperience (eg, misinterpretation of pseudotumors). A pseudomass is seen in the image below.
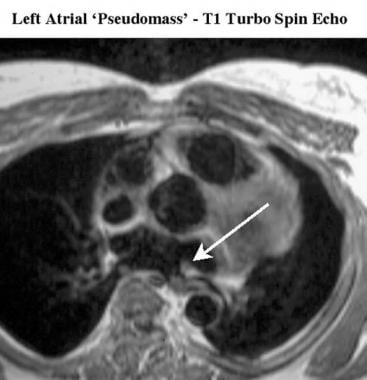 Axial T1-weighted turbo spin-echo MRI scan of a patient with a left atrial pseudomass shows expansion (arrow) of the pulmonary vein tissue as it enters the left atrium.
Ultrasonography
The benefit of echocardiography is its portability and ease of use for a first-peek approach to cardiac pathology. In many patients, especially those with myxomas, echocardiography may be all that is required to make the diagnosis and stage the tumor. In patients with poor-quality transthoracic echocardiograms, transesophageal echocardiography (TEE) usually provides better images, especially for masses in or adjacent to the left atrium (see the images below). [18]
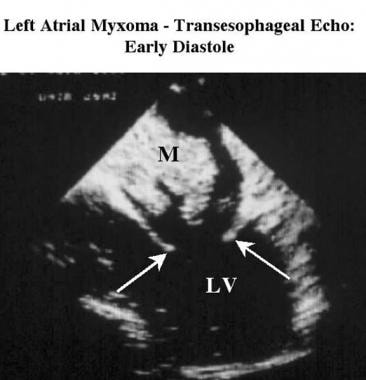 Transesophageal echocardiogram obtained during early diastole in a patient with a left atrial myxoma shows an echogenic tumor mass (M) projecting from the interatrial septum and partially obstructing the mitral valve. The arrows indicate the leaflets and LV indicates the left ventricle.
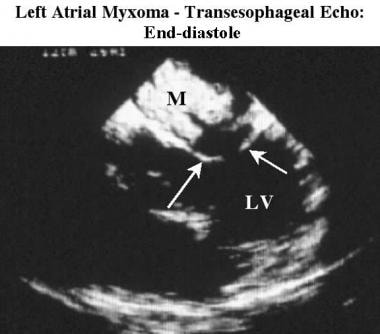 Transesophageal echocardiogram obtained at end-diastole in a patient with a left atrial myxoma shows that the myxoma (M) has moved toward, but not through, the mitral valve orifice. LV indicates left ventricle.
The characteristic finding on M-mode and 2-dimensional (2D) echocardiography of left atrial myxomas (the most common primary cardiac tumor) is an echogenic mass in the left atrium during ventricular systole, which is seen prolapsing through the mitral valve during diastole (see the images below).
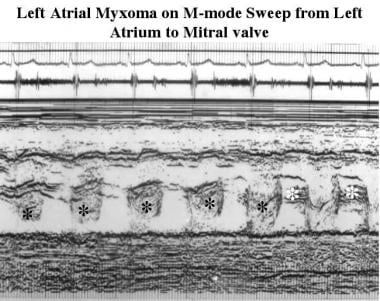 M-mode echocardiogram in a patient with a left atrial myxoma. Sweep from the left atrium to the mitral valve shows a change in the timing of tumor echoes from systole (in the left atrium) to diastole (through the mitral valve).
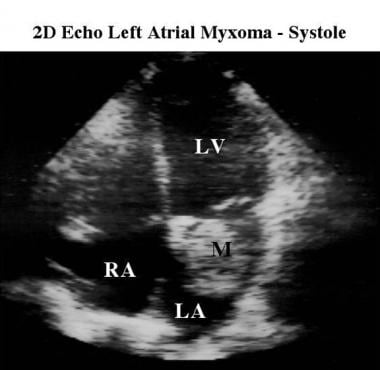 Apical 4-chamber 2-dimensional echocardiogram of a left atrial myxoma during ventricular systole shows the echogenic mass of the myxoma (M) in the left atrium. LA indicates the left atrium; LV, the left ventricle; and RA, the right atrium.
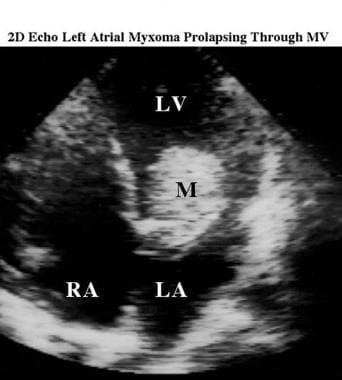 Apical 4-chamber 2-dimensional echocardiogram of a left atrial myxoma during ventricular diastole shows the echogenic mass of the myxoma (M) now prolapsing through the mitral valve orifice into the left ventricle. LA indicates the left atrium; LV, the left ventricle; and RA, the right atrium.
The mass may be mobile or relatively sessile. Myxomas may demonstrate variable echogenicity and can cause atrial enlargement. Other tumors may invade the myocardium or project into the affected cavities (see the image below). Often, pericardial effusion is associated with malignant tumors.
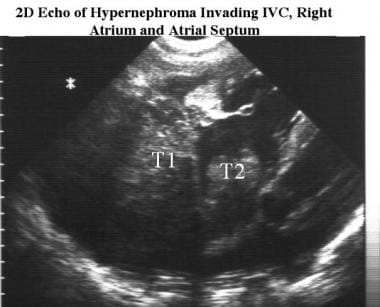 Two-dimensional echocardiogram of a hypernephroma invading the inferior vena cava, the right atrium, and the atrial septum. Echogenic material indicates tumor tissue invading the wall of the right atrium (T1) and growing from the inferior vena cava into the right atrial cavity (T2).
Ultrasonographic findings are accurate for identifying tumors inside cardiac chambers, provided that acoustic access is adequate. Ultrasonography is less helpful if acoustic access is poor or if tumors extend outside the heart or into the great vessels. Although it is more invasive, transesophageal echocardiography is best for imaging left atrial and left ventricular tumors.
Prenatal ultrasonography can identify intracardiac masses and brain lesions of tuberous sclerosis and intrapericardial tumors, such as teratomas. [51, 52]
Degree of confidence
Unlike CT scanning or MRI, echocardiography is somewhat operator dependent, and it has a more limited field of view. Areas behind the sternum, ribs, or lungs cannot be visualized adequately, and acoustic windows limit the structures imaged on any single plane or view.
Prominence of the crista terminalis or Chiari network juxtacardiac masses (eg, hiatal hernia) may create false findings.
Angiography
The need for angiography is limited. Tumor vascularity may be seen with selective angiography, as demonstrated in the image below. Generally, angiography is required only if information concerning the coronary artery anatomy is needed or if percutaneous intervention is planned. Neovascularity of myxomas may be seen on selective angiography. [53, 54]
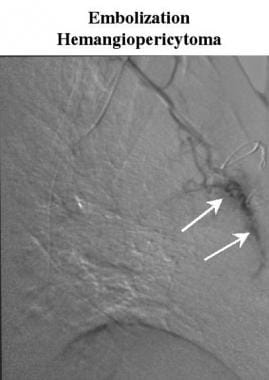 Digital subtraction angiogram during embolization of a hemangiopericytoma shows selective injection into an internal mammary artery branch. Only mild vascularity (arrows) is noted, as predicted by the contrast-enhancement pattern on the MRIs.
-
Posteroanterior (PA) chest radiograph shows pulmonary venous congestion and prominence of the left atrial appendage in a patient with a left atrial myxoma obstructing the mitral valve.
-
Lateral chest radiograph shows prominence of the left atrium (arrow) in a patient with a left atrial myxoma obstructing the mitral valve.
-
Cine magnetic resonance angiogram (in early diastole) shows low signal intensity in a sessile left atrial myxoma.
-
Cine magnetic resonance angiogram of a patient with a left atrial myxoma (in late diastole) shows only minor movement of the tumor during diastole with some loss of signal intensity (arrow), caused by flow dephasing resulting from turbulent flow around the tumor.
-
Gadolinium-enhanced turbo fast low-angle shot (FLASH) MRI scan of a patient with a left atrial myxoma shows lack of enhancement of the tumor mass (arrow). This is not a uniform finding, as some myxomas show mild contrast enhancement that may allow for differentiation of a myxoma from a thrombus.
-
T1-weighted turbo spin-echo MRI scan shows intermediate signal intensity in a left atrial myxoma (M) attached to the margin of the fossa ovalis (between the arrows). LA indicates the left atrium; RA, the right atrium; and RV, the right ventricle.
-
Turbo short-tau inversion recovery (STIR) MRI scan shows high signal intensity in a left atrial myxoma (M) attached to the margin of the fossa ovalis.
-
Cine magnetic resonance angiogram shows low signal intensity in a left atrial myxoma (M) surrounded by high signal intensity in flowing blood. LA indicates the left atrium; RA, the right atrium; and RV, the right ventricle.
-
M-mode echocardiogram in a patient with a left atrial myxoma. Sweep from the left atrium to the mitral valve shows a change in the timing of tumor echoes from systole (in the left atrium) to diastole (through the mitral valve).
-
Apical 4-chamber 2-dimensional echocardiogram of a left atrial myxoma during ventricular systole shows the echogenic mass of the myxoma (M) in the left atrium. LA indicates the left atrium; LV, the left ventricle; and RA, the right atrium.
-
Apical 4-chamber 2-dimensional echocardiogram of a left atrial myxoma during ventricular diastole shows the echogenic mass of the myxoma (M) now prolapsing through the mitral valve orifice into the left ventricle. LA indicates the left atrium; LV, the left ventricle; and RA, the right atrium.
-
Transesophageal echocardiogram obtained during early diastole in a patient with a left atrial myxoma shows an echogenic tumor mass (M) projecting from the interatrial septum and partially obstructing the mitral valve. The arrows indicate the leaflets and LV indicates the left ventricle.
-
Transesophageal echocardiogram obtained at end-diastole in a patient with a left atrial myxoma shows that the myxoma (M) has moved toward, but not through, the mitral valve orifice. LV indicates left ventricle.
-
Coronal turbo fast low-angle shot (FLASH) MRI scan of a patient with a right atrial lipoma shows a high-signal-intensity mass (L) in the lateral wall of the right atrium. High signal intensity on T1 imaging is strongly suggestive of fatty tissue and identifies this mass as a lipoma.
-
Axial T1-weighted spin-echo MRI scan of a patient with a retrosternal lymphoma shows intermediate signal intensity in the retrosternal mass of lymphoma tissue (L) and an associated pericardial effusion (arrow).
-
Spin-echo MRI scan in a patient with hemangiopericytoma shows a large intermediate-signal-intensity retrocardiac mass (*) behind the left ventricle (LV). These signal-intensity characteristics can indicate any of a large number of tissue types. RA indicates the right atrium.
-
Pregadolinium gradient-echo MRI scan of a patient with hemangiopericytoma shows low signal intensity in the tumor (*).
-
Gadolinium-enhanced gradient-echo MRI scan (taken 160 seconds after previous image) of a patient with a hemangiopericytoma shows slow peripheral enhancement of the tumor mass (*); this indicates only moderate vascularity.
-
Digital subtraction angiogram during embolization of a hemangiopericytoma shows selective injection into an internal mammary artery branch. Only mild vascularity (arrows) is noted, as predicted by the contrast-enhancement pattern on the MRIs.
-
Cine short-axis magnetic resonance angiogram in a patient with a fibroelastoma shows a low-signal-intensity mass (black arrow) projecting from the interventricular septum and projecting into the left ventricle. The moderator band (white arrow) is seen crossing the right ventricular cavity. The moderator band is a normal structure that can sometimes mimic an abnormal mass.
-
Turbo short-tau inversion recovery short-axis MRI scan of a patient with a fibroelastoma shows a high-signal-intensity mass (arrow) projecting from the interventricular septum into the left ventricle.
-
Contrast-enhanced CT scan of a patient with an angiosarcoma shows a tumor mass invading the right side of the heart (T) with extension rising up from the inferior vena cava (arrow). A large right pleural effusion and a smaller left pleural effusion are noted.
-
Oblique 4-chamber turbo short-tau inversion recovery (STIR) MRI scan of a patient with a metastatic leiomyosarcoma shows an apical tumor mass (*) that is invading through the posterior wall of the left ventricle and is associated with a high-signal-intensity posterior pericardial effusion.
-
Oblique 4-chamber turbo spin-echo MRI scan shows an apical tumor mass (*) with lower signal intensity. Note how this sequence provides less discrimination between the tumor, the normal myocardium, and the pericardial fluid.
-
Axial T1-weighted turbo spin-echo MRI scan of a patient with a metastatic bronchogenic carcinoma shows a tumor invading the wall of the right atrium with a mass (arrow) in the area of the tricuspid valve.
-
Oblique 4-chamber turbo short-tau inversion recovery (STIR) MRI scan of a patient with metastatic bronchogenic carcinoma shows the tumor invading the wall of the right atrium and the interatrial septum. The mass is separate from, but is obstructing, the tricuspid valve (arrows).
-
Two-dimensional echocardiogram of a hypernephroma invading the inferior vena cava, the right atrium, and the atrial septum. Echogenic material indicates tumor tissue invading the wall of the right atrium (T1) and growing from the inferior vena cava into the right atrial cavity (T2).
-
CT scan of a pericardial cyst. A well-defined apical mass (C) has the characteristic position and low attenuation of a pericardial cyst.
-
CT-guided pericardial cyst drainage. By using CT guidance, a pigtail drainage catheter was inserted into the cyst. Approximately 500 mL of clear fluid was aspirated.
-
CT scan of a pericardial cyst. After drainage, no residual fluid is noted around the pigtail catheter (arrow).
-
CT scan of a pericardial lipoma. A large, low-attenuating mass extends from the cardiac apex; this finding is characteristic of a lipoma.
-
Axial T1-weighted turbo spin-echo MRI scan of a patient with a left atrial pseudomass shows expansion (arrow) of the pulmonary vein tissue as it enters the left atrium.
-
Axial cine magnetic resonance angiogram in a patient with a left atrial pseudomass shows loss of signal intensity caused by turbulent flow (arrows) around the region of the expansion of the pulmonary vein tissue entering the left atrium.
-
Oblique 4-chamber cine magnetic resonance angiogram of a patient with a right atrial pseudomass shows a prominence (arrow) in the right atrium arising from the free wall of the right atrium. This is a prominent ridge resulting from incomplete resorption of the crista terminalis.
-
Axial T1-weighted turbo spin-echo MRI scan of a patient with a right atrial pseudomass shows a high-signal-intensity prominence (arrow) in the right atrium arising from the free wall of the right atrium, the crista terminalis.
-
Axial ECG-gated spin-echo MRI scan shows high-signal-intensity thickening (*) resulting from lipomatous hypertrophy of the interatrial septum.
-
Coronal turbo spin-echo MRI scan of a patient with a hiatal hernia. Echocardiography suggested a possible tumor mass compressing the posterior part of the heart. On MRI, the rugal folds and fluid contents of the stomach in the hiatal hernia (HH) are clearly demonstrated.