Practice Essentials
Pleural effusion can result from a number of conditions, such as congestive heart failure, pneumonia, cancer, liver cirrhosis, and kidney disease. [1] Pleural effusions are common in patients with pulmonary embolism and are correlated with higher mortality and longer hospital stays. [2]
The characteristics of the fluid depend on the underlying pathophysiologic mechanism. The fluid can be transudate, nonpurulent exudate, pus, blood, or chyle. Imaging studies are valuable in detecting and managing pleural effusions but not in accurately characterizing the biochemical nature of the fluid. [3] (Images of pleural effusion are shown below.)
Different imaging modalities can be used to diagnose and manage pleural disease. Findings on chest radiographs frequently confirm the presence of pleural effusion. Lateral decubitus projections enhance the sensitivity of conventional radiography.
Radiographic studies may not help in differentiating parenchymal processes from pleural processes. In addition, chest radiography is limited in evaluating the underlying etiology, as in differentiating benign disease from malignant pleural disease. Things to keep in mind when viewing a chest radiograph are an elevated hemidiaphragm and/or herniation, pleural thickening and/or fibrothorax, and subpleural fat.
Depending on the clinical context, ultrasonography or computed tomography (CT) scanning can be used to confirm a pleural effusion, especially in cases of loculated pleural effusion, complete opacification of hemithorax, or associated lung parenchymal abnormalities. Ultrasonography and CT scanning are more accurate than chest radiography in identifying the underlying etiology. [1, 4, 5, 6] Both modalities can depict small effusions not visualized radiographically, and they are also used to guide interventional procedures to manage pleural effusions. [7, 8, 9, 10, 11, 12, 13, 14] When viewing a CT scan, consider ascites and/or a subphrenic abscess.
Magnetic resonance imaging (MRI) is sometimes used to evaluate questionable CT findings; this modality has been reported to be more sensitive than CT scanning in differentiating benign from malignant causes of effusion. [15]
In patients with lung cancer, malignant pleural effusion raises the cancer to stage 4. Thoracic imaging is typically performed, with CT considered by many to be the gold standard. Thoracic ultrasound may also be useful if diaphragmatic or pleural thickening and nodularity can be identified. [16]
Fluordeoxyglucose positron emission tomography/CT (FDG PET/CT) can help differentiate malignant from benign pleural effusion. In one study, the sensitivities of CT imaging, FDG PET imaging, and FDG PET/CT integrated imaging in detecting malignant effusion were 75.0%, 91.7% and 93.5%, respectively. [12, 17, 18]
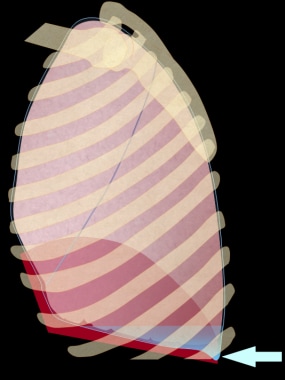 Illustration of the chest, depicted in an upright position from the lateral aspect, shows a small effusion accumulating in the posterior costophrenic (CP) sulcus. Such small effusion cannot be detected on the frontal view but can be visible on the lateral radiographic view as blunting of the posterior CP angle (blue arrow on the next image).
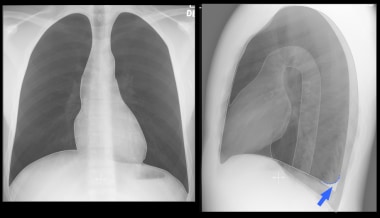 Depiction of upright posteroanterior and lateral views of the chest (using overlay on actual normal radiograph) demonstrates the radiographic appearance of small left effusion as the one in the previous image. The blue arrow points to the effusion.
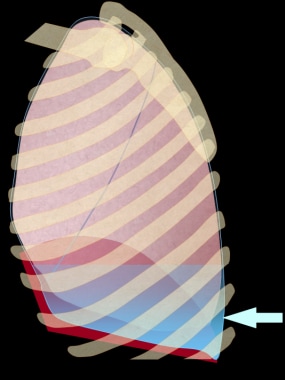 Illustration of the chest, depicted in an upright position from the lateral aspect, shows a larger small effusion accumulating in the lower chest, which can be detected on both lateral and frontal radiographic views. This effusion produces blunting of the lateral costophrenic angle on the frontal view.
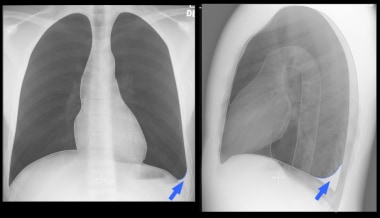 Depiction of upright posteroanterior and lateral views of the chest (using overlay on actual normal radiograph) demonstrates the radiographic appearance of a larger small left effusion as the one in the previous image. The blue arrows point to the effusions.
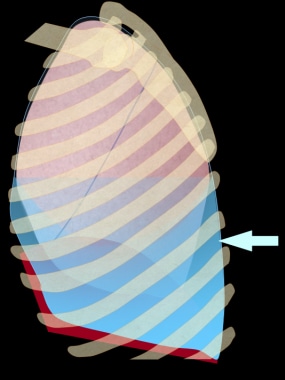 Illustration of the chest, depicted in an upright position from the lateral aspect. This image shows a moderate effusion accumulating in the lower chest, which can be seen on both the frontal and lateral views as a dependent density with meniscal-shaped margin. Note that the actual fluid upper margin is horizontal. However, there is more fluid posteriorly and laterally due to the shape of the chest and recoil characteristics of the lung.
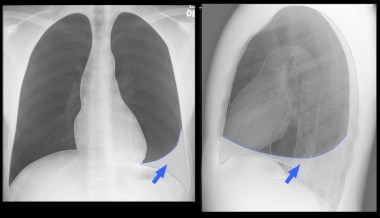 Illustration of upright posteroanterior and lateral views of the chest (using overlay on actual normal radiograph) demonstrates the radiographic appearance of a moderate left effusion, as in the previous image. The blue arrows point to the effusions.
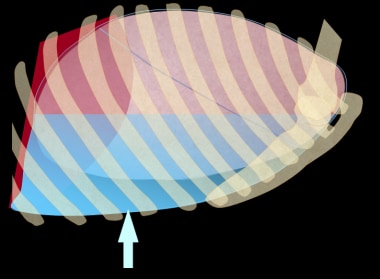 Illustration of the chest, depicted in supine position from the lateral aspect, shows a moderate effusion accumulating in the posterior aspect of the chest. This layering effusion can be visible on the frontal view as an increased haziness. The vascular structures can be seen through this density.
 Right lateral decubitus view in a 42-year-old woman with breast cancer confirms a right pleural effusion by demonstrating dependent layering of the fluid (arrows).
Radiologic intervention
The advent of ultrasonography and CT scanning and the advances in drainage catheter design and interventional techniques have made imaging-guided management of intrathoracic collections a safe and effective alternative to traditional surgical therapy. [19]
Ultrasonography or CT scanning can be used to guide thoracocentesis or catheter drainage of effusions. [20] Thoracocentesis is primarily performed under ultrasonographic rather than CT scan guidance. The use of image guidance improves the safety of the procedure and reduces the rate of complications. The small catheters are also associated with a complication rate lower than that associated with thoracotomy tubes. The use of ultrasound guidance has been shown to reduce the incidence of iatrogenic pneumothorax to as low as 0.83%. [21]
Percutaneous thoracocentesis is reportedly most successful in effusions that are ultrasonographically anechoic, complex, or complex with movable septa, as compared to echogenic or complex effusions with fixed septa. However, in one study, no correlation was found between the ultrasonographic appearance of the effusion and the success of percutaneous chest drainage.
The success rate of radiologically guided drainage procedures is 72-88%.
In a study of 458 patients with pleural effusion who underwent either standard care using pleural puncture to draw fluid or ultrasound-guided thoracentesis catheter drainage, successful drainage was higher with ultrasound-guided thoracentesis. The success rate with standard puncture was 84%, versus 100% with ultrasound-guided drainage. [1]
Radiography
Typical pleural effusion: overview
Many factors influence the radiographic findings of pleural effusion, including the nature of the fluid (free vs loculated), the amount of fluid, the patient's position, the radiographic projection, and the presence of underlying lung abnormalities. In the absence of clinically significant lung parenchymal changes, free pleural fluid tends to accumulate in the most dependent portion of the chest because of a difference in density compared with the air-filled lung. The pressure of the fluid causes atelectasis of the adjacent (dependent) lung tissue. Lung elasticity tends to preserve the shape of the collapsed lung. As a consequence, the lung collapses from the periphery toward the hilum, with a higher degree of collapse in the dependent portion of the lung.
These factors force some of the fluid to rise against gravity and surround the dependent portion of the lung. The fluid-lung interface is curved, but the upper limits of the fluid remain horizontal. The relation between orientation of the x-ray beam and the fluid surface affects the radiographic appearance of the effusion.
Typical pleural effusion: upright frontal view
A small amount of effusion accumulates in a subpulmonic location, causing slight elevation of the hemidiaphragm. As the fluid increases, the fluid starts to spill over into the most dependent costophrenic sulci. Small effusions may not be visualized on frontal views due to the orientation of the diaphragm, because the posterior costophrenic sulcus is inferior to the lateral costophrenic sulcus. Fluid accumulating posteriorly can be seen on the lateral view before it becomes visible on the frontal view (see the images below).
When the fluid is slightly above the level of the upper portion of the diaphragm, blunting of the lateral costophrenic angle is seen. This is the earliest sign of pleural effusion on the frontal view. A minimal amount of fluid (approximately 175 mL) is required to produce detectable blunting. As much as 500 mL of pleural fluid can be present without apparent changes on the frontal view.
A large free pleural effusion appears as a dependent opacity with lateral upward sloping of a meniscus-shaped contour. The diaphragmatic contour is partially or completely obliterated, depending on the amount of the fluid (silhouette sign). Differences in the depth to which the x-ray beam traverses the fluid produce the contour of the meniscus. Although the true upper limit of the fluid is horizontal, only the lateral aspect of the fluid is visible as the meniscal apex. (The apex of the meniscus can be slightly lower than the actual upper limit.) Because the fluid is laterally tangential to the x-ray beam, the depth of fluid penetration increases and consequently increases attenuation of the radiation. The depth of the fluid penetrated anteriorly and posteriorly is small, especially in the upper portion of the effusion. The attenuation is not sufficient to produce a shadow on the radiograph.
A very large pleural effusion appears as an opaque hemithorax with a mediastinal shift to the contralateral side. The mediastinal shift can be less prominent or even absent in the presence of underlying lung pathology (eg, atelectasis) or contralateral hemithorax abnormality.
(See the images below.)
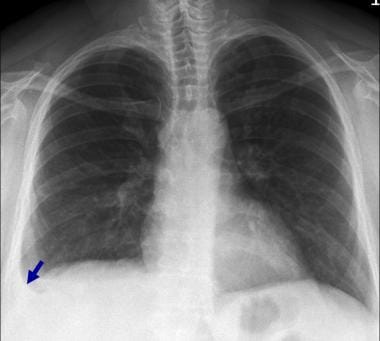 Posteroanterior chest radiograph in a 42-year-old woman with breast cancer shows blunting of the right cardiophrenic angle (arrow) with slight elevation of the right hemidiaphragm.
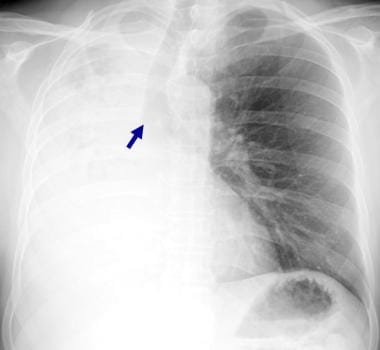
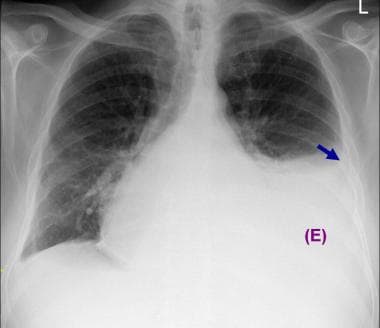 Posteroanterior chest radiograph in a 50-year-old man with non-Hodgkin lymphoma shows an opacity (E) in the lower left hemithorax with obliteration of the left hemidiaphragm and a curvilinear upper margin (arrow) and a mediastinal shift to the right. These findings are typical of a pleural effusion. In addition, minimal blunting of the right costophrenic angle is present. Cardiomegaly and a possible mediastinal mass are noted.
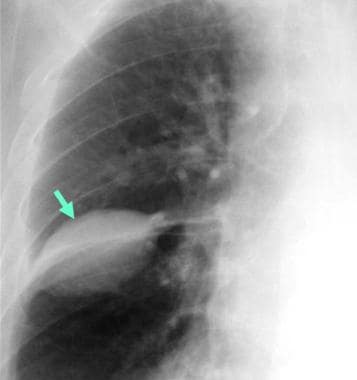 Loculated effusion in the minor fissure (arrow). The opacity is smoothly marginated and biconvex.
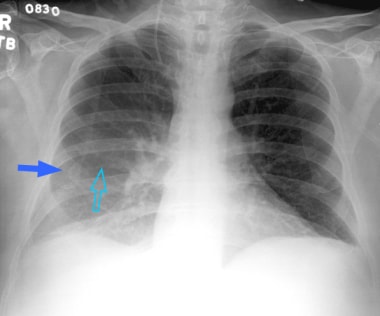
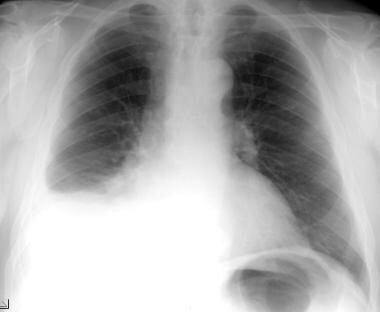 Posteroanterior chest radiograph in a 69-year-old man demonstrates right pleural effusion. No other definite abnormalities are seen.
 Posteroanterior chest radiograph in a 54-year-old man with hemoptysis demonstrates opacification of the right hemithorax with mediastinal shift to the right. In addition, an abrupt cutoff of the right mainstem bronchus is present.
Typical pleural effusion: upright lateral view
A small amount of effusion accumulates in a subpulmonary location, causing slight elevation of the ipsilateral hemidiaphragm. As the fluid increases, the amount of fluid spills over into the most dependent (posterior) costophrenic sulci. Small effusions appear as a dependent opacity with posterior upward sloping of a meniscus-shaped contour. The opacity obliterates the underlying portion of the diaphragmatic contour (silhouette sign).
(The images below demonstrate the position and appearance of pleural effusions as seen in upright lateral views.)
Illustration of the chest, depicted in an upright position from the lateral aspect, shows a small effusion accumulating in the posterior costophrenic (CP) sulcus. Such small effusion cannot be detected on the frontal view but can be visible on the lateral radiographic view as blunting of the posterior CP angle (blue arrow on the next image).
Depiction of upright posteroanterior and lateral views of the chest (using overlay on actual normal radiograph) demonstrates the radiographic appearance of small left effusion as the one in the previous image. The blue arrow points to the effusion.
Illustration of the chest, depicted in an upright position from the lateral aspect, shows a larger small effusion accumulating in the lower chest, which can be detected on both lateral and frontal radiographic views. This effusion produces blunting of the lateral costophrenic angle on the frontal view.
Depiction of upright posteroanterior and lateral views of the chest (using overlay on actual normal radiograph) demonstrates the radiographic appearance of a larger small left effusion as the one in the previous image. The blue arrows point to the effusions.
Illustration of the chest, depicted in an upright position from the lateral aspect. This image shows a moderate effusion accumulating in the lower chest, which can be seen on both the frontal and lateral views as a dependent density with meniscal-shaped margin. Note that the actual fluid upper margin is horizontal. However, there is more fluid posteriorly and laterally due to the shape of the chest and recoil characteristics of the lung.
Illustration of upright posteroanterior and lateral views of the chest (using overlay on actual normal radiograph) demonstrates the radiographic appearance of a moderate left effusion, as in the previous image. The blue arrows point to the effusions.
Large free pleural effusion appears as a dependent opacity with a meniscus-shaped contour. The highest points of the meniscus are anteriorly and posteriorly located at approximately the same level. The ipsilateral diaphragmatic contour is obliterated (silhouette sign). Variation in the depth of fluid traversed by the x-ray beam produces the contour of the meniscus. As noted, the actual upper limit of the fluid is horizontal. The anterior and posterior aspects are visible as the meniscal apices because the fluid is tangential to the x-ray beam, with increased depth of fluid penetration and attenuation. The depth of the penetrated fluid laterally is too small to produce a shadow on the radiograph, especially in the upper portion of the effusion.
A very large pleural effusion produces generalized increased opacity with obliteration of the underlying hemidiaphragm. Only 1 diaphragm on the lateral view may be a clue to a large pleural effusion. The images below demonstrate the position and appearance of pleural effusions as seen in upright lateral views.
Typical pleural effusion: supine frontal view
The normal supine view does not exclude the presence of effusion. This view is the least sensitive for detecting pleural effusions. A somewhat large amount of fluid is required to produce detectable radiographic findings, especially in bilateral effusions (see the following images).
Illustration of the chest, depicted in supine position from the lateral aspect, shows a moderate effusion accumulating in the posterior aspect of the chest. This layering effusion can be visible on the frontal view as an increased haziness. The vascular structures can be seen through this density.
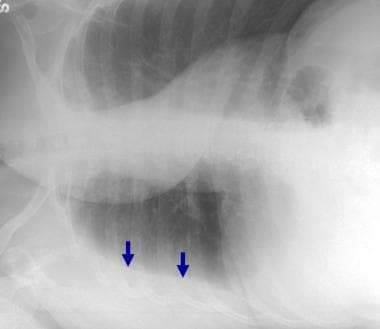
 Posteroanterior supine view of the chest in a 60-year-old man with right-sided effusion. The pleural fluid is layering, given the position of the patient. There is asymmetric density with increased haziness in the lower right hemithorax (blue arrow). Note that the pulmonary vascular structures are not obscured or silhouetted by the vague density but, rather, are still visible through it (open arrow).
In one study, a minimal volume of 175 mL was required to produce notable change on the supine radiograph. [22] The fluid accumulates in the posterior aspect of the hemithorax. The lung fluid interface is mostly in a plane perpendicular or oblique (not tangential) to the orientation of the x-ray beam. Subsequently, the effusion initially causes generalized hazy homogeneous opacity with ill-defined margins.
The opacity first projects over the lower lung zones. With further fluid accumulation, the opacity of the entire hemithorax increases, and obliteration of the diaphragm becomes obvious. Depending on the amount of the fluid and the degree of the lung collapse, lung markings (eg, vessels) can be seen through this opacity (see the image below). This finding helps in differentiating opacity secondary to effusion from one caused by lung parenchymal abnormalities, such as atelectasis or airspace disease.
Posteroanterior supine view of the chest in a 60-year-old man with right-sided effusion. The pleural fluid is layering, given the position of the patient. There is asymmetric density with increased haziness in the lower right hemithorax (blue arrow). Note that the pulmonary vascular structures are not obscured or silhouetted by the vague density but, rather, are still visible through it (open arrow).
The absence of an air bronchogram also helps in differentiation. Well-defined ipsilateral apical opacity (apical capping) is often produced, especially with large effusions. This opacity is believed to be secondary to small capacity of the lung at the apex with the extension of the fluid lateral and superior to the lung tissue. Blunting of the costophrenic angles (meniscus sign), which can be seen in more than 50% of large effusions, is attributed to accumulation of fluid about the level of the lateral costophrenic sulcus.
Typical pleural effusion: lateral decubitus view
A lateral decubitus view obtained with a horizontal x-ray beam is the most sensitive radiographic projection for detecting an effusion. [23] A small amount of fluid (10-25 mL) can be depicted on this projection. The layering fluid can easily be detected as a dependent, sharply defined, linear opacity separating the lung from the parietal pleural and chest wall (see the image below), and the parietal pleura–chest wall margin can be identified as a line connecting the inner apices of the curvature of the ribs.
Right lateral decubitus view in a 42-year-old woman with breast cancer confirms a right pleural effusion by demonstrating dependent layering of the fluid (arrows).
In some patients, especially obese patients, the parietal pleura is slightly medial to this line because of subpleural fat. This appearance is easily appreciated, because it is bilateral on frontal examination and because it persists on the nondependent hemithorax of the contralateral decubitus image.
Atypical pleural effusion: overview
Although a small effusion may accumulate first in a subpulmonary location, accumulated fluids usually spill into the posterior costophrenic sulcus.
Atypical pleural effusion: large subpulmonary effusion
A large subpulmonary effusion can be considered an atypical effusion. Unilateral subpulmonary effusion is more common on the right side. On upright frontal and lateral views, subpulmonary effusion presents as an elevated diaphragm (pseudodiaphragmatic contour).
Additional findings, which can help in suggesting the presence of effusion, include the following:
-
On the posteroanterior (PA) view: The peak of the pseudodiaphragmatic contour is more lateral than the peak of the normal diaphragm. Sometimes, thin triangular upward extension of the fluid can be seen medially on the left side.
-
On the lateral view: Frequently, the pseudodiaphragmatic contour is interrupted anteriorly by the major fissure, with a sharp descent into the anterior costophrenic sulcus. Extension of a small amount of fluid through the inferior aspect of the major fissure can be seen as well.
-
On both PA and lateral views: In contrast to the normal diaphragmatic opacity, the pulmonary vessels are poorly visualized through the pseudodiaphragmatic contour. The gastric gas lucency is widely separated (>2 cm) from the pseudodiaphragmatic contour in cases of left subpulmonic effusion.
Atypical pleural effusion: loculated pleural effusion
An atypical distribution of pleural fluid can be also caused by loculation secondary to adhesions or by lung parenchymal changes that alter the recoil characteristics of the lung. The second mechanism can occur in atelectasis. Loculation secondary to adhesions is usually secondary to an infected or hemorrhagic effusion. Loculated effusions produce peripheral soft-tissue opacity with smooth obtuse tapering margins when seen tangentially. Loculated effusion in the pulmonary fissures (demonstrated below) appears as a well-defined elliptical opacity with pointed margins.
Loculated effusion in the minor fissure (arrow). The opacity is smoothly marginated and biconvex.
Degree of Confidence
Upright chest radiography is highly sensitive in detecting pleural effusion. Lateral decubitus projections are the most sensitive radiographic images for detecting free pleural effusion. Even large, loculated or atypical effusions may demonstrate substantial gravitational movement to suggest their nature.
Pleural thickening and/or fibrothorax and subpleural fat may mimic a small pleural effusion. Subpulmonic effusion is sometimes hard to differentiate from an elevated hemidiaphragm.
Small pleural effusions can be difficult to detect radiographically. In addition, lung parenchymal abnormalities may obscure large effusions.
Computed Tomography
On CT scans, free pleural effusion presents as a crescent-shaped attenuating area in the dependent portion of the hemithorax. The lung-effusion interface has an upward concave configuration due to the recoil tendency of the lung. Because most CT examinations are performed in the supine position, the fluid starts to accumulate posteriorly in the costophrenic sulcus. With a large effusion, the fluid extends into the apical and anterior aspects of the chest and sometimes into the fissure. In the prone or lateral position, the fluid shifts to the most dependent aspect of the pleural cavity. This shift confirms the free nature of the effusion. [12, 13] (A shift in fluid can be seen in the CT scans below, as compared with radiographs from the same patient.)
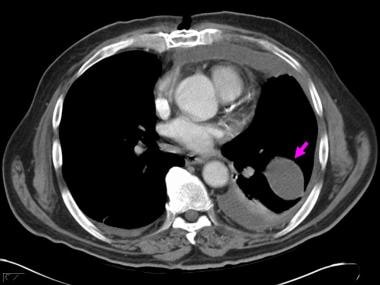
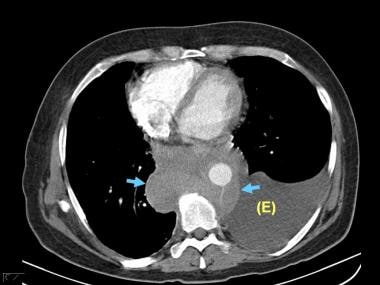 Computed tomography scan of the chest in a 50-year-old man with non-Hodgkin lymphoma shows a dependent area with attenuation similar to that of water and a curvilinear upper margin (E). These findings are typical of a pleural effusion. Note the shift in the location of the fluid on this image compared with the posteroanterior and lateral chest radiographs. Mediastinal lymphadenopathy can be seen in the middle and posterior mediastinum (arrows).
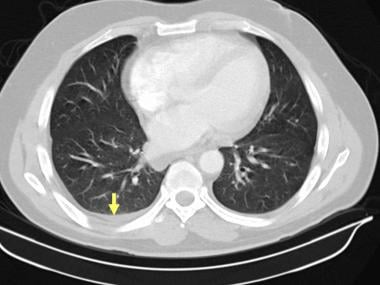 Lung window of a computed tomography scan in a 50-year-old man with non-Hodgkin lymphoma.
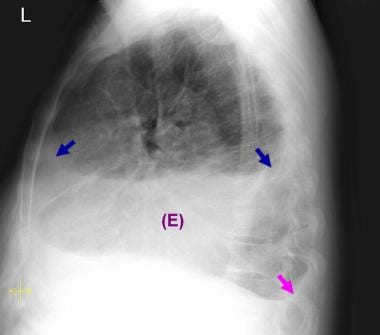 Lateral chest radiograph in a 50-year-old man with non-Hodgkin lymphoma shows an opacity (E) in the lower chest with obliteration of the left hemidiaphragm. Note the curvilinear upper margin, both anterior and posterior (blue arrows). These findings are typical of a pleural effusion. In addition, a small right pleural effusion is present (magenta arrow). The right effusion is easier to detect on the lateral view than on the posteroanterior (PA) view, because more fluid accumulates in the dependent posterior costophrenic sulcus. (Most of the fluid is under the highest level of the diaphragm, which forms the diaphragmatic contour of the PA view).
Posteroanterior chest radiograph in a 50-year-old man with non-Hodgkin lymphoma shows an opacity (E) in the lower left hemithorax with obliteration of the left hemidiaphragm and a curvilinear upper margin (arrow) and a mediastinal shift to the right. These findings are typical of a pleural effusion. In addition, minimal blunting of the right costophrenic angle is present. Cardiomegaly and a possible mediastinal mass are noted.
Lateral chest radiograph in a 50-year-old man with non-Hodgkin lymphoma shows an opacity (E) in the lower chest with obliteration of the left hemidiaphragm. Note the curvilinear upper margin, both anterior and posterior (blue arrows). These findings are typical of a pleural effusion. In addition, a small right pleural effusion is present (magenta arrow). The right effusion is easier to detect on the lateral view than on the posteroanterior (PA) view, because more fluid accumulates in the dependent posterior costophrenic sulcus. (Most of the fluid is under the highest level of the diaphragm, which forms the diaphragmatic contour of the PA view).
Posteroanterior chest radiograph in a 50-year-old man with non-Hodgkin lymphoma shows an opacity (E) in the lower left hemithorax with obliteration of the left hemidiaphragm and a curvilinear upper margin (arrow) and a mediastinal shift to the right. These findings are typical of a pleural effusion. In addition, minimal blunting of the right costophrenic angle is present. Cardiomegaly and a possible mediastinal mass are noted.
Loculated effusion (shown in the images below) is characterized by an absence of a shift with a change in position. In addition, loculated fluids are more elliptical than others and can be found in nondependent locations.
 Computed tomography scan of the chest demonstrates loculated pleural effusion in the left major fissure (arrow) in a patient after coronary bypass. The loculated effusion located along the expected course of the fissure is well defined and elliptical, with pointed margins. The fluid is similar to water in its attenuation.
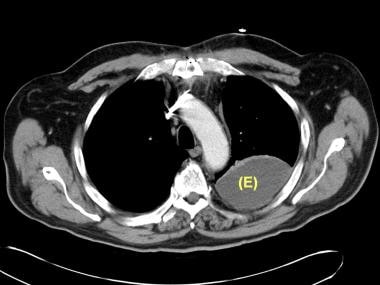 Computed tomography scan of the chest demonstrates a loculated pleural effusion (E) in the left hemithorax. The loculated effusion is well defined and elliptical and similar to water in its attenuation.
 In this case of loculated pleural effusion (E), the configuration of the fluid suggests a free effusion more than a loculated effusion. However, the lack of displacement to the most dependent portion of the hemithorax confirms the loculation. (The left image was obtained with the patient in the spinal position, and the right image was obtained in the prone position during biopsy.) Note the partial pleural thickening (arrow).
The pleural effusion usually has near-water attenuation (as seen in the following images), but its attenuation can be higher than that of water. The attenuation value of the fluid is unreliable in differentiating transudative from exudative effusions. Hemothorax is associated with heterogeneous attenuation with increased dependent attenuation; a fluid-hematocrit level can also be seen. Decreased attenuation (less than that of water) is sometimes present in chylothorax. The high protein content of the chylothorax may decrease the effect of the lower attenuation fat. However, fat attenuation on CT scans does not always indicate chylous effusion.
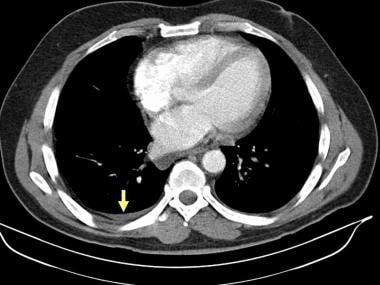 Axial computed tomography images of the lower chest in 51-year-old patient with acute lymphoblastic leukemia. A small, dependent, crescent-shaped area with attenuation similar to that of water in the right hemithorax is consistent with a tiny right pleural effusion (arrow). This effusion is most obvious on the mediastinal window.
Computed tomography scan of the chest in a 50-year-old man with non-Hodgkin lymphoma shows a dependent area with attenuation similar to that of water and a curvilinear upper margin (E). These findings are typical of a pleural effusion. Note the shift in the location of the fluid on this image compared with the posteroanterior and lateral chest radiographs. Mediastinal lymphadenopathy can be seen in the middle and posterior mediastinum (arrows).
Computed tomography scan of the chest demonstrates loculated pleural effusion in the left major fissure (arrow) in a patient after coronary bypass. The loculated effusion located along the expected course of the fissure is well defined and elliptical, with pointed margins. The fluid is similar to water in its attenuation.
Computed tomography scan of the chest demonstrates a loculated pleural effusion (E) in the left hemithorax. The loculated effusion is well defined and elliptical and similar to water in its attenuation.
Axial computed tomography images of the lower chest in 51-year-old patient with acute lymphoblastic leukemia. A small, dependent, crescent-shaped area with attenuation similar to that of water in the right hemithorax is consistent with a tiny right pleural effusion (arrow). This effusion is most obvious on the mediastinal window.
Computed tomography scan of the chest in a 50-year-old man with non-Hodgkin lymphoma shows a dependent area with attenuation similar to that of water and a curvilinear upper margin (E). These findings are typical of a pleural effusion. Note the shift in the location of the fluid on this image compared with the posteroanterior and lateral chest radiographs. Mediastinal lymphadenopathy can be seen in the middle and posterior mediastinum (arrows).
Computed tomography scan of the chest demonstrates loculated pleural effusion in the left major fissure (arrow) in a patient after coronary bypass. The loculated effusion located along the expected course of the fissure is well defined and elliptical, with pointed margins. The fluid is similar to water in its attenuation.
Computed tomography scan of the chest demonstrates a loculated pleural effusion (E) in the left hemithorax. The loculated effusion is well defined and elliptical and similar to water in its attenuation.
The less commonly seen pseudochyle (chyliform pleural effusion) can manifest as a fat-fluid or fat-calcium level. [24] The chyliform pleural effusion, which is caused by degenerating red and white blood cells in the pleural fluid, is associated with long-standing effusions, especially tuberculous empyema.
The presence of pleural thickening and enhancement suggests underlying inflammation, infection, or neoplasm. The absence of pleural thickening and enhancement is usually seen in transudative effusion. However, pleural thickening and enhancement can also be absent in effusions of early infection or metastasis. Nodular pleural thickening on chest radiographs or CT scans indicates a malignant pleural effusion. [7] (CT scan findings consistent with pleural metastasis and malignant perfusion are seen in the image below.)
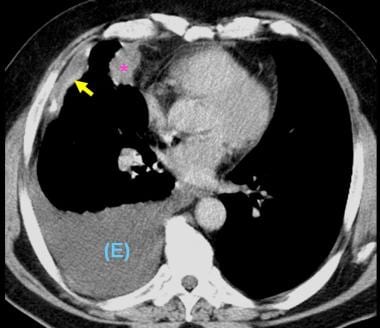 Computed tomography scan of the chest demonstrates a mass in the right upper lobe abutting the pleura (*). Irregular soft-tissue thickening of the pleural surface (arrow) and pleural effusion (E) are present. The findings are most consistent with primary lung neoplasm with pleural metastasis and malignant pleural effusion. Results of thoracentesis were positive for malignant cells (adenocarcinoma).
Degree of confidence
CT scanning is sensitive in detecting pleural effusion; however, a small effusion is sometimes hard to differentiate from pleural thickening. Contrast enhancement is helpful in separating an effusion from an adjacent lung process (airspace disease or atelectasis). Unlike pleural fluid, lung tissue enhances with the administration of contrast material. CT scanning is superior to plain radiography in evaluating the presence of loculated effusion or effusions with associated lung disease; this modality is also more helpful than plain radiography in evaluating the underlying etiology of effusion. [8]
Extrapleural fat and fat in the inferior aspect of a fissure may mimic the appearance of pleural effusion. The low attenuation of fat and the symmetry help in differentiating extrapleural fat from effusion. Pleural effusion may simulate ascites in cases of a small effusion in the posterior costophrenic sulcus, a large effusion with inversion of the diaphragmatic convexity, and lower-lobe compressive atelectasis producing a pseudodiaphragm.
Careful analysis of the sequential images (especially with scrolling on picture archiving and communications system workstations) and use of multiplanar reconstruction often helps in determining whether effusion, ascites, or both are present. Four signs assist in differentiating effusion from ascites (see the table below). [25] All of these signs should be considered in each case because they can be misleading when used individually.
Table. Summary of Distinguishing CT Scan Findings [25] (Open Table in a new window)
Finding |
Effusion |
Ascites |
Location in relation to the diaphragm |
Peripheral |
Central |
Interface with the spleen and/or liver |
Ill defined |
Sharp |
Displacement of diaphragmatic crus |
Anterior and lateral |
Posterior |
Extension posterior to bare area of the liver |
Present |
Absent |
Magnetic Resonance Imaging
MRI can help in evaluating the etiology of the pleural effusion. Nodularity and/or irregularity of the pleural contour, circumferential pleural thickening, mediastinal pleural involvement, and infiltration of the chest wall and/or diaphragm are suggestive of a malignant cause both on CT scans and MRIs.
It has been suggested that MRI signal intensity is a valuable tool for differentiating malignant from benign pleural disease. [9] Malignant pleural lesions are typically enhancing on contrast-enhanced T1-weighted images and hyperintense on proton density– and T2-weighted images. A pleural lesion with low signal intensity on images obtained with a long repetition time is a reliable and predictive sign of benign disease. Pleural calcification likely indicates a benign cause.
The signal intensity of the pleural fluids depends on their biochemical characteristics. In most cases of nonhemorrhagic or nonchylous effusions, the fluids have high signal intensity on T2-weighted images and low signal intensity on T1-weighted images.
The combination of MRI signal intensity and morphologic features is more useful than, and superior to, CT scanning in differentiating malignant from benign pleural disease. [26]
Ultrasonography
Ultrasonography is primarily used to confirm an effusion in a patient with abnormal chest radiographs and to guide interventional procedures (eg, thoracentesis, biopsy, placement of chest drains). Ultrasonography is helpful in characterizing pleural effusions and in differentiating pleural effusions and pleural thickening. This modality is also useful in evaluating some underlying causes of effusion. [27]
On ultrasonographic studies in healthy individuals, the visceral pleura can be hard to differentiate from the parietal pleura with the use of a 3.5-MHz curvilinear transducer. However, these structures can be differentiated with the use of high-frequency linear transducers. The visceral and parietal pleura slide over each other on real-time examination. Immediately medial to the visceral pleura, the air-filled lung appears as an echogenic structure, and visualization of the deep lung parenchyma is limited. [10]
The typical appearance of the pleural effusion is an anechoic layer between the visceral pleura and the parietal pleura. The shape of the effusion may vary with respiration and position. The ultrasonographic characteristics of pleural effusion (demonstrated in the images below) depend on the etiology and type of fluid, as well as on the chronicity of the collection. However, the ultrasonographic appearance of the effusion is not correlated with its biochemical characteristics. [14]
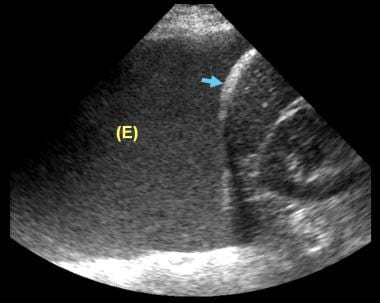
 Ultrasonogram of the left lower chest in a 47-year-old woman with metastatic pleural effusion. This sagittal study and the examination were performed with the patient seated. Anechoic fluid (E) can be seen in left hemithorax. Note the echogenic curvilinear diaphragm (arrows).
 Ultrasonogram of the left lower chest in a male patient with lymphangitic spread from adenocarcinoma. This sagittal study and the examination were performed with the patient seated. Echogenic fluid (E) can be seen in left hemithorax. Note the echogenic curvilinear diaphragm (arrow). The pleural fluid was positive for malignant cells (malignant pleural effusion).
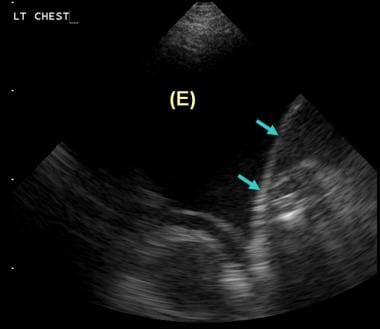
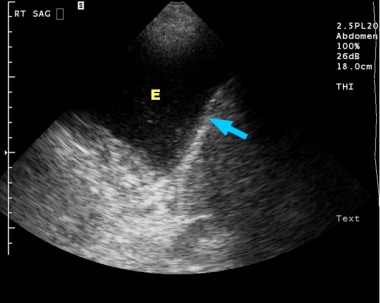 Ultrasonogram of the right lower chest in a 60-year-old man with a right pleural effusion. This sagittal study was performed with the patient seated and confirms the presence of the effusion as slightly complex but mostly anechoic (E) in the right hemithorax. Note the echogenic curvilinear diaphragm (arrow).
The classic anechoic effusion is particularly observed in transudates. In a study of 320 patients with effusion, transudates were anechoic, whereas anechoic effusions were either transudates or exudates. [28] Associated thickening of the pleura and parenchymal lesions in the lung indicated an exudate. The echogenic pleural fluid can be seen in hemorrhagic effusion or empyema. Exudates may appear anechoic, complex, or echogenic, and septa can be present. Septated, complex, or echogenic effusions are usually seen in exudative effusion, whereas malignant effusions are more commonly anechoic than echogenic. [28] The presence of adhesions in inflammatory effusions may prevent the lung from moving (sliding) over the effusion.
Color Doppler ultrasonography can help in differentiating small effusions from pleural thickening by demonstrating the fluid-color sign (ie, presence of color signal in the fluid collection). The sign is positive in pleural effusions because of the transmitted respiratory and cardiac movements. The sign has a reported sensitivity of 89.2% and a specificity of 100% in identifying small effusions. Several methods can be used to estimate the volume of an effusion by means of ultrasonography. [11]
Ultrasonographic evidence of a pleural nodule indicates malignant effusion.
Ultrasonography can be used to guide thoracocentesis or catheter drainage of effusions. [20] Thoracocentesis is primarily performed under ultrasonographic rather than CT scan guidance. The use of image guidance improves the safety of the procedure and reduces the rate of complications. The small catheters are also associated with a complication rate lower than that associated with thoracotomy tubes.
The success rate of radiologically guided drainage procedures is 72-88%.
In a study of 458 patients with pleural effusion who underwent either standard care using pleural puncture to draw fluid versus ultrasound-guided thoracentesis catheter drainage, successful drainage was higher with ultrasound-guided thoracentesis. Success rate with standard puncture was 84%, versus 100% with ultrasound-guided drainage. [1]
Nuclear Imaging
No well-established clinical indications have been defined for nuclear imaging studies in the workup of pleural effusion.
FDG PET/CT can help differentiate malignant from benign pleural effusion. In one study, the sensitivities of CT imaging, FDG PET imaging, and FDG PET/CT integrated imaging in detecting malignant effusion were 75.0%, 91.7% and 93.5%, respectively. [12, 17, 18]
Erasmus et al suggested that increased pleural fluorodeoxyglucose (FDG) uptake on positron emission tomography (PET) scanning of pleural effusions in non–small-cell lung cancer may indicate pleural metastases. [17] The investigators also suggested FDG-PET scanning may improve staging in patients with non–small-cell lung cancer and a pleural effusion. FDG-PET was 95% sensitive, 67% specific, and 92% accurate.
Sometimes, pleural effusion is an incidental finding in a study performed for another reason. Pleural effusion produces defects on both ventilation and perfusion lung scans. Malignant effusions can cause increased activity in the involved hemithorax on technetium-99m (99mTc) methylene diphosphonate (MDP) bone scans.
-
Illustration of the chest, depicted in an upright position from the lateral aspect, shows a small effusion accumulating in the posterior costophrenic (CP) sulcus. Such small effusion cannot be detected on the frontal view but can be visible on the lateral radiographic view as blunting of the posterior CP angle (blue arrow on the next image).
-
Depiction of upright posteroanterior and lateral views of the chest (using overlay on actual normal radiograph) demonstrates the radiographic appearance of small left effusion as the one in the previous image. The blue arrow points to the effusion.
-
Illustration of the chest, depicted in an upright position from the lateral aspect, shows a larger small effusion accumulating in the lower chest, which can be detected on both lateral and frontal radiographic views. This effusion produces blunting of the lateral costophrenic angle on the frontal view.
-
Depiction of upright posteroanterior and lateral views of the chest (using overlay on actual normal radiograph) demonstrates the radiographic appearance of a larger small left effusion as the one in the previous image. The blue arrows point to the effusions.
-
Illustration of the chest, depicted in an upright position from the lateral aspect. This image shows a moderate effusion accumulating in the lower chest, which can be seen on both the frontal and lateral views as a dependent density with meniscal-shaped margin. Note that the actual fluid upper margin is horizontal. However, there is more fluid posteriorly and laterally due to the shape of the chest and recoil characteristics of the lung.
-
Illustration of upright posteroanterior and lateral views of the chest (using overlay on actual normal radiograph) demonstrates the radiographic appearance of a moderate left effusion, as in the previous image. The blue arrows point to the effusions.
-
Illustration of the chest, depicted in supine position from the lateral aspect, shows a moderate effusion accumulating in the posterior aspect of the chest. This layering effusion can be visible on the frontal view as an increased haziness. The vascular structures can be seen through this density.
-
Posteroanterior supine view of the chest in a 60-year-old man with right-sided effusion. The pleural fluid is layering, given the position of the patient. There is asymmetric density with increased haziness in the lower right hemithorax (blue arrow). Note that the pulmonary vascular structures are not obscured or silhouetted by the vague density but, rather, are still visible through it (open arrow).
-
Ultrasonogram of the right lower chest in a 60-year-old man with a right pleural effusion. This sagittal study was performed with the patient seated and confirms the presence of the effusion as slightly complex but mostly anechoic (E) in the right hemithorax. Note the echogenic curvilinear diaphragm (arrow).
-
Posteroanterior chest radiograph in a 42-year-old woman with breast cancer shows blunting of the right cardiophrenic angle (arrow) with slight elevation of the right hemidiaphragm.
-
Lateral chest radiograph of a 42-year-old woman with breast cancer shows a crescent-shaped opacity is present in the posterior costophrenic sulcus (arrow). Minimal amount of fluid can be seen in the inferior aspect of the right major fissure. The findings are compatible with right pleural effusion. Some of the fluid is infrapulmonary.
-
Right lateral decubitus view in a 42-year-old woman with breast cancer confirms a right pleural effusion by demonstrating dependent layering of the fluid (arrows).
-
Follow-up posteroanterior chest radiograph in a 42-year-old woman with breast cancer shows an opacity (E) in the lower left hemithorax with obliteration of the left hemidiaphragm and curvilinear upper margin consistent with effusion. Note the extension of the fluid into the left major fissure (arrow) and mediastinal shift to the right.
-
Lateral chest radiograph in a 50-year-old man with non-Hodgkin lymphoma shows an opacity (E) in the lower chest with obliteration of the left hemidiaphragm. Note the curvilinear upper margin, both anterior and posterior (blue arrows). These findings are typical of a pleural effusion. In addition, a small right pleural effusion is present (magenta arrow). The right effusion is easier to detect on the lateral view than on the posteroanterior (PA) view, because more fluid accumulates in the dependent posterior costophrenic sulcus. (Most of the fluid is under the highest level of the diaphragm, which forms the diaphragmatic contour of the PA view).
-
Posteroanterior chest radiograph in a 50-year-old man with non-Hodgkin lymphoma shows an opacity (E) in the lower left hemithorax with obliteration of the left hemidiaphragm and a curvilinear upper margin (arrow) and a mediastinal shift to the right. These findings are typical of a pleural effusion. In addition, minimal blunting of the right costophrenic angle is present. Cardiomegaly and a possible mediastinal mass are noted.
-
Loculated effusion in the minor fissure (arrow). The opacity is smoothly marginated and biconvex.
-
Computed tomography scan of the chest in a 50-year-old man with non-Hodgkin lymphoma shows a dependent area with attenuation similar to that of water and a curvilinear upper margin (E). These findings are typical of a pleural effusion. Note the shift in the location of the fluid on this image compared with the posteroanterior and lateral chest radiographs. Mediastinal lymphadenopathy can be seen in the middle and posterior mediastinum (arrows).
-
Lung window of a computed tomography scan in a 50-year-old man with non-Hodgkin lymphoma.
-
Axial computed tomography images of the lower chest in 51-year-old patient with acute lymphoblastic leukemia. A small, dependent, crescent-shaped area with attenuation similar to that of water in the right hemithorax is consistent with a tiny right pleural effusion (arrow). This effusion is most obvious on the mediastinal window.
-
Ultrasonogram of the left lower chest in a 47-year-old woman with metastatic pleural effusion. This sagittal study and the examination were performed with the patient seated. Anechoic fluid (E) can be seen in left hemithorax. Note the echogenic curvilinear diaphragm (arrows).
-
Posteroanterior chest radiograph in a male patient with lymphangitic spread from adenocarcinoma shows bilateral interstitial opacities compatible with the patient's diagnosis. The left diaphragmatic contour is elevated (arrow).
-
Lateral chest radiograph in a male patient with lymphangitic spread from adenocarcinoma. The left diaphragmatic contour is elevated (blue arrow). Note the blunting of the posterior costophrenic angle (magenta arrow).
-
Ultrasonogram of the left lower chest in a male patient with lymphangitic spread from adenocarcinoma. This sagittal study and the examination were performed with the patient seated. Echogenic fluid (E) can be seen in left hemithorax. Note the echogenic curvilinear diaphragm (arrow). The pleural fluid was positive for malignant cells (malignant pleural effusion).
-
Posteroanterior chest radiograph in a 69-year-old man demonstrates right pleural effusion. No other definite abnormalities are seen.
-
Lateral chest radiograph in a 69-year-old man confirms a right pleural effusion. An ill-defined focal opacity projects over the inferior aspect of the retrosternal region and may represent a mass or focal area of consolidation.
-
Computed tomography scan of the chest demonstrates a mass in the right upper lobe abutting the pleura (*). Irregular soft-tissue thickening of the pleural surface (arrow) and pleural effusion (E) are present. The findings are most consistent with primary lung neoplasm with pleural metastasis and malignant pleural effusion. Results of thoracentesis were positive for malignant cells (adenocarcinoma).
-
Posteroanterior chest radiograph in a 54-year-old man with hemoptysis demonstrates opacification of the right hemithorax with mediastinal shift to the right. In addition, an abrupt cutoff of the right mainstem bronchus is present.
-
Cross-sectional computed tomography (CT) image of the chest was obtained during CT-guided biopsy. Note the dependent location of the small left pleural effusion in the anterior aspect of the left hemithorax (arrow).
-
Computed tomography scan of the chest shows a soft-tissue lesion involving the right mainstem bronchus and atelectasis of the right lung with postobstructive changes in the right lower lung. Biopsy demonstrated non–small-cell carcinoma. A right pleural effusion is present, but it was negative for malignant cells.
-
Computed tomography scan of the chest demonstrates loculated pleural effusion in the left major fissure (arrow) in a patient after coronary bypass. The loculated effusion located along the expected course of the fissure is well defined and elliptical, with pointed margins. The fluid is similar to water in its attenuation.
-
Computed tomography scan of the chest demonstrates a loculated pleural effusion (E) in the left hemithorax. The loculated effusion is well defined and elliptical and similar to water in its attenuation.
-
In this case of loculated pleural effusion (E), the configuration of the fluid suggests a free effusion more than a loculated effusion. However, the lack of displacement to the most dependent portion of the hemithorax confirms the loculation. (The left image was obtained with the patient in the spinal position, and the right image was obtained in the prone position during biopsy.) Note the partial pleural thickening (arrow).
-
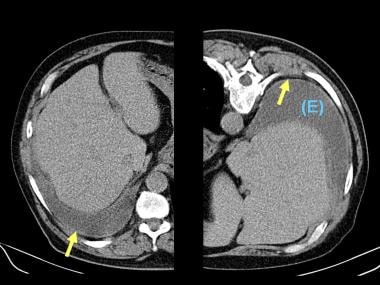
Computed tomography image at the level of the lower chest in a patient with both ascites and right-sided effusion. The next image is the same section with illustrative labeling.
-
Illustrative image representing the computed tomography section in the previous image after labeling. The ascites is marked on the right side by the blue color. The effusion is yellow, and a small portion of the right lung is pink. The diaphragm is indicated by a red arrow. Note that the interface between the effusion and the liver (yellow arrows) is less defined than the interface between the liver and ascites (blue arrows). Note that the effusion, unlike ascites, extends posterior to the bare area of the liver.
Tables
Finding |
Effusion |
Ascites |
Location in relation to the diaphragm |
Peripheral |
Central |
Interface with the spleen and/or liver |
Ill defined |
Sharp |
Displacement of diaphragmatic crus |
Anterior and lateral |
Posterior |
Extension posterior to bare area of the liver |
Present |
Absent |