Practice Essentials
Cavernous hemangioma is the most common primary liver tumor; its occurrence in the general population ranges from 0.4 to 20%, as reported by Karhunen in an autopsy series. Hepatic hemangiomas can be broadly classified as capillary hemangiomas or cavernous hemangiomas. Although the exact pathophysiology related to the development of hepatic hemangiomas remains largely unknown, hormone exposure has been postulated to cause their growth. [1] Cavernous hemangiomas arise from endothelial cells that line the blood vessels and consist of multiple, large vascular channels lined by a single layer of endothelial cells and supported by collagenous walls. These tumors are frequently asymptomatic and incidentally discovered at imaging, surgery, or autopsy. Abdominal pain and palpable mass are the most common presenting symptoms. [2] Hemangiomas are uncommon in cirrhotic livers; the fibrotic process in cirrhotic livers may prohibit their development. [3, 4, 5]
(The radiologic characteristics of hemangiomas are demonstrated in the images below.)
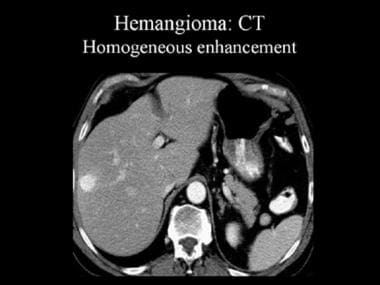 Contrast-enhanced computed tomography (CT) scan that was obtained during the arterial-dominant phase. This image demonstrates a hemangioma with homogeneous and intense contrast enhancement.
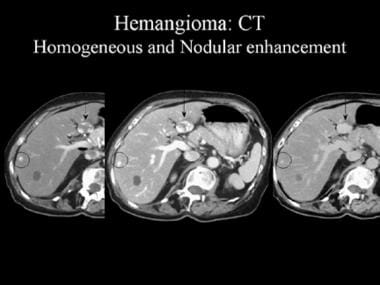 Contrast-enhanced computed tomography (CT) scan. These images reveal the pathognomonic features of a hemangioma, namely, peripheral nodular enhancement and progressive centripetal fill-in (arrow). The smaller, peripheral lesion (circled) shows homogeneous enhancement.
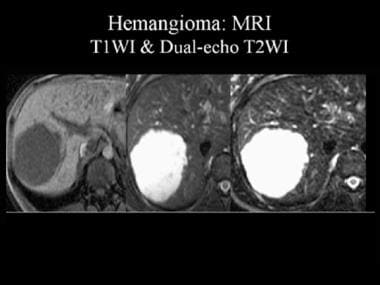 Magnetic resonance image (MRI) of a hemangioma. The lesion appears as a hypointense mass on T1-weighted MRIs (T1WI) and as a hyperintense mass on dual-echo T2-weighted MRIs (T2WI). Note that the signal intensity of the lesion is similar to that of the adjacent cerebrospinal fluid.
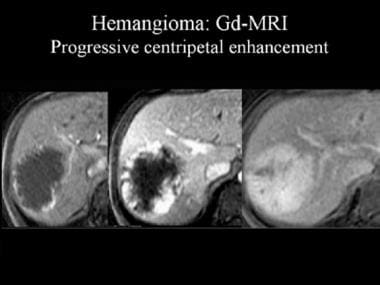 Dynamic gadolinium (Gd)-enhanced magnetic resonance images (MRIs). These images demonstrate the progressive, centripetal contrast enhancement in a hemangioma.
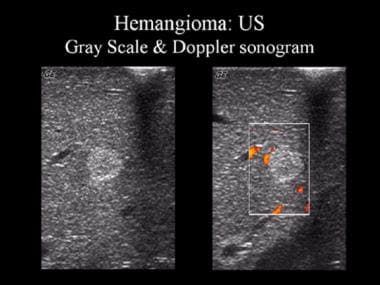 Gray-scale and Doppler ultrasonographic (US) images. These sonograms show a well-defined, uniformly hyperechoic liver mass with peripheral feeder vessels that are characteristic of a hemangioma.
Usually, cavernous hemangiomas occur as solitary lesions; however, they may be multiple in as many as 50% of patients. [6] No lobar predilection exists, and these tumors may be associated with focal nodular hyperplasia. [7] Hemangiomas typically measure less than 5 cm; those larger than 4-5 cm are sometimes called giant hemangiomas. [8, 9, 10]
Surgical resection is the most preferred treatment method, when possible. [2]
Imaging modalities
Hepatic cavernous hemangioma is the most common type of benign liver tumor. Although rupture and hemorrhage of hepatic hemangiomas are rare complications, they are associated with high mortality. Intracapsular hemorrhage of hepatic cavernous hemangioma is challenging to diagnose, and potential risk of rupture is high. Magnetic resonance imaging (MRI) is beneficial for diagnosing subacute internal hemorrhage; for patients with a definitive diagnosis, surgery is recommended. [11]
Cavernous hemangiomas are among the liver lesions most commonly encountered in abdominal imaging. Although classic imaging characteristics usually aid the radiologist in confidently arriving at this diagnosis, atypical hemangiomas can prove difficult to distinguish from other, more worrisome hepatic lesions, such as metastases and hepatocellular carcinoma. Furthermore, some malignant lesions display features that simulate hemangiomas. [12]
Most hemangiomas are incidentally detected on imaging studies. It is important to note that multiple modalities are required for definitive diagnosis. [13]
Ultrasonography is a cost-effective imaging modality for the diagnosis of hemangioma. However, computed tomography (CT) scanning and/or MRI may be required to specifically diagnose a hemangioma. [8, 14, 15, 16, 17, 18] Ultrasonography is a heavily operator-dependent technique; its performance depends on the expertise and experience of the ultrasonographer. Imaging characteristics of hemangiomas on ultrasound are not diagnostic; therefore, additional imaging is usually required. [13]
The acquisition of satisfactory images in obese patients is technically difficult. Contrast-enhanced CT scanning is relatively contraindicated in patients who have renal insufficiency and in those who have a previous history of hypersensitivity to iodinated contrast agents; thus, MRI may be the preferred modality for characterization of hemangiomas in such patients. Angiography is an invasive method used for characterization of liver hemangiomas; this imaging modality is associated with low, but definite, risks of morbidity and mortality. [14, 15, 19, 20, 21, 22, 23]
Kobayashi et al found a sensitivity of 79% and specificity of a 100% for the diagnosis of hepatic hemangioma when using contrast-enhanced ultrasonography (CEUS) with Levovist. Liver-specific findings were affected by taking early-phase ultrasonograms or by changing the posture of the patient. [19]
A retrospective study of tumor classification by Cao et al reported that use of a convolutional neural network model for identifying hepatic cavernous hemangioma and hepatocellular carcinoma improved the accuracy of diagnosis on noncontrast CT images. [24]
Computed Tomography
Hemangiomas are enhancing lesions that have characteristic dynamic features after administration of contrast material. On nonenhanced CT scans, hemangiomas appear hypoattenuating relative to adjacent liver. Calcification is uncommon; it may be marginal or central, spotty or chunky. [25] During the arterial-dominant phase, small hemangiomas show intense and uniform contrast enhancement; they retain their contrast enhancement during the portal venous phase. [7, 14, 26, 27] (See the image below.)
Contrast-enhanced computed tomography (CT) scan that was obtained during the arterial-dominant phase. This image demonstrates a hemangioma with homogeneous and intense contrast enhancement.
Wedge-shaped subcapsular or segmental perilesional enhancement may be noted adjacent to high-flow hemangiomas. These findings may be due to hemodynamic alterations in the liver. [28] The pattern of peripheral, discontinuous, intense nodular enhancement during the arterial-dominant phase with progressive centripetal fill-in on CT scans is considered pathognomonic for hemangioma (see the image below). Pathologically, nodular areas consist of small vascular spaces that are more densely packed than the rest of the lesion.
Contrast-enhanced computed tomography (CT) scan. These images reveal the pathognomonic features of a hemangioma, namely, peripheral nodular enhancement and progressive centripetal fill-in (arrow). The smaller, peripheral lesion (circled) shows homogeneous enhancement.
Atypical features of hemangioma include the presence of arterioportal shunts and capsular retraction. [8, 29] Rarely, a centrifugal pattern of contrast enhancement is seen. [30]
Degree of confidence
A globular enhancement pattern on CT scanning (analogous to contrast-agent puddling on angiograms) is considered a highly sensitive (88%) and specific (84-100%) feature of hemangioma. [31, 32]
Hemangiomas that show early, homogeneous contrast enhancement on dynamic CT and/or MRI may be mistaken for other hypervascular liver tumors, such as hepatoma, focal nodular hyperplasia, adenoma, and hypervascular metastases. The absence of a history of cirrhosis and/or primary malignancy is an important factor in diagnosing hemangioma. The characteristic features of a hemangioma on dynamic CT scanning, red blood cell scintigraphy, and/or MRI permit confident diagnosis in more than 95% of cases.
Magnetic Resonance Imaging
Magnetic resonance imaging (MRI) is more sensitive and specific than other imaging modalities in the diagnosis of hemangioma. Hemangiomas appear as smooth, lobulated, homogeneous, sometimes septated, hypointense lesions on T1-weighted images. On T2-weighted images, they appear hyperintense relative to the liver (ie, more pronounced on fast spin-echo images), and they remain as bright as cerebrospinal fluid or bile with increased echo time (TE). [15, 16, 27, 33] (See the image below.)
Magnetic resonance image (MRI) of a hemangioma. The lesion appears as a hypointense mass on T1-weighted MRIs (T1WI) and as a hyperintense mass on dual-echo T2-weighted MRIs (T2WI). Note that the signal intensity of the lesion is similar to that of the adjacent cerebrospinal fluid.
The high signal intensity on T2-weighted images is due to the extremely long T2 relaxation time of free fluid (ie, slowly moving blood). The T2 relaxation time is directly proportionate to the collective size of the hemangioma's constituent vascular spaces. [34] T2 values for hemangiomas vary between 90 and 200 msec, compared with T2 values greater than 300 msec for cysts.
Rarely, imaging features of heavily fibrotic (hyalinized) hemangiomas can be mistaken for those of metastases. [35] With injection of contrast material (gadolinium chelates), lesions typically demonstrate peripheral nodular enhancement with progressive, centripetal fill-in that usually appears after 5-30 minutes. (See the image below.)
Dynamic gadolinium (Gd)-enhanced magnetic resonance images (MRIs). These images demonstrate the progressive, centripetal contrast enhancement in a hemangioma.
Large hemangiomas may appear cystic on images as a result of recurrent hemorrhage or myxomatous degeneration. In some hemangiomas, MRI may demonstrate fluid-fluid levels due to sedimentation of blood products. The supernatant layer consists of unclotted serous blood, and the sediment consists of red blood cells. Definitive diagnosis is often difficult. [36]
Gadolinium-based contrast agents have been linked to the development of nephrogenic systemic fibrosis (NSF) or nephrogenic fibrosing dermopathy (NFD). This disease has occurred in patients with moderate to end-stage renal disease after they were given a gadolinium-based contrast agent to enhance MRI or magnetic resonance angiography (MRA) scans. NSF/NFD is a debilitating and sometimes fatal disease. Characteristics include red or dark patches on the skin; burning, itching, swelling, hardening, and tightening of the skin; yellow spots on the whites of the eyes; joint stiffness with trouble moving or straightening the arms, hands, legs, or feet; pain deep in the hip bones or ribs; and muscle weakness.
Degree of confidence
MRI is more sensitive and specific than other imaging modalities for the diagnosis of hemangioma. On the basis of liver hemangioma characteristics on T2-weighted images (morphologic and quantitative T2 values), MRI has a sensitivity of 100%, a specificity of 92%, and an accuracy rate of 97%.
Hemangiomas that show early, homogeneous contrast enhancement on dynamic CT scanning and/or MRI may be mistaken for other hypervascular liver tumors, such as hepatoma, focal nodular hyperplasia, adenoma, and hypervascular metastases. Absence of a history of cirrhosis and/or primary malignancy is an important factor in diagnosing hemangioma. The characteristic features of a hemangioma on dynamic CT scanning, red blood cell scintigraphy, and/or MRI permit confident diagnosis in more than 95% of cases.
Ultrasonography
On ultrasonography, hemangiomas appear as well-circumscribed, uniformly hyperechoic lesions (see the image below). Increased echogenicity has been postulated to be caused by multiple interfaces between walls of the cavernous spaces and the blood within them. [37]
Gray-scale and Doppler ultrasonographic (US) images. These sonograms show a well-defined, uniformly hyperechoic liver mass with peripheral feeder vessels that are characteristic of a hemangioma.
Hepatic hemangiomas appear homogeneously hyperechoic on ultrasound, with distinct margins and posterior acoustic enhancement. Although cavernous hemangiomas appear as well-defined hypodense lesions on precontrast CT images with the same density as the vasculature, one of the most reliable imaging features for diagnosing cavernous hemangiomas is high signal intensity on T2-weighted images. Although most hepatic hemangiomas are asymptomatic, some patients present with pain or compressive symptoms; bleeding/rupture is very rare. [1]
In a study by Taboury et al, more than 75% of hemangiomas had posterior acoustic enhancement that the authors believed was correlated with hypervascularity at angiography. [38] In large hemangiomas, heterogeneous areas are interspersed within the hyperechoic mass. Atypical features include hypoechoic lesions with a thin hyperechoic rim or a thick rind and scalloped borders. [7] Note that hemangiomas may appear hypoechoic in the fatty liver. [39]
Color power or duplex Doppler ultrasound examinations have a limited role in the specific diagnosis of hemangioma. [40] Occasionally, a kilohertz shift in the low to mid range may be observed in peripheral and central blood vessels of hemangiomas. [20]
Nuclear Imaging
Red blood cell–tagged technetium-99m (99mTc) scintigraphy with single-photon emission CT (SPECT) scanning permits a specific diagnosis of hemangioma. [41] Hemangiomas characteristically show decreased activity on early dynamic images and delayed filling from the periphery of the lesion.
This modality shows similar sensitivity to MRI for lesions greater than 1 cm but has not been proven to have the same diagnostic value. Hemangiomas reveal hypoperfusion or a focal defect during the early dynamic scan, with increased tracer uptake peaking approximately 30-50 minutes post injection. The tracer remains within the lesion on delayed-phase images. False-negatives may occur secondary to fibrosis or thrombosis. [13]
Reported sensitivity is 97%, specificity 83%, and accuracy 96% for red blood cell–tagged 99mTc scintigraphy in the diagnosis of hemangioma.
Angiography
On angiography, the feeding vessels of the hemangioma are of normal caliber, except those in large tumors. During late arterial/hepatic parenchymal phases, a dense, nodular pattern of opacification of dilated vascular spaces persists into the venous phase. [42]
Although hemangiomas have characteristic angiographic features, the use of angiography is not warranted for the diagnosis of hemangioma, given the diagnostic capabilities of less invasive techniques such as helical CT scanning and MRI.
-
Contrast-enhanced computed tomography (CT) scan that was obtained during the arterial-dominant phase. This image demonstrates a hemangioma with homogeneous and intense contrast enhancement.
-
Contrast-enhanced computed tomography (CT) scan. These images reveal the pathognomonic features of a hemangioma, namely, peripheral nodular enhancement and progressive centripetal fill-in (arrow). The smaller, peripheral lesion (circled) shows homogeneous enhancement.
-
Magnetic resonance image (MRI) of a hemangioma. The lesion appears as a hypointense mass on T1-weighted MRIs (T1WI) and as a hyperintense mass on dual-echo T2-weighted MRIs (T2WI). Note that the signal intensity of the lesion is similar to that of the adjacent cerebrospinal fluid.
-
Dynamic gadolinium (Gd)-enhanced magnetic resonance images (MRIs). These images demonstrate the progressive, centripetal contrast enhancement in a hemangioma.
-
Gray-scale and Doppler ultrasonographic (US) images. These sonograms show a well-defined, uniformly hyperechoic liver mass with peripheral feeder vessels that are characteristic of a hemangioma.