Measuring Outcomes In Rehabilitation Medicine
Functional assessment is a relatively new term. A gerontologist in Philadelphia, A Powell Lawton, wrote the first definition in 1970. He said that functional assessment was any systematic attempt to objectively measure the level at which a person is functioning in a variety of domains. [1]
Functional assessment as a scientific endeavor has not been easily accepted. In fact, during the 1970s, most clinicians regarded functional assessment as an effort to measure the unmeasurable. By the 1980s, however, outcome measurement started to gain general interest, and by the late 1980s, medical rehabilitation practitioners recognized functional assessment as a means for measuring outcomes in medical rehabilitation. Through the 1990s, efforts were made to predict the relationship between doses of therapy and patient responses, including cost-effectiveness. This work is ongoing. [2, 3, 4, 5, 6]
Verbal descriptions of improvements in the functions of persons with disabilities have been customary since rehabilitation medicine came into its own after World War II. However, this method of keeping records has lacked the consistency needed for making comparisons among patients and for tracking changes in patients over time to study their rehabilitation outcomes.
Research showed that functional assessment could be developed into a science to provide the tools for understanding the "biology of disability," a term that refers to the fact that certain patterns of response to disability may be dominant and, therefore, may be expected for people who experience the consequences of disability. The concept of the biology of disability is important for clinicians to understand so that they can distinguish patterns of expected functional limitations from unexpected functional limitations.
Much of the conceptual background for understanding the components of disablement has come from the work of Phillip Wood, a rheumatologist and epidemiologist from Manchester, United Kingdom. He wrote the 1980 World Health Organization (WHO) report that first identified the consequences of illness. First there is disease, or the pathophysiologic processes. Next is impairment, or the manifest deficit in organs and organ systems, in terms of anatomy, biochemistry, psychology, and functional limitations. Then there is disability, or the behavioral and performance deficits of the patient. Finally, there is handicap, or the physical and social disadvantages imposed by society.
The key to documenting disability is to record how well patients perform activities of daily living (ADL). The concept is so important that this author has developed a related motto: As we function, so shall we live.
Functional assessment scales
Functional assessment scales should be scientifically proven as valid and reliable, and also efficient to use in the clinical setting. Most functional assessment scales were created over the last few decades for adult and pediatric medical rehabilitation patients to measure disability and disease progression, and to monitor rehabilitation treatment progress. Instruments should document changes in health and functioning as an initial, interim, and final status.
Some scales are proprietary, requiring owner permission and training for use. This helps ensure that the scales are used properly and with the appropriate patients, so that accurate information comes from the assessment process. This is important for each patient’s care, and also for the aggregated patient information deposited into databases for research purposes in support of evidence-based practices.
A way of looking at types of functional assessment scales is from specific to general. The specific are the activities of daily living scales, which measure the performance of basic functional skills required to care for oneself independently, such as eating, grooming, bathing, dressing, locomotion, transfers, and continence, and may also measure cognitive abilities. Clinicians rate how independent or dependent patients are in performing these functional tasks. Examples are the Barthel Index, which measures motor function, and the FIM ® (Functional Independence Measure) instrument (herein referred to as FIM), which is based on the Barthel Index and adds cognition items. Measuring cognitive impairment along with motor impairment becomes important with certain medical conditions, especially brain injury/dysfunction and stroke.
Also specific are neurologic scales that document the progression of a particular disease, and these scales sometimes include functionality measurements.
At the other extreme are the general quality of life scales, which address a wide range of concerns and capabilities (eg, pain and emotional state). These use a subjective approach, with patients self-reporting their current and previous states of functional health. Examples are the Sickness Impact Profile and the LIFEwareSM System. Between specific and general are the instrumental activities of daily living scales, which measure abilities to accomplish secondary functional activities in the home, such as preparing meals, doing housework, and using a telephone. An example is the Older Americans Resources and Services Multidimensional Functional Assessment Questionnaire, which addresses mental and physical health and social and economic resources.
Numerous scales are used in rehabilitation and neurologic clinical settings to measure functionality and disease progression. About half the patients in rehabilitation have chronic neurologic disease, including stroke, brain dysfunction, spinal cord dysfunction, debility, and other neurologic conditions, such as multiple sclerosis. (See Impairment Types.) Some scales are appropriate for a range of medical conditions, while others are disease-specific, such as those developed especially for patients with multiple sclerosis, amyotrophic lateral sclerosis, stroke, neuropathy, headache, and traumatic brain injury. Pediatric scales assess development of various functions, including growth, intelligence, behavior, and language, usually for specific age groups. The following are examples of regularly used scales.
Barthel index
The Barthel Index, mentioned earlier, is easy to use in the clinical setting, has 10 functional motor items and no functional cognition items, and has limitations with regard to types of patients for which it is useful. A stroke patient, for example, can have a perfect Barthel Index score, yet have severe cognitive deficits. [7]
A multicenter, retrospective cohort study by Morishima et al indicated that the assessment of pretreatment functional status in young to middle-aged patients with cancer may aid in determining their prognosis. Using the Barthel Index, a functional assessment of activities of daily living was made for patients aged 18-69 years, prior to cancer therapy, with the investigators finding that individuals with moderate or severe functional disability had a significantly increased mortality risk. The adjusted hazard ratios for patients with gastric, colorectal, or lung cancer who had moderate disability were 1.44, 1.35, and 1.74, respectively, while those for patients with severe disability were 3.56, 2.37, and 2.34, respectively. [8]
FIM instrument
The 18-item FIM instrument, also mentioned earlier and described in detail in other parts of this article, is the most widely used medical rehabilitation instrument and measures both motor and cognitive disablement. The FIM instrument is used in inpatient rehabilitation hospitals, skilled nursing facilities, and for treatment trials.
NIHSS
The National Institutes of Health Stroke Scale (NIHSS) tests the neurologic status of stroke patients at baseline and 3-month follow-up to determine drug treatment effectiveness. The NIHSS has 15 items related to consciousness; orientation; speech/verbal communication; eye movement/eyes and head shift; facial palsy; gait; and aspects of arm, hand, leg, and foot movement and tone.
A literature review by Lu et al indicated that in patients who have suffered basilar artery occlusion, the 90-day functional outcome following mechanical thrombectomy can be predicted by the presenting NIHSS score. Independent prediction of a favorable outcome was associated with a lower score. [9]
EDSS
Kurtzke’s Extended Disability Status Scale (EDSS) is considered the standard for following patients with multiple sclerosis (MS), including those in MS clinical research, even though MS is difficult to assess because of the differences in signs and symptoms. The EDSS has measurement subscales, including pyramidal, cerebellar, brainstem, sensory, bowel and bladder, visual, cerebral, mobility, self-transfer, and death from MS.
Multiple Sclerosis Functional Composite
The Multiple Sclerosis Functional Composite combines several tests and has been shown to be more sensitive to change than the EDSS when used in pharmaceutical trials.
Timed Up and Go
The Timed Up and Go is a test of mobility, safety, and fall risk for the frail elderly. It measures the time needed to get up from a chair, walk 3 m, return, and sit down.
Medical Outcomes Study Short Form 36 Health Survey
The Medical Outcomes Study Short Form 36 Health Survey (SF-36®), considered a quality of life scale, is an indicator of a patient’s perceived health status. The SF-36® has sub-scales measuring physical functioning, role limitations, pain, health perceptions, vitality, social functioning, and emotional/mental health.
Bayley Scales of Infant Development
The Bayley Scales of Infant Development®-Third Edition (Bayley-III®), for infants aged 1 month to 3.5 years, measures motor, mental, and behavioral development, and the scores are converted to age equivalents. [10, 11]
WeeFIM
The WeeFIM ® instrument, adapted from the adult FIM instrument, rates adaptive, gross/fine motor, personal/social, and cognition skills for children 6 months to 7 years old, but can also be used for some older children. A WeeFIM II® System: 0-3 Module is more sensitive to disablement in children aged 0-3 years.
International Classification of Functioning
Mention is made here of the World Health Organization’s International Classification of Functioning, Disability, and Health (ICF), which appears on some lists of scales. The ICF is a valuable tool for understanding the medical model of disability combined with the social model. As a large conceptual framework but not a measurement system, its application at this time is limited; therefore clinicians must rely on scales that are scientifically tested, efficient, and use the existing language in the rehabilitation and neurologic disciplines.
UDSMR
A new standard system was needed to describe and quantify function in persons with disabilities. The Uniform Data System for Medical Rehabilitation (UDSMR®) was established in 1987 after many years of research to meet this need. [12] This system, used by clinicians in rehabilitation settings, has proven useful around the world to patients, clinicians, and health care payers.
UDSMR is a not-for-profit data management service (a division of UB Foundation Activities, Inc), which also provides such ancillary services as training in the use of its instruments and related data analysis and reporting systems. UDSMR is supported financially by the subscribing medical rehabilitation facilities. This service takes in data and returns information. Facilities subscribing to USDMR are found in the United States and several other countries, including New Zealand, Norway, France, Australia, Canada, South Korea, Singapore, Chile, Estonia, Finland, Uruguay, Qatar, Saudi Arabia, Spain, Switzerland, United Kingdom, Hong Kong, Iceland, Israel, Italy, Lithuania, and Mexico.
Development of the UDSMR and the FIM Instrument
"Once outcomes become measurable, they become manageable." This is another saying coined by this author to condense a lengthy explanation of the applicability of a medical rehabilitation measurement system. The UDSMR was created within the walls of a university medical school, but it functions in rehabilitation settings. It is a complex computerized system of data collection, analysis, and reporting. The purpose of this system is to set the course toward better health care by showing the benefits and efficiency of care.
The restorative patient is typically in an intensive program of medical rehabilitation. Such a patient has lost functional ability subsequent to illness or injury, is near medical stability, and has potential for significant practical recovery of lost abilities. Stroke, orthopedic disorders, and cardiac disorders predominate among restorative patients. Patients also enter rehabilitation facilities as a result of a variety of other illnesses and injuries, including spinal cord injury, traumatic brain injury, [13] amputation, and multiple sclerosis. Patients with the latter group of conditions usually have the goal of maintaining a residual level of function rather than of restoring function.
UDSMR and its FIM instrument were developed to enable clinicians and administrators in rehabilitation facilities to document the severity of patient disability and measure outcomes of medical rehabilitation in a uniform way. [14, 15] To accomplish this, a common language had to be established to discuss disability across the rehabilitation disciplines, including medicine, nursing, physical therapy, and occupational therapy, providing a basis for comparing rehabilitation outcomes.
At this time, 7 types of major settings provide postacute care rehabilitation services:
-
Comprehensive medical rehabilitation unit and facility
-
Skilled nursing facility
-
Skilled nursing facility with a subacute unit
-
Long-term acute care hospital
-
Outpatient facility
-
Home care
-
Adult day services
The FIM instrument was designed for adult rehabilitation patients and is used with a computerized analysis and reporting system. For more than 2 decades the FIM instrument and its reporting and analysis systems were used in the various rehabilitation settings. The FIM instrument also has been embedded in a tool used by the federal government to allow comprehensive inpatient rehabilitation facilities to meet the mandated prospective payment system. (Discussion on this topic follows.) Additional instruments and systems were spun off from the FIM instrument for use with different populations in different care settings. UDSMR currently offers the following to facilities on a subscription basis:
-
AlphaFIM® instrument (adult acute-hospital inpatients)
-
LIFEwareSM System (adult outpatients)
-
The FIM System® for Home Care (adult home care patients)
-
UDS-PRO® system (comprehensive medical rehabilitation facilities)
-
UDS-PROi® ™ product (comprehensive medical rehabilitation facilities)
-
FIM instrument, The FIM System® subscription, and FIMware® software (subacute units, skilled nursing facilities, nursing homes)
A major change occurred on January 1, 2002, in the comprehensive inpatient medical rehabilitation industry. The Centers for Medicare and Medicaid Services (CMS) implemented a Congressional mandate to take medical rehabilitation from the long-standing, cost-based payment system to a prospective payment system, the latter system having already been in use for other types of medical facilities. [21] This prospective payment system is for facility reimbursement for Medicare Part A services, which covers a significant portion of medical rehabilitation, for elderly and disabled persons. The CMS created the Inpatient Rehabilitation Facility-Patient Assessment Instrument (IRF-PAI), which has been in use since January 1, 2002. The FIM instrument is the centerpiece of the IRF-PAI, with some modifications having been made to the instrument (described later in this section).
For the first time, payment for Medicare Part A inpatient rehabilitation services became tied to the level of severity of the patient's functional status at the time of admission.
The original FIM instrument still is used in other types of rehabilitation facilities, such as skilled nursing facilities and subacute units, for measurement of outcomes, not for payment purposes. These facilities also use such instruments as the Minimal Data Set Version 2 (MDS-2) and OASIS. (These are not UDSMR instruments.)
A report by Eisenstadt et al on an FIM improvement program performed in the inpatient rehabilitation unit of an acute care hospital indicated that FIM scoring accuracy can be increased through the use of concurrent FIM audits, transparent results reporting, individual accountability, and the use of available technology. [22]
A study by Lequerica et al suggested that for non-English-speaking patients with moderate to severe traumatic brain injury, systematic bias may exist in the FIM communications ratings. The study, which involved 2795 traumatic brain injury patients, found that those who did not speak English tended to have worse functional communication outcome ratings than did patients who spoke English as their primary language. [23]
All UDSMR® instruments and their analysis and reporting systems were designed to link individuals and groups of patients, from pediatric to geriatric, through various rehabilitation settings. (See Continuum of Care for a discussion.) Data are sent to UDSMR by subscribing medical rehabilitation facilities. Confidential reports are returned to the facilities by UDSMR. These reports show a wealth of information about the facility and display aggregated information on other facilities in the region and nation so that each facility can see how it stacks up. The purpose of this service is to take in data and return information.
The model that typifies medical rehabilitation is characterized by the situation of a previously independently functioning adult who becomes disabled by disease or injury. The patient is stabilized in the acute care hospital and may recover some functional abilities, but recovery is not sufficient to return to community living, which is the ultimate goal. At the point the patient is deemed to have the potential for significant functional improvement, transfer is made to a rehabilitation setting, where therapies are prescribed.
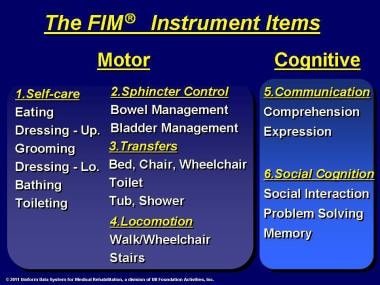
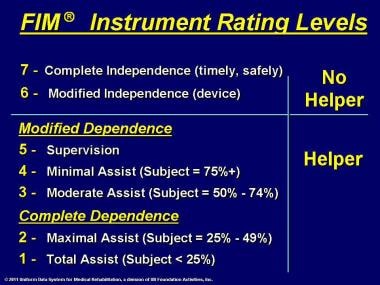
Upon the patient's arrival in an inpatient rehabilitation setting, the FIM instrument is used to document the patient's independent functioning in 18 ADL: 13 motor items covering self-care, sphincter control, transfers, and locomotion, and 5 cognition items covering communication and social cognition. In each activity, the patient is observed by a clinician (usually a nonphysician clinician) and is rated in levels of dependence and independence, with a rating of 1 reflecting total assistance needed by a helper or device (or longer time to perform the activity). The highest rating, 7, reflects complete patient independence.
For inpatient medical rehabilitation facilities only, the FIM instrument was slightly modified when it was embedded in the federal government's IRF-PAI. A code of zero was added to cover an activity that did not occur during the admission assessment period. The assessment periods at admission and discharge were redefined, such that the time frames for admission and discharge assessments, respectively, now are the first 3 days and any 1 of the last 3 days of the hospital stay. If differences in function occur in different environments or at different times of the day, clinicians record the lowest (most dependent) rating. The period of program interruption has been changed from 30 days to 3 days. Function modifiers were added for certain items: bowel, bladder, locomotion, and tub/shower transfer. Item level definitions were modified for bladder and bowel.
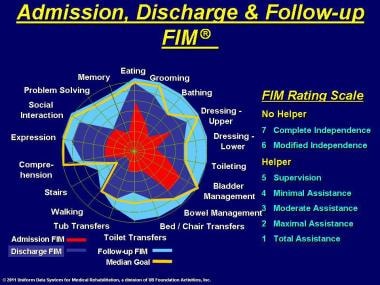
In the FIM instrument, numbers from 1 to 7 are assigned descriptors to designate levels of minimal, moderate, and maximal assistance needed by a patient. A FIM instrument rating at level 3, or moderate assistance, means that the effort of the task is shared equally between the patient and the helper. Patients' total-FIM instrument ratings range from a low of 18 (dependent) to a high of 126 (independent); see the images below. The FIM instrument is used again at discharge and follow-up, with changes being noted. The instrument also may be used at appropriate times during the stay.
Dividing the gain in FIM instrument points by the days of stay provides a measure of efficiency, or the average number of FIM instrument points gained per day. Quarterly reports are sent by UDSMR to subscribing facilities, whether they use the FIM instrument or the IRF-PAI, which analyze the rehabilitation process for effectiveness and efficiency. Effectiveness suggests how well the rehabilitation worked. Did the patient improve function? Did the burden of care decline? Did the patient return to the community? Efficiency measures how inexpensively the rehabilitation services were delivered. Medical rehabilitation is time intensive; therefore, time is an important measure in considering cost-effectiveness. Length of stay (LOS), a way of expressing cost of care, is included in the quarterly reports. Facility managers then can make changes or reinforce current processes.
The user-friendly UDS-PRO® system and FIMware® software are provided to subscribers for data submission. National and international databases are maintained for comparing outcomes across facilities. Subscribing US facilities are compared in the quarterly reports to appropriate, similar regional and national facilities.
An important feature of the UDS-PRO® system and FIMware® software is the generation of a pictorial representation, or function-level profile, of a patient across the 18 FIM instrument motor and cognition activity items. See the image below.
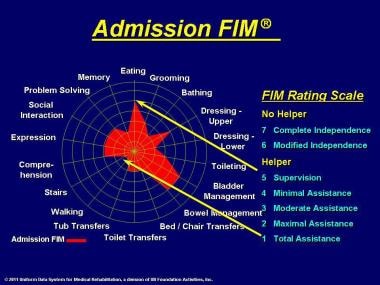
The innermost tiny circle represents the most dependent state, and the outermost circle represents the most independent state. The red area shows a patient with significant limitations across all items at admission.
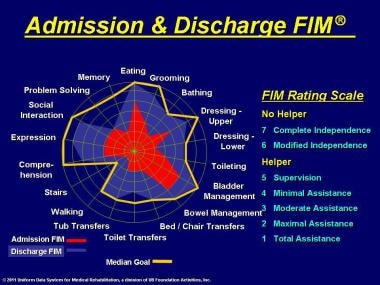
In the image below, note the overlay of a yellow goal line that is derived from the median of ratings achieved by discharge for patients with the same impairment and similar severity of disability. The blue area shows a profile of the patient's status at the time of discharge. Some of the item goals have been met.
By follow-up (see the image below), usually 80-180 days after discharge, the turquoise-color area on the profile shows that the patient has generally exceeded the goals. Those functional areas in which the patient has not achieved full independence imply that the community must make accommodations, family care must be provided, or architectural modification must be made to compensate for the deficits in independent functioning.
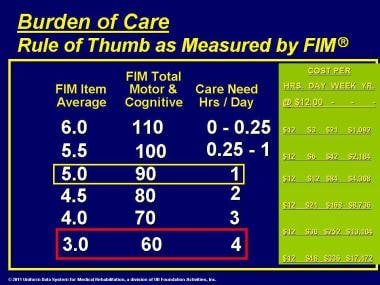
The FIM instrument approximates the burden of care
Burden of care can be approximated using the FIM instrument. An average FIM instrument item rating of 3 or a total-FIM instrument rating of 60 is equivalent to the patient's needing help from another person for approximately 4 hours per day, each and every day of the year, just to perform basic personal care activities. This figure is without consideration of other kinds of needs, such as domestic chores or medical care. A total-FIM instrument rating of 60 is common for many patients at the time of admission to an inpatient rehabilitation program.
Generally, a total-FIM instrument rating of 80-90 is equivalent to a need for 1-2 hours of help each day from another person to perform personal care activities. Usually, this figure represents the level at which discharge to the home is manageable by family members.
When the hours of help needed per day are translated into wages for the assisting person, say, at the rate of $12 per hour, then expenses for a patient with a total-FIM instrument rating of 90 might be $84 per week or $4,368 per year. Assistance for a patient with a total-FIM instrument rating of 60 might cost $48 per day, $336 per week, or $17,472 per year.
The differences in the above examples of burden of care may appear minor on the basis of a day or a week; however, when viewed over a year, the differences are substantial. Remember that dependence can last for several years. In practice, on average, patients with spinal cord injury are admitted with a motor-FIM instrument rating of 32 and are discharged with a motor-FIM instrument rating of 56. This translates into a reduction of 200 minutes per day in help required. On average, patients who have sustained a stroke are admitted with a motor-FIM instrument rating of 42 and are discharged with a motor-FIM instrument rating of 60, resulting in a reduction of 130 minutes per day in help required.
Impairment Types
The distribution of impairment types in the UDSMR ® database (UDS-PRO ® data) for 2007 for adult inpatient medical rehabilitation was as follows:
-
Orthopedic conditions - 34.7%
-
Stroke - 21.9%
-
Brain dysfunction - 8.8%
-
Neurologic conditions - 7.6%
-
Debility - 6.6%
-
Spinal cord dysfunction - 5.9%
-
Cardiac disorders - 3.2%
-
Amputation (usually lower limb) - 3.1%
-
Major multiple trauma - 2.3%
-
Medically complex conditions - 1.5%
-
Pain syndromes - 1.1%
-
Pulmonary disorders - 1.1%
-
Arthritis - 1.0%
-
Other disabling impairments - 0.8%
-
Burns - 0.2%
-
Congenital deformities - 0.1%
-
Developmental disability - 0.0%
-
Total - 100.0%; 415,190 cases
The distribution of impairment types in the UDSMR ® database (FIM ® data) for 2007 for adult subacute medical rehabilitation (these patients are in skilled nursing facilities) was as follows:
-
Orthopedic conditions - 44.1%
-
Medically complex conditions - 20.4%
-
Cardiac disorders - 8.8%
-
Debility - 8.3%
-
Stroke - 6.0%
-
Pulmonary disorders - 3.3%
-
Pain syndromes - 2.0%
-
Brain dysfunction - 1.8%
-
Neurologic conditions - 1.5%
-
Other disabling impairments - 1.4%
-
Amputation - 0.8%
-
Arthritis - 0.8%
-
Spinal cord dysfunction - 0.5%
-
Major multiple trauma - 0.3%
-
Burns - 0.1%
-
Congenital deformities - 0.0%
-
Developmental disability - 0.0%
-
Total - 100.0%; 17,832 cases
In pediatric (WeeFIM® data) cases for 2007, the distribution of impairment types was as follows:
-
Cerebral palsy - 16.3%
-
Traumatic brain - 15.0%
-
Developmental disabilities -14.4%
-
Nontraumatic brain - 10.4%
-
Orthopedic and amputation - 7.9%
-
Neurologic - 5.5%
-
Spinal cord - 5.1%
-
Congenital - 4.6%
-
Stroke - 3.8%
-
Major multiple trauma - 3.6%
-
Burns, arthritis, pain - 3.5%
-
Spina bifida - 3.5%
-
Childhood disorders with high risk - 2.9%
-
Cardiac and pulmonary - 2.2%
-
Other impairments - 1.3%
-
Total - 100.0%; 6,169 cases
Data Analysis and Reporting
The FIM instrument is administered to a patient upon entry into rehabilitation and again at discharge, and the difference in gain or loss of function is measured. In addition, interim assessments may be made of patients (eg, on the 10th day after admission) to judge the rate of improvement in functional ability as measured by the FIM instrument. Based on data collected from rehabilitation facilities around the country for about 2 decades, predictions can be made, taking into account, of course, such factors as patient age, disability, and severity of disability. Subscribing facilities receive reports on their outcomes in quarterly reports provided by UDSMR, compared with other similar regional and national facilities.
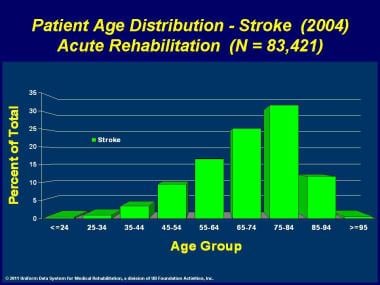
Comparing patients in similar facilities over time makes it apparent that we can calculate average values for age, for example; however, a number of patients on either side of that average are very different from the average and from each other in admission and outcome characteristics. The image below shows the age range of 83,421 patients with stroke for 2004.
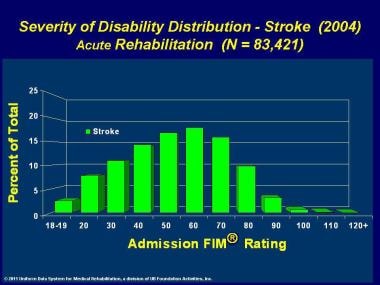
As for the distribution of admission-FIM instrument ratings (upon admission from acute care to rehabilitation treatment) for these patients who have sustained a stroke, a number of patients on either side of the average are very different from the average and from each other. See the image below.
A method was needed for more accurate comparison by controlling for differences. The method developed was a patient classification system called the FIM function-related group (FIM-FRG), which was developed with the UDSMR by Penn Ability Systems® (PAS™) at the University of Pennsylvania. For patients undergoing rehabilitation, types of impairment and severity of disability must be known so that physiatrists can order the appropriate types and amounts of treatment. For insurers, knowing clinical characteristics and severity is important so that rehabilitation facilities can be fairly reimbursed for restorative care that is sometimes intense and lengthy.
UDSMR documentation has confirmed that the more disabled the patient, the longer the stay. FRGs and case-mix adjustment for comparability are described in more detail in Function-related Group Classification and Case-mix Adjustment. Since 2002, the FIM-FRG system has been converted to case-mix groups (CMGs) for purposes of prospective payment. See The Federal Payment System and Grouping Patients.
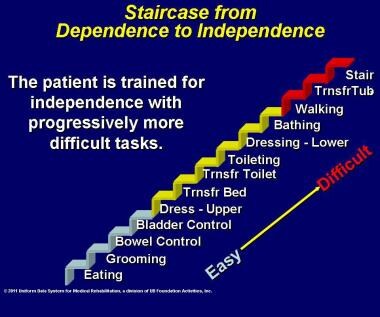
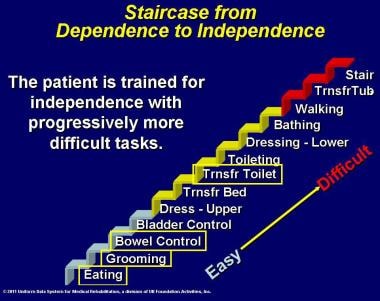
The motor-FIM instrument items are constructed so that an expected rating relationship exists among the motor ADL items. This relationship is demonstrated by the staircase in the images below, showing that the patient achieves independence by progressing from easy to intermediate to difficult items, as from eating to stair climbing. A few items can be observed and measured, and the probable rating of unobserved items can be inferred.
This hierarchical expectancy of rating can be used to advantage in estimating the disability level of a patient still in the acute care hospital. The items for eating, grooming, bowel control, and toilet transfer are observable in the acute care setting, while more complex items, such as dressing and walking, may not be. Therefore, the AlphaFIM® instrument was developed for use only in acute-care settings, before the patient enters rehabilitation. It consists of 4 motor items (eating, grooming, bowel control, toilet transfer) plus 2 cognition items (expression, memory) to estimate the level of function in terms of the full-scale rating. The AlphaFIM® instrument items first are assessed within 72 hours of admission to acute care and again at discharge from acute care.
The results of the AlphaFIM® instrument assessment are important, because they provide an estimate of the patient's level of function and the amount of assistance needed for personal care in terms of expected number of hours, or the burden of care. Determination can be made of the most suitable location for postacute discharge, taking into account the expected burden of care.
The FIM instrument staircase referred to previously is a simplified version of the assessment tool. The staircase in the image below shows that the distances between the risers are uneven across the motor-FIM instrument items. This unevenness is taken into account in calculating the full-scale rating or even the rating of a single item, such as walking.
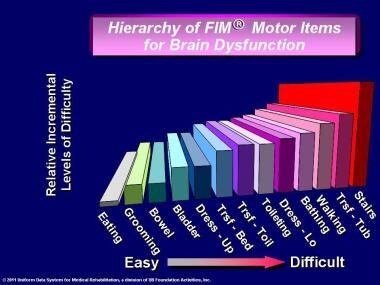
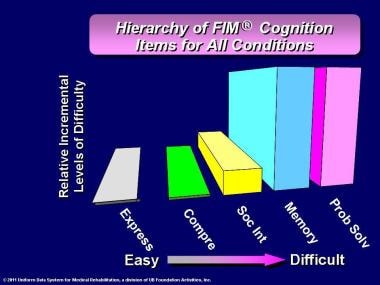
A similar hierarchy exists for rating the cognition items. The image below shows that for conditions except stroke with right hemiparesis (left-brain involvement), expression and comprehension are easy, social interaction is intermediate, and memory and problem solving are difficult. [24]
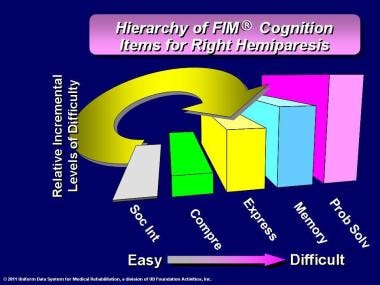
The image below shows the order of difficulty for patients with stroke with right hemiparesis (left-brain involvement). The positions of expression and social interaction are switched from the previous diagram. The pictorial differences illustrate how the pattern of response is altered because of differences in the biology of the disability (ie, the effects of impairment of specialized language centers in the brain).
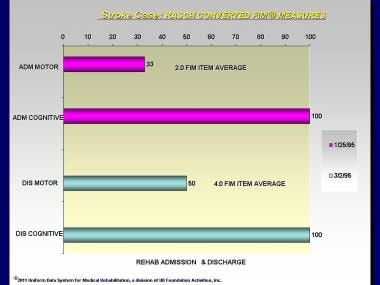
When conducting FIM instrument analysis, the clinician needs to understand Rasch analysis, a method for converting the FIM instrument ordinal level ratings into 2 measures with equal intervals, for the 13 motor items and for the 5 cognition items. [25, 26] In the image below, the Rasch-converted motor-FIM instrument rating on admission on January 25, 1995, was 35; that is, the rating was equivalent to a raw motor-FIM instrument rating average of 2, or maximal assistance. On discharge on March 2, 1995, the Rasch-converted rating was 50; that is, the rating was equivalent to a raw motor-FIM instrument rating average of 4, or minimal assistance needed. The Rasch-converted cognition rating was 100 on admission and at discharge, indicating complete independence. All rating is performed with 100 representing the most independent rating.
The image below shows the results of 4 LIFEwareSM System assessments of an outpatient on the NEUROMOTOR, NEUROCOGNITION, PHYSICAL LIMITATIONS, and PLACID measures: June 1, 1996; March 6, 1997; January 15, 1998; and March 19, 1998. The zero value is set at the expected (typical) ratings for the population in the database (51 for NEUROMOTOR, 61 for NEUROCOGNITION, 60 for PHYSICAL LIMITATIONS, and 71 for PLACID). Values for the NEUROMOTOR measure (dark blue) are slightly below expected, and values for the NEUROCOGNITION measure (magenta) are slightly above expected, except for a drop on January 15, 1998, where values for PHYSICAL LIMITATIONS (orange) hover near the expected, and values for PLACID (green) are consistently below expected. The NEUROCOGNITION (magenta) values tend to be above expected values, while the other measures tend to be below expected values.
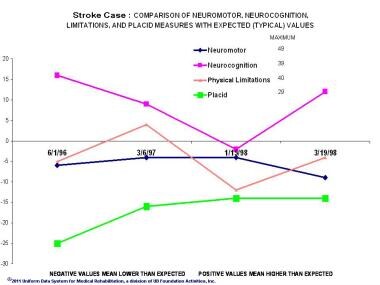 Stroke Case: Comparison of Neuromotor, Neurocognition, Physical Limitations, and Placid measures with expected (typical) values.
The chart in the image below demonstrates the items that make up the PLACID measure. These items form an expected rating hierarchy, with the more common problem of being easily irritated being located to the left, and the less common problem of having panic attacks being located to the right. The zero line represents the expected average value for each item. The green line shows the maximum value for each item. The patient's recent ratings are lower than expected across 6 of the 7 items. The magenta line shows a comparison of the averages of item values for the 3 prior assessments, on June 1, 1996; January 15, 1998; and March 19, 1998.
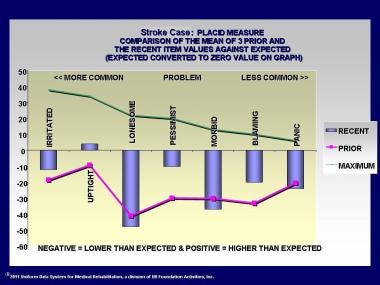 Stroke Case: Placid measure comparison of the mean of the 3 prior and the recent item values against expected.
The image below demonstrates the items that make up the measure of PHYSICAL LIMITATIONS. These items form an expected scoring hierarchy, the more common problem being fatigue, located to the left, and the less common problem being bowel management, located to the right. The zero line represents the expected average value for each item. The green line shows the maximum value for each item. The patient's recent ratings demonstrate less functional ability in the right upper and lower limbs. This result is consistent with a residual right hemiparesis from the earlier stroke. The magenta line shows a comparison of the averages of item values for the 3 prior assessments on June 1, 1996; January 15, 1998; and March 19, 1998. Some improvement in the right hemiparesis has occurred.
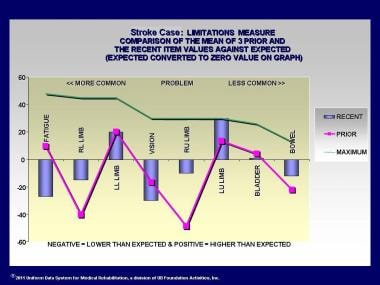 Stroke Case: Limitations measure comparison of the mean of the 3 prior and the recent item values against expected.
Function-related Group Classification and Case-mix Adjustment
As described earlier, the FIM-FRG system was developed for the FIM instrument and The FIM System® to classify patients at the time of admission to rehabilitation to facilitate prediction of LOS and level of function that can be achieved during rehabilitation and to compare outcomes between patients. This section describes the FIM-FRG system that is used with the FIM instrument and The FIM System®. The Federal Payment System and Grouping Patients section describes how the FIM-FRG system was adapted for use with the IRF-PAI for comprehensive inpatient medical rehabilitation facilities.
Patients are classified by type of impairment and by severity of disability. The FIM-FRG case-mix adjustment methodology permits comparable reporting across different impairment groups, as well as across different levels of functional severity at the time of admission for rehabilitation. [27] Stroke, for example, has 14 severity groups as of 2002, expanded from the original 5. Various numbers of severity groups exist for other impairments.
Efficiency pattern analysis is a method for displaying the relationships between motor-FIM instrument gain and rehabilitation inpatient hospital stay for patients of comparable severity of impairment at admission. Dr. Margaret Stineman at the University of Pennsylvania and members of the UDSMR staff developed this methodology.
-
The patient at the top represents Stroke FRG-1, the most severely disabled in the hierarchy. Note the restricted FIM instrument profile and the extensive assistance required from another person to manage the transfer from bed to chair. The successive patients represent lesser degrees of disability and need far less assistance. The fifth patient performs the activity without help. See the image below.
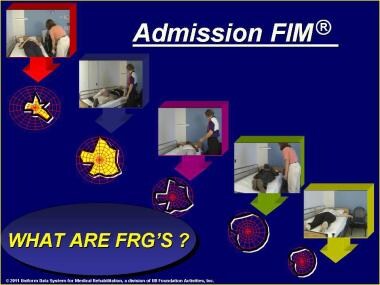 Admission FIM® instrument rating. Impairment type (diagnosis) with the admission motor FIM® instrument and cognition FIM® instrument ratings plus age determine the function-related group (FRG) to which a patient is assigned. Note that the FIM® instrument rating profile is more constricted for the upper left patient (meaning more dependent functioning). This patient is assigned to the lowest FRG. Thus, the expectation is that length of stay, on average, will be highest. Other patients with the same impairment type have progressively higher FIM® instrument ratings toward the lower right and are assigned to progressively higher FRGs. Thus, the expectation is that length of stay, on average, will be lower. For example, the upper left patient requires more assistance in bed-to-chair transfers, and the lower right patient performs bed-to-chair transfers without assistance. Note that the FIM® instrument rating profile is least constricted for this patient.
-
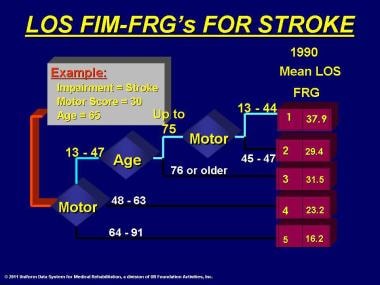
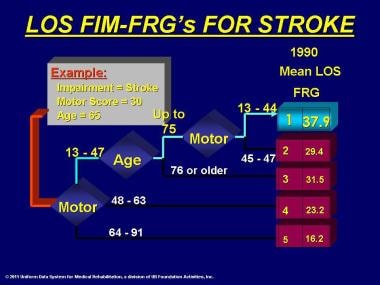
Assignment of a patient to an FIM-FRG category involves decision-tree analysis. From 1990 UDSMR ® data, 5 FRG categories were developed to predict LOS for patients diagnosed with stroke. A 65-year-old patient with a motor-FIM instrument rating of 30 would be classified as FRG-1, with an average expected LOS of 37.9 days. Patients classified into FRG-2 through FRG-5 would be expected to have an average LOS of 29.4, 31.5, 23.2, and 16.2 days, respectively. The less severe the stroke on admission, the shorter the expected LOS. See the images below.
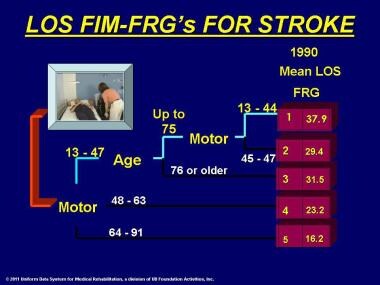 Length of stay (LOS), FIM® instrument, using 5 function-related groups (FRGs) for stroke.
 Length of stay (LOS), FIM® instrument, using 5 function-related groups (FRGs) for stroke.
-
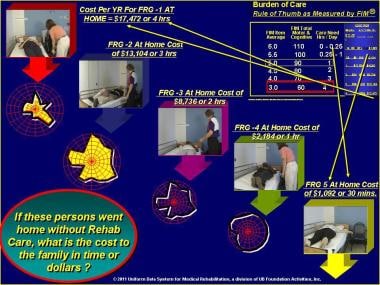
A patient's FIM instrument rating is useful in projecting the burden of care as measured in minutes of help needed per day from another person to perform basic personal care activities. An average FIM instrument rating of 3 on each item, or a total-FIM instrument rating of 60, requires about 4 hours of help per day. Many patients are admitted to inpatient rehabilitation with this level of disability. During rehabilitation, the patient becomes more independent, and the FIM instrument rating increases. At 90 total-FIM instrument rating, the burden of care is reduced to 1 hour per day. At this level, the condition of many patients can be managed effectively at home. The need for assistance in terms of minutes of care per day may be thought of in terms of the financial resources necessary to purchase personal care services. At the rate of $12 per hour, care for a patient needing 4 hours of help per day would cost $48 per day. See the image below.
 Length of stay (LOS), FIM® instrument, using 5 function-related groups (FRGs) for stroke.
-
If these persons were at home without rehabilitative care, what might be the cost to the family in time and dollars? The care for the person with the most disability in the FRG-1 category might cost $17,472 per year, and the care for the person with the least disability in FRG-5 might cost $1,092 per year. See the image below.
-
This illustrates cost to the family in time and dollars. Health care accountability and risk must be considered together in terms of the quality or benefit of the services, the price to deliver the services, and the subjective value as perceived by the payer, the patient, and the family. Use of the FIM-FRG system allows adjustment for more accurate comparison between rehabilitation programs over time. See the image below.
-
In a capitation system of payment, the provider must anticipate the resources that may be required to achieve appropriate outcomes. Thus, each level of severity represents a different level of risk in projecting likely costs. See the image below.
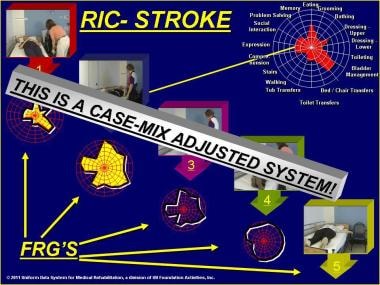 Rehabilitation impairment category (RIC) - Stroke. FRG is function-related group.


The formula for a prudent buyer of a product or service shows that value is equivalent to the quality or benefit divided by the price. Value is the level of desirability subjectively perceived by the buyer (or patient). Quality is the level of measurable benefit (eg, gain, improvement) for the buyer (or patient). Price is the amount in dollars charged to the buyer to cover the costs of producing and delivering the product or service. Unless quality is clearly measurable, the value is not likely to be perceived as equal to the price, because quality would not count. Thus, the prudent buyer would purchase on the basis of price, not quality.
A rehabilitation provider in a capitation system of reimbursement may need to practice dose-management of therapy resources to deliver the appropriate amount of services to patients most likely to benefit. For example, a patient who has sustained a stroke with an average per-item FIM instrument rating of 4 would be assigned to FRG-3, with a profile of function illustrative of moderate functional ability on admission to rehabilitation. Another patient with an average per-item FIM instrument rating of 2 would be assigned to FRG-1, with a profile of function illustrative of low functional ability on admission to rehabilitation. To what extent might improvement be expected to occur during the rehabilitation program? From data in the UDSMR ® database, the probable functional ability and expected LOS may be projected for each case.
The FIM-FRG classification for stroke was updated from 1990 by Stineman using 1995 UDSMR ® data. Instead of 5 categories, 9 categories now have been identified, which makes the use of this FIM-FRG Version 2 interesting to use to compare the projected mean LOS for 1990 with that for 1995. In keeping with clinical experience, LOS has dropped, and it has done so rather uniformly across the 9 severity groups. Based on these data, if a rehabilitation facility had 1 case in each category in 1990 and the same in 1995, approximately the same outcomes would have been obtained, but in 37 fewer days (for 9 patients, 1 in each of the 9 categories). On average, from 1990-1995, LOS has been decreasing in all categories, an average of 1 day per year.
In the FIM-FRG reporting system, it is possible to discern that 2 hospitals have different mixes of case severity. For example, hospital A has patients assigned to FRG-6, and hospital B has patients assigned to FRG-1. The data must be case-mix adjusted for proper comparison. In this situation, a comparison can be made between patients of similar severity treated in the 2 facilities.
-
The distribution of stroke and orthopedic cases happens to be similar to the national distribution. See the image below.
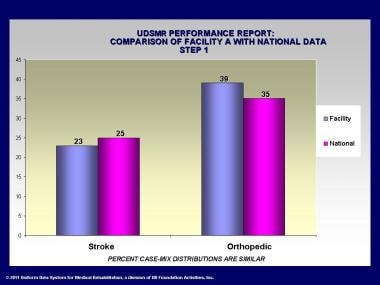 Uniform Data System for Medical Rehabilitation (UDSMR) performance report. Comparison of facility with national data.
-
Outcome characteristics of interest include onset days, which is the time from acute hospital admission to rehabilitation admission. Generally, shorter onset time is preferable. Next, the admission gain and discharge-FIM instrument ratings are presented. Lower admission-FIM instrument ratings (admission to rehabilitation) indicate more challenging patients; greater gain is preferable, as is higher discharge scores. Lower LOS is preferable, assuming that the FIM instrument gain is appropriate. Higher FIM instrument efficiency, or gain in FIM instrument points divided by LOS in days, is preferable. Higher rate of discharge to the community is preferable. These values from facility A are presented without comparison with national data. See the image below.
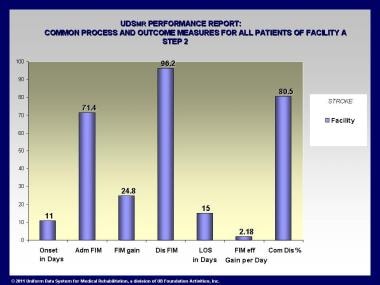 Uniform Data System for Medical Rehabilitation (UDSMR) common process and outcome. Measures for all patients of facility A.
-
In this chart, the data from the previous chart are compared with national data. National data values are represented by the zero line. Facilities with higher data show up above the line, and facilities with lower data are shown below the line. These data are not adjusted for differences in severity between the facility and the nation. See the image below.
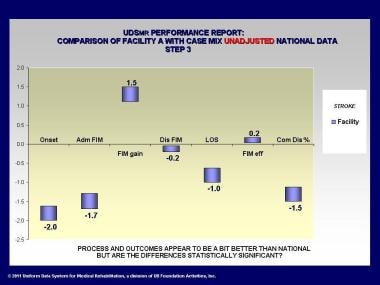 Uniform Data System for Medical Rehabilitation (UDSMR) performance report. Comparison of facility A with case-mix unadjusted national data.
-
The data in this chart are adjusted for severity differences between the facility and the nation. In this situation, the national data are adjusted as if there existed the same case mix as at the facility, which is called indirect standardization. In addition, confidence limits are drawn to show where the values fall. Values for the facility that lie within the upper and lower confidence limits are not statistically different. Values that lie outside are statistically different. See the image below.
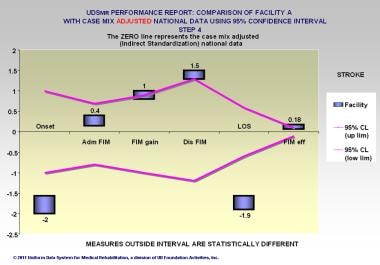 Uniform Data System for Medical Rehabilitation (UDSMR) performance report. Comparison of facility A with case-mix adjusted national data using 95% confidence limits.
-
In this chart, the distribution of stroke and orthopedic cases happens to be very different from the national distribution. See the image below.
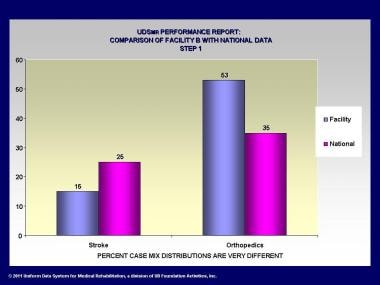 Uniform Data System for Medical Rehabilitation (UDSMR) performance report. Comparison of facility B with national data.
-
Outcome characteristics are shown, as in the prior case, compared with national values, but without case-mix adjustment. See the image below.
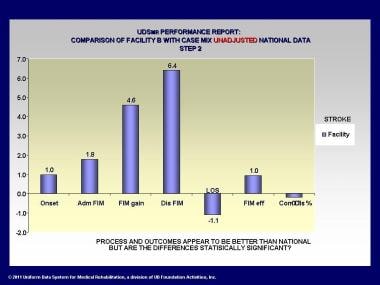 Uniform Data System for Medical Rehabilitation (UDSMR) performance report. Comparison of facility B with case-mix unadjusted national data.
-
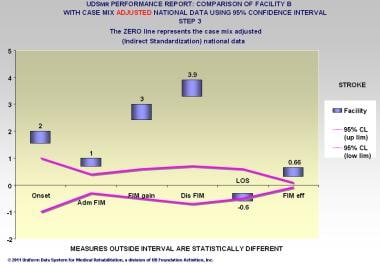
The data in this chart are adjusted for severity differences between facility B and the nation. Indirect standardization is again used, with national data adjusted as if there existed the same case mix as at the facility. Values that lie outside are statistically different. See the image below.
 Uniform Data System for Medical Rehabilitation (UDSMR) performance report. Comparison of facility B with case-mix adjusted national data using 95% confidence limits.
-
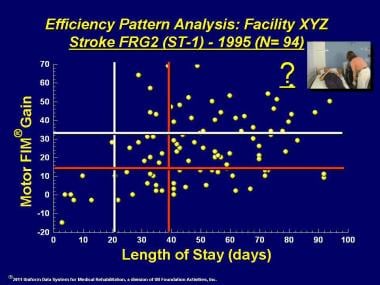
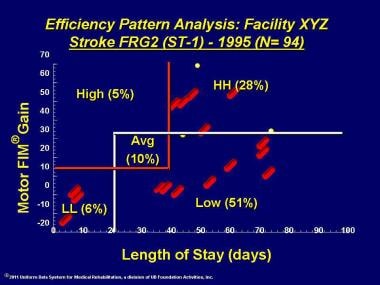
Another adaptation of the FIM-FRG methodology developed by Stineman is shown in this chart of efficiency pattern analysis. In this example, 94 cases from a given facility have been classified in FRG-1 for stroke. These data have been plotted so that the motor-FIM instrument gain lies on the vertical axis, and the LOS has been plotted on the horizontal axis. Lines have been drawn to show the national 25th and 75th percentile values for motor-FIM instrument gain and for LOS. Thus, in the national data, 50% of the patient values lie within the vertical lines for motor-FIM instrument gain, and 50% of the patient values lie within the national 25th and 75th percentiles for LOS. The personnel at the facility prefer to have the data plots lie within the 50th-percentile range or somewhat higher for gain and somewhat lower for LOS. See the image below.
-
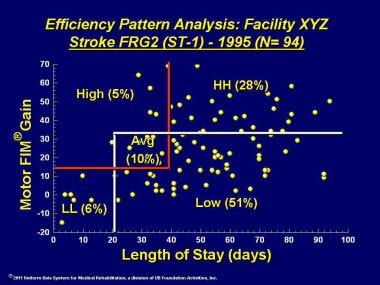
In this case, only 10% of cases lie in the middle range. Six percent of the patients lie in the lower LOS range, but these are individuals who failed to gain FIM instrument points. Twenty-eight percent have high FIM instrument gain, but these are patients who stayed longer. See the image below.
-
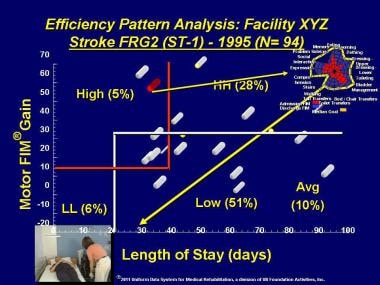
Pinpointing these patients will be possible with a refinement of this methodology, still to be implemented. In this case, this designation, or any other that is chosen, would reflect the fact that such patients tend to exhibit low efficiency (51% of patients), with longer LOS and less FIM instrument gain. See the image below.
-
Efficiency means high gain and shorter LOS. Which patients demonstrate high efficiency? From that group, a specific patient might be identified and the record made available for examination to determine the particular features that are associated with high efficiency. See the image below.


See the following videos for more information on levels.
The Federal Payment System and Grouping Patients
As explained earlier, for the first time, starting January 1, 2002, payment for Medicare Part A inpatient rehabilitation services in comprehensive medical rehabilitation facilities became tied to the level of severity of the patient's functional status at the time of admission.
The classification of patients in comprehensive medical rehabilitation facilities into payment groups on admission still is based on the FIM-FRG system. Patients now are assigned to 1 of 85 Impairment Group Codes (IGCs) that fall under 17 Impairment Groups. Also, the etiology must be identified in terms of a code found in the document International Classification of Diseases, Ninth Revision, Clinical Modification. [28]
Each IGC falls into 1 of 21 general diagnostic categories, or Rehabilitation Impairment Categories (RICs). For example, all types of stroke are assigned to the 01 Stroke RIC. The CMG, similar to the FRG, is assigned based on the IGC and on the admission-FIM instrument motor rating, as well as, in some cases, on the admission-FIM instrument cognition rating and on age. The goal is to group patients with similar use of resources and likely LOS. The CMG designation, along with comorbid conditions and/or complications, determines payment, assuming the patient meets LOS and course-of-rehabilitation requirements.
The physiatrist today faces additional responsibilities in terms of understanding the new coding and providing clear documentation and medical justification for the decision to admit and provide ongoing care in the inpatient rehabilitation facility setting.
Continuum of Care
Medical rehabilitation rarely is conducted in only 1 care setting. Especially now, with the emphasis on reducing LOS in high-cost inpatient settings, rehabilitation spans a continuum of care in order to be cost-effective, yet complete.
Rehabilitation care settings have become more complicated than they were toward the end of the 20th century. Care for adults with significant functional limitations usually begins in the acute care hospital. In acute care, the where and when of admission and discharge are identified. Persons needing postacute rehabilitation have several options, including the following:
-
Traditional inpatient rehabilitation unit of a hospital
-
Freestanding rehabilitation hospital
-
Subacute rehabilitation, which usually is located in a skilled nursing facility
-
Rehabilitation in the home
-
Rehabilitation in an outpatient clinic
Patients may be transferred to any of these settings in any order.
From the acute care setting, several alternative settings exist, providing a range of intensities of treatment, resources, and costs to be incurred. Triage should result in selecting the right patient for the right treatment setting at the right time. The ultimate goal at completion of rehabilitation is the patient's return to living in the community, which could mean living at home independently, living with family, receiving home health care, or living in an assisted-living residence.
In order to render cost-effective care, a method for anticipating probable resource needs and outcomes would be helpful to determine, at the time of admission to acute care, what might be expected of each patient after acute care discharge.
The continuum of care has become increasingly complex, ranging from high-cost, high-intensity care in acute care hospitals to lower-cost, lower-intensity care in outpatient settings. Adding to the complexities are insurance payment systems that vary across clinical settings.
The demographics of an aging population mean an increasing prevalence of chronic health conditions, requiring a rational system for linking assessments of patients from the acute care hospital to the rehabilitation program, as well as to outpatient and home-based programs. Assessment of patients across the continuum of care should be understandable, meaningful, cost-effective, and manageable. UDSMR uses Web technology for all its instruments for collecting data and sending information. It has developed continuum software that links the functional status of inpatients from the UDS-PROi ® product and outpatients from the LIFEwareSM System.
A continuum of care is being used at this time by subscribers to the UDSMR inpatient and outpatient assessment instruments. The case example presented here illustrates a continuum of care report for a patient with a spinal cord injury. The longitudinal record shows changes in the patient’s functionality over time and through inpatient and outpatient settings. Clinicians use this data, along with other health data, to modify treatments or move patients around postacute treatment venues. This case example indicates the patient received inpatient and then outpatient rehabilitation care, as evidenced by the instruments used.
The UDSMR FIM instrument for rehabilitation inpatients has 13 motor items and 5 cognition items. Patients are rated by clinicians in independence or dependence in completing these tasks. The motor items include eating, grooming, bathing, dressing upper body, dressing lower body, toileting, bowel management, bladder management, and transfers (bed, chair, wheelchair, toilet, tub/shower). The 5 cognition items are comprehension, expression, social interaction, problem solving, and memory.
The LIFEwareSM System assesses quality of life as self-reported by rehabilitation outpatients. It consists of a series of measures of physical functioning, pain experience, emotional/mood state, cognitive status, social interaction, selected role participation, and satisfaction with the treatment process. Most often, the LIFEwareSM System assesses physical functioning (Body Movement and Control [BMC] measure of 10 items), affective sense of well-being or mood state (PLACID measure of 7 items), and experience with pain (PAINFREE measure of 6 items and the LIFEware® Visual Analog Scale). Subscribing facilities are able to customize their forms for each outpatient by selecting from about 130 measures, instruments, and scales. For example, the adult day services version gathers information on memory, medication, and nutrition, and the cardiac version asks questions about breathing, chest pain/discomfort, and fatigue.
The LIFEwareSM System approaches pain measurement in 3 ways. The PAINFREE measure asks about type of pain, using the adjectives “throbbing,” “sharp,” “aching,” “tender,” “splitting,” “tiring-exhausting,” “fearful,” “punishing-cruel,” “cramping,” and “hot-burning.” The PAINSCALE and a LIFEware® Visual Analog Scale (LVAS) measure intensity of pain, and sometimes both are used with a patient to confirm pain levels. The PAINSCALE asks about the extent of pain in the last 3 days, including the day of assessment. Its descriptors include “none,” “mild,” “discomforting,” “distressing,” “horrible,” and “excruciating.” The LVAS is a Likert scale asking that pain be rated from 0 to 10, from “no pain” to the “worst imaginable pain.”
All LIFEwareSM System measures, instruments, and scales are transferred to a 0-100 rating, with 100 representing the best rating, meaning no physical limitations, no emotional distress, and no pain. For most LIFEware® measures, a response level of 70 on items appears to be the most probable threshold of clinical significance, or the academic equivalent of a passing grade, whereas a response level below 70 usually indicates that remediation is needed. A common rating scale is used for the FIM instrument and the LIFEwareSM System, from 0-100, with the higher rating meaning better function.
The table below describes a 23-year-old man who sustained a complete spinal cord injury at the C7 level with tetraplegia as a result of a motor vehicle accident. There was no medical history before the accident; he was independent and had been employed in a management position. Functionality is greatly decreased with a spinal cord injury at the C7 level, including severe paralysis of the body and legs. Generally, however, such a patient could retain head, neck, and shoulder movement and movement in part of the hand; be able to breathe without a ventilator; eat independently; complete some personal care independently; operate a computer with the help of devices; and possibly drive a car with hand controls. After acute care immediately following the accident, his inpatient rehabilitation hospital stay was 6 weeks.
During this rehabilitation period, the FIM instrument was used to assess his functionality. After inpatient rehabilitation care, he had 2 admissions to outpatient care, for a total of 6 months, where the LIFEwareSM System was used to measure his functionality. During the first outpatient admission, he received occupational therapy (37 visits) and physical therapy (36 visits); during the second outpatient admission, he received physical therapy only (18 visits).
During outpatient care, he was also treated medically for right forearm pain associated with tendonitis. Occupational therapy goals addressed during outpatient care included self-care; dressing; cooking and kitchen tasks; community re-entry, including money management and retrieving objects while shopping; and using a keyboard. Physical therapy goals addressed during outpatient care included wheelchair, car, and bed transfers; upper extremity strength and endurance; manual wheelchair skills; passive standing and floor transfers; adaptive driving training; and skills for a return to work.
Dates of functional assessments are shown in the first column. The other columns are labeled with the measures used. Each instrument has its own measures, and within the measures are functional items. This case uses the cognition and motor measures of the FIM instrument ("FIMCOG" and "FIMMOT"), indicating the patient was assessed in an inpatient rehabilitation facility. The subsequent measures are from the LIFEwareSM System, indicating the patient was seen in an outpatient facility. The measures used were body movement and control (BMC), placid, painscale, limitations, neurocognition, and neuromotor. Under the measures appear only those items that are problematic and require clinical attention (items that are not problematic do not appear on the record). The minus signs in front of the item ratings indicate the value below expected for that item.
Also on the record are absolute values, which are measure rating totals, to show values as at or above expected (†) or below expected (‡). Expected values are calculated from thousands of cases in the database. As can be seen from this longitudinal record, the patient experienced physical limitations and neuromotor problems throughout therapy, without much change over time in the items that appear as problematic or their values. However, improvement was made in the placid measure over time, with the pessimistic and uptight items no longer appearing as problems.
Table 1. Case Example, LIFEware ® Longitudinal Record (Open Table in a new window)
LIFEware® Longitudinal Record of Functional Status For Case Example Condition: Neurological Problem: Spinal Cord Injury |
||||||||
Patient code: xxxxxxxxx Gender: Male Birth: xx/xx/xxxx Case open: 2005 Subscriber: xxxxx Marital: N/A Onset: N/A Case close: N/A Employment: N/A Living with: N/A Clinicians: xxx Age: 23 years |
||||||||
NOTES – Rasch Absolute Range is 0 to 100 (* indicates a secondary item not included in the calculation of absolute score) † = At or above expected ‡ = Below expected |
||||||||
DATE |
FIMCOG |
FIMMOT |
BMC |
PLACID |
PAIN- SCALE |
LIMITAT |
NEURO- COG |
NEURO- MOT |
7/29/05 |
68 Absolute† -1 Expression |
4 Absolute ‡ -55 Grooming -54 Bowel -52 Bladder -51 Dress up -50 Transfers bed -49 Toileting -48 Transfers toilet -47 Dress lo -46 Bathing -44 Walk/ Wheelchair -42 Transfers tub -35 Stairs -31 Eating |
Incomplete |
Incomplete |
Incomplete |
Incomplete |
Incomplete |
Incomplete |
9/15/05 |
100 Absolute† None below expected |
28 Absolute ‡ -54 Bowel -52 Bladder -49 Toileting -44 Walk/ Wheelchair -35 Stairs -18 Bathing -12 Transfers bed -10 Transfers toilet -9 Dress lo -4 Transfers tub -3 Dress up -1 Eating |
Incomplete |
Incomplete |
Incomplete |
Incomplete |
Incomplete |
Incomplete |
9/21/06 |
Incomplete |
Incomplete |
Incomplete -68 Stairs -68 Getting up -61 Standing -58 Kneeling -45 Reaching |
81 Absolute † -20 Pessimistic -10 Uptight |
100 Absolute † None below expected |
43 Absolute ‡ -69 Right lower limb -69 Left lower limb -55 Bowel -51 Bladder -41 Left upper limb -41 Right upper limb |
100 Absolute † None below expected |
18 Absolute ‡ -68 Stairs -68 Getting up -67 Help walking -61 Standing -58 Kneeling -47 Toilet transfer -45 Reaching* -40 Dress lo -36 Tub/shower transfer |
12/16/06 |
Incomplete |
Incomplete |
Incomplete -68 Stairs -61 Standing -58 Kneeling -35 Getting up -10 Reaching |
93 Absolute † -20 Pessimistic |
100 Absolute † None below expected |
41 Absolute ‡ -88 Bowel -69 Right lower limb -69 Left lower limb -51 Bladder -16 Left upper limb -16 Right upper limb -9 Vision |
92 Absolute † -42 Places |
18 Absolute ‡ -69 Tub/shower transfer -68 Stairs -67 Help walking -61 Standing -58 Kneeling -47 Toilet transfer -40 Dress lo -35 Getting up -10 Reaching* |
1/27/06 |
Incomplete |
Incomplete |
Incomplete -68 Stairs -61 Standing -58 Kneeling -35 Getting up -10 Reaching |
93 Absolute † -20 Pessimistic |
100 Absolute † None below expected |
52 Absolute ‡ -88 Bowel -69 Left lower limb -69 Right lower limb -21 Left upper limb -21 Right upper limb |
97 Absolute † None below expected |
15 Absolute ‡ -80 Toilet transfer -69 Tub/shower transfer -68 Stairs -67 Help walking -61 Standing -58 Kneeling -40 Dress lo -35 Getting up -10 Reaching* |
4/04/06 |
Incomplete |
Incomplete |
Incomplete -68 Stairs -61 Getting up -61 Standing -58 Kneeling -10 Reaching |
100 Absolute † None below expected |
100 Absolute † None below expected |
40 Absolute ‡ -88 Bowel -84 Bladder -69 Left lower limb -69 Right lower limb -21 Left upper limb -21 Right upper limb |
100 Absolute † None below expected |
22 Absolute ‡ -68 Getting up -68 Stairs -67 Help walking -61 Standing -58 Kneeling -5 Dress lo -47 Toilet transfer -36 Tub/shower transfer -10 Reaching* |
Copyright 2009 – Uniform Data System for Medical Rehabilitation, a division of UB Foundation Activities, Inc., All Rights Reserved
The U.S. Centers for Medicare & Medicaid Services (CMS) has an interest in continuum of care and is developing and testing its own assessment instrument that could become part of a new postacute payment system for all the types of facilities providing medical rehabilitation after acute hospital care for Medicare recipients. (Medicare recipients use most of the rehabilitation services in the United States.) Rehabilitation patients are generally stabilized in an acute care hospital after a medical event, such as a stroke, and then can be moved to or around any of the postacute settings, but not in any order.
The postacute care providers are inpatient rehabilitation facilities (free-standing rehabilitation hospitals or in-hospital units), skilled nursing facilities, long-term care hospitals, home health agencies, and outpatient facilities. Currently, postacute settings each have their own prospective payment systems and use different functional assessment instruments, including OASIS, MDS, and the IRF-PAI, which incorporates the FIM instrument, for evaluating functional status. (The current use of the IRF-PAI in inpatient medical rehabilitation facilities is discussed in Development of the UDSMR and the FIM Instrument.) Similar information is collected by all the postacute instruments but in different formats, making comparisons among settings impossible.
CMS is conducting a research project comparing all the postacute settings, especially their costs and outcomes, to determine the most cost-effective settings for individual patients. The U.S. Deficit Reduction Act of 2005 directed CMS to conduct research that could lead to standardized patient assessment for all postacute settings. This demonstration is to provide information on patient health and functional status independent of postacute setting and examine resources and outcomes associated with treatment in each setting. The instrument under development, the Continuity Assessment Record and Evaluation Tool (CARE Tool), is to have standardized measures of medical acuity, functional status, cognitive impairment, and social support.
Information on the project is available here: Overview of the Medicare Post Acute Care Payment Reform Initiative
Examples of comments on the project can be viewed at the American Hospital Association and Center for Medicare Advocacy, Inc.
Instrument testing began in 2008, and a report on the payment reform demonstration is to be provided by CMS to the U.S. Congress in 2011.
Larger Picture for Medical Rehabilitation Outcomes Measurement
Research has demonstrated that the cost of care for patients with chronic health conditions has exceeded the cost of care for persons with acute conditions by at least 2 times. In 1987, with institutional costs excluded, 46% of 193.4 million persons who incurred health care costs had chronic health conditions. People with chronic health conditions used 76% of the $357.9 billion cost. The changing characteristics of persons with chronic versus acute health conditions demand that all health care providers pay attention to issues relating to how effectively patients function and to the outcomes of care.
The health care system needs to be increasingly accountable to achieve expected outcomes effectively and efficiently. Effectively means how well we do this; efficient means how inexpensively we do it.
The Institute of Medicine has defined quality as "the degree to which health services for individuals and populations increase the likelihood of desired health outcomes and are consistent with current professional knowledge."
Currently, the third-party payer is exerting a force on how services are rendered and on the types of outcomes that can be expected. Thus, it is incumbent upon the clinician to balance the benefit of treatment with its cost, while taking into account perceptions of the value of the treatment from the viewpoint of the payer, patient, family, and community.
UDSMR applies scientific research to the process of assessment of outcomes. The goal is to improve patient care and function by (1) identifying the patterns of disability and recovery and (2) providing appropriate and timely feedback to clinicians so they can promote effective and efficient care for the patient.
The more we study function in a systematic fashion, the more it is evident that function transcends everything. As we function, so shall we live.
-
The FIM® instrument items.
-
FIM® instrument rating levels.
-
Admission FIM® instrument rating.
-
Admission and discharge FIM® instrument rating.
-
Admission, discharge, and follow-up FIM® instrument rating.
-
Patient age distribution for stroke from 2004.
-
Severity of disability distribution for stroke from 2004.
-
Staircase from dependence to independence.
-
Staircase from dependence to independence. Certain items highlighted.
-
Hierarchy of FIM® instrument motor items for brain dysfunction.
-
Hierarchy of FIM® instrument cognition items for all conditions.
-
Hierarchy of FIM® instrument cognition items for right hemiparesis.
-
Stroke Case: Rasch transformed FIM® instrument measures.
-
Stroke Case: Comparison of Neuromotor, Neurocognition, Physical Limitations, and Placid measures with expected (typical) values.
-
Stroke Case: Placid measure comparison of the mean of the 3 prior and the recent item values against expected.
-
Stroke Case: Limitations measure comparison of the mean of the 3 prior and the recent item values against expected.
-
Admission FIM® instrument rating. Impairment type (diagnosis) with the admission motor FIM® instrument and cognition FIM® instrument ratings plus age determine the function-related group (FRG) to which a patient is assigned. Note that the FIM® instrument rating profile is more constricted for the upper left patient (meaning more dependent functioning). This patient is assigned to the lowest FRG. Thus, the expectation is that length of stay, on average, will be highest. Other patients with the same impairment type have progressively higher FIM® instrument ratings toward the lower right and are assigned to progressively higher FRGs. Thus, the expectation is that length of stay, on average, will be lower. For example, the upper left patient requires more assistance in bed-to-chair transfers, and the lower right patient performs bed-to-chair transfers without assistance. Note that the FIM® instrument rating profile is least constricted for this patient.
-
Length of stay (LOS), FIM® instrument, using 5 function-related groups (FRGs) for stroke.
-
Length of stay (LOS), FIM® instrument, using 5 function-related groups (FRGs) for stroke.
-
Length of stay (LOS), FIM® instrument, using 5 function-related groups (FRGs) for stroke.
-
Burden of care. Rule of thumb as measured by the FIM® instrument.
-
Burden of care.
-
Rehabilitation impairment category (RIC) - Stroke. FRG is function-related group.
-
Uniform Data System for Medical Rehabilitation (UDSMR) performance report. Comparison of facility with national data.
-
Uniform Data System for Medical Rehabilitation (UDSMR) common process and outcome. Measures for all patients of facility A.
-
Uniform Data System for Medical Rehabilitation (UDSMR) performance report. Comparison of facility A with case-mix unadjusted national data.
-
Uniform Data System for Medical Rehabilitation (UDSMR) performance report. Comparison of facility A with case-mix adjusted national data using 95% confidence limits.
-
Uniform Data System for Medical Rehabilitation (UDSMR) performance report. Comparison of facility B with national data.
-
Uniform Data System for Medical Rehabilitation (UDSMR) performance report. Comparison of facility B with case-mix unadjusted national data.
-
Uniform Data System for Medical Rehabilitation (UDSMR) performance report. Comparison of facility B with case-mix adjusted national data using 95% confidence limits.
-
Efficiency pattern analysis for facility XYZ.
-
Efficiency pattern analysis for facility XYZ.
-
Efficiency pattern analysis for facility XYZ.
-
Efficiency pattern analysis for facility XYZ.
-
FIM® instrument rating level 1 (on 7-level scale). Total assistance: Patient performs less than 25% task (transfers: bed, chair, wheelchair).
-
FIM® instrument rating level 2 (on 7-level scale). Maximal assistance: Patient performs 25-49% of task (transfers: bed, chair, wheelchair).
-
FIM® instrument rating level 5 (on 7-level scale). Supervision, no touching assistance with task (transfers: bed, chair, wheelchair).
-
FIM® instrument rating level 4 (on 7-level scale). Minimal contact, touching assistance only, no lifting: Patient performs 75% or more of task (transfers: bed, chair, wheelchair).
-
FIM® instrument rating level 6 (on 7-level scale). Modified independence: Patient requires assistive device (side rail), and no helper is needed with task (transfers: bed, chair, wheelchair).
Tables
LIFEware® Longitudinal Record of Functional Status For Case Example Condition: Neurological Problem: Spinal Cord Injury |
||||||||
Patient code: xxxxxxxxx Gender: Male Birth: xx/xx/xxxx Case open: 2005 Subscriber: xxxxx Marital: N/A Onset: N/A Case close: N/A Employment: N/A Living with: N/A Clinicians: xxx Age: 23 years |
||||||||
NOTES – Rasch Absolute Range is 0 to 100 (* indicates a secondary item not included in the calculation of absolute score) † = At or above expected ‡ = Below expected |
||||||||
DATE |
FIMCOG |
FIMMOT |
BMC |
PLACID |
PAIN- SCALE |
LIMITAT |
NEURO- COG |
NEURO- MOT |
7/29/05 |
68 Absolute† -1 Expression |
4 Absolute ‡ -55 Grooming -54 Bowel -52 Bladder -51 Dress up -50 Transfers bed -49 Toileting -48 Transfers toilet -47 Dress lo -46 Bathing -44 Walk/ Wheelchair -42 Transfers tub -35 Stairs -31 Eating |
Incomplete |
Incomplete |
Incomplete |
Incomplete |
Incomplete |
Incomplete |
9/15/05 |
100 Absolute† None below expected |
28 Absolute ‡ -54 Bowel -52 Bladder -49 Toileting -44 Walk/ Wheelchair -35 Stairs -18 Bathing -12 Transfers bed -10 Transfers toilet -9 Dress lo -4 Transfers tub -3 Dress up -1 Eating |
Incomplete |
Incomplete |
Incomplete |
Incomplete |
Incomplete |
Incomplete |
9/21/06 |
Incomplete |
Incomplete |
Incomplete -68 Stairs -68 Getting up -61 Standing -58 Kneeling -45 Reaching |
81 Absolute † -20 Pessimistic -10 Uptight |
100 Absolute † None below expected |
43 Absolute ‡ -69 Right lower limb -69 Left lower limb -55 Bowel -51 Bladder -41 Left upper limb -41 Right upper limb |
100 Absolute † None below expected |
18 Absolute ‡ -68 Stairs -68 Getting up -67 Help walking -61 Standing -58 Kneeling -47 Toilet transfer -45 Reaching* -40 Dress lo -36 Tub/shower transfer |
12/16/06 |
Incomplete |
Incomplete |
Incomplete -68 Stairs -61 Standing -58 Kneeling -35 Getting up -10 Reaching |
93 Absolute † -20 Pessimistic |
100 Absolute † None below expected |
41 Absolute ‡ -88 Bowel -69 Right lower limb -69 Left lower limb -51 Bladder -16 Left upper limb -16 Right upper limb -9 Vision |
92 Absolute † -42 Places |
18 Absolute ‡ -69 Tub/shower transfer -68 Stairs -67 Help walking -61 Standing -58 Kneeling -47 Toilet transfer -40 Dress lo -35 Getting up -10 Reaching* |
1/27/06 |
Incomplete |
Incomplete |
Incomplete -68 Stairs -61 Standing -58 Kneeling -35 Getting up -10 Reaching |
93 Absolute † -20 Pessimistic |
100 Absolute † None below expected |
52 Absolute ‡ -88 Bowel -69 Left lower limb -69 Right lower limb -21 Left upper limb -21 Right upper limb |
97 Absolute † None below expected |
15 Absolute ‡ -80 Toilet transfer -69 Tub/shower transfer -68 Stairs -67 Help walking -61 Standing -58 Kneeling -40 Dress lo -35 Getting up -10 Reaching* |
4/04/06 |
Incomplete |
Incomplete |
Incomplete -68 Stairs -61 Getting up -61 Standing -58 Kneeling -10 Reaching |
100 Absolute † None below expected |
100 Absolute † None below expected |
40 Absolute ‡ -88 Bowel -84 Bladder -69 Left lower limb -69 Right lower limb -21 Left upper limb -21 Right upper limb |
100 Absolute † None below expected |
22 Absolute ‡ -68 Getting up -68 Stairs -67 Help walking -61 Standing -58 Kneeling -5 Dress lo -47 Toilet transfer -36 Tub/shower transfer -10 Reaching* |

What would you like to print?
- Measuring Outcomes In Rehabilitation Medicine
- Development of the UDSMR and the FIM Instrument
- Impairment Types
- Data Analysis and Reporting
- Function-related Group Classification and Case-mix Adjustment
- The Federal Payment System and Grouping Patients
- Continuum of Care
- Larger Picture for Medical Rehabilitation Outcomes Measurement
- Show All
- Media Gallery
- Tables
- References


