Overview
The motor unit (MU) is a part of the neuromuscular system that contains an anterior horn cell, its axon, and all the muscle fibers (MFs) that it innervates, including the axon's specialized point of connection to the MFs, the neuromuscular junction. The neuromuscular system also includes upper motor neuron inputs to the lower motor neuron as well as afferent inputs from the periphery such as position receptors in joints, Golgi tendon organs, and muscle spindles. The result is the ability of the muscle to make various patterns of contraction under the control of the upper motor neurons in the central nervous system (CNS).
In routine needle-electrode examination (ie, electromyography [EMG]) of voluntary muscle contraction, the electrodiagnostic consultant assesses the signature electrical signal generated by the MUs, termed the MU potential (MUP). This is the current preferred term rather than motor unit action potential because the MUP is not an action potential. It is a compound potential derived from the MF action potentials (APs) of a MU. The MUP can be considered the electrophysiologic analogue, but not equivalent, of the MU.
In addition, signals generated by individual or non-MU groupings of MFs, termed insertion activity (IA) and spontaneous activity (SA), are assessed. These are patterns of random or rogue sub-MUP activity that may yield important clues in the interpretation of the EMG signal. In electrodiagnosis, consideration of all such data is important, including neurography (ie, nerve conductions), before making a final assessment. The focus of this article is on MUs and the MUPs they generate, particularly in neuromuscular disorders in which remodeling of the MU may occur. To place these concepts in perspective, some review of basic clinical neurophysiologic concepts is necessary. This discussion also is predicated on the assumption that the reader has some basic understanding of EMG.
Beginning with the pioneering work of Professor Fritz Buchthal and colleagues in the 1950s, [1] the technique of EMG in MUP analysis has undergone much refinement. In the last 4 decades, the incorporation of computers into electromyograph systems and developments in needle electrodes and instrumentation have given greater capability to the electrodiagnostic consultant. This has created a renaissance in clinical studies of the MU, particularly with the work of Professor Erik Stålberg.
The formal analysis or quantitation of the MUP signal, termed quantitative analysis (QA), is currently not as cumbersome and time-consuming as in the past. It involves a discipline of quantitating the various features of the MUPs. However, electrodiagnostic consultants have become accustomed to the expedient of subjective assessment of the EMG signal in routine analysis. But there has been a general trend toward utilizing new technology in instrumentation (e.g., the trigger-delay feature in assessing MUPs).
QA is not needed in every clinical study, but careful analysis of the MUAP signal is essential. So why is an understanding of at least the principles of QA important? QA forms the foundation upon which routine subjective assessment of the MUP waveforms is made.
Over the decades, clinicians have become immured with a closed-mindedness that reflexively links the diagnosis to the waveforms (eg, myopathic MUP, neurogenic MUP, BSAPs [brief, small, abundant potentials]). Daube argued against this terminological approach long ago. [2] The EMG signal should be assessed in the context of all electrodiagnostic data. A diagnostic impression should not be intended to bias the referring clinician against other reasonable possibilities.
In every routine EMG study, therefore, a more formal or objective approach to MUP analysis should be made. This is accomplished by the electrodiagnostician training their eye to measure the size, complexity, and stability of the waveforms. This also means not being a passive observer of the waveforms as they race across the screen, but actively manipulating the EMG instrument's settings to elicit more information from the signal (ie, interacting with the instrument). The authors refer to this approach as objective-interactive EMG, a practical compromise to traditional QA. [3, 4]
This article primarily addresses the changes in MUAPs that may be observed in neuromuscular disorders. The approach is intended to correlate the changes in the waveforms with what may be observed in the underlying pathologic changes in the MUs. To do this, the electrodiagnostic consultant must modify their assessment of the waveforms to one more objective than the simple subjective assessment typically performed on routine EMG. The electrodiagnostic consultant must become familiar with the limitations of the instrumentation and be able to interact with the recording equipment, from the level of entry at the recording electrode to its display on the EMG.
Therefore, the goal of objective-interactive EMG is to extract reliable and reproducible information from the waveforms. In determining abnormality, consistency in abnormality should be established, as well as some impression of severity and timing. The latter refers primarily to neurogenic processes where relative staging of chronicity in reinnervation is possible. All electrodiagnostic data, including other studies, such as nerve conductions that are not addressed in this article, must also be considered. Some may consider EMG to be a mature area of investigation and mundane in clinical application. The authors hope this article stimulates the electrodiagnostic consultants to make each study an exciting objective-interactive challenge and to interpret the findings as an "electrophysiologic biopsy" of the muscle studied.
Table 1. Abbreviations used in this article (Open Table in a new window)
ACh |
Acetylcholine |
AP |
Action potential |
ATPase |
Adenosine triphosphatase |
CMAP |
Compound muscle action potential |
CN |
Concentric needle electrode |
CFL |
Critical firing level |
EMG |
Electromyography |
FF |
Fast twitch, fatigable (type II alpha MN) |
FR |
Fast twitch, fatigue-resistant (type II alpha MN) |
IA |
Insertion activity |
IP |
Interference pattern |
MF |
Muscle fiber |
MN |
Motoneuron |
MON |
Monopolar |
MU |
Motor unit |
MUP |
Motor unit potential |
MUT |
Motor unit territory |
NA |
Not applicable |
QA |
Quantitative analysis |
S |
Slow twitch, slow fatigue (type I alpha MN) |
SA |
Spontaneous activity |
SFEMG |
Single-fiber EMG |
Anatomy and types of MUs
The term MU, as defined by Sherrington, [5, 6] remains unchanged as being the anterior horn cell or alpha motoneuron (MN), its axon, and all the MFs it innervates, including the neuromuscular junctions. It remains the basic functional element of a skeletal muscle. Conversely, a muscle may be considered a grouping of MUs organized somatopically by their motorneurons in the spinal cord. The image below schematically illustrates 2 MUs in a muscle.
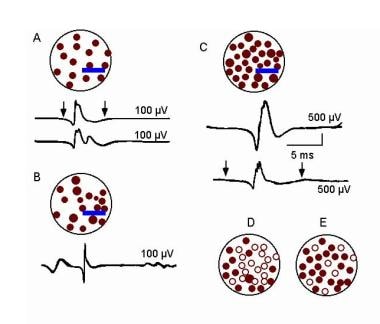
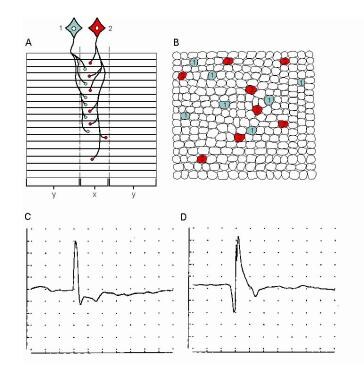 Electromyographic (EMG) evaluation of the motor unit (MU): electrophysiologic biopsy. Schematic shows 2 MUs. A, Muscle fibers (MFs) are shown in side view. The endplate zone is central to the MFs (x). Distal region of the MFs on either side of their endplates is where their action potentials are propagated (y), ie, away from the endplates. B, Schematic representation of A on transverse view (ie, cross-section) demonstrates the overlap of MFs from different MUs and thus overlap in MU territories (of which only a portion is shown). C, MU potential (MUP) is recorded from the endplate region (see A, region x) and is characterized by its initial negative deflection. D, MUP shows the typical triphasic appearance with an initial positive deflection. This implies that it is recorded along the MFs away from the endplate zone (see A, region y) (sensitivity 100 mV per division vertical; sweep 5 ms per division). With permission, copyright P.E. Barkhaus, MD, 2001.
There is no known polyneuronal innervation of mature human muscle (ie, a MF is not innervated by more than one MN). A MN may supply from 6 to 10 MFs in an extraocular muscle to hundreds of MFs in a large proximal limb muscle such as the biceps brachii. [7, 8, 9] The result is a remarkable expansion from controlling unit (ie, MN) to the endpoint of its apparatus (ie, MFs), in both anatomic and physiologic terms. This is termed the innervation ratio. There is minimal data on this with respect to specific muscles ranging from older studies (Feinstein) to more recent studies (Gesslbauer).
The endplate is that specialized region between the motor nerve terminal and the MF that mediates neuromuscular transmission (see image above, region x). The endplate zone is well demarcated in bipennate muscle, as shown in the work by Aquilonius et al. [10] Some larger limb muscles, such as the tibialis anterior, are multipennate, making the endplate zone more complicated. The endplate region on the MFs contains the acetylcholine (ACh) receptors. When these receptors are successfully activated the result is an endplate potential. Consequent to the endplate potential, an action potential (AP) is generated that spreads electrotonically down the length of the MF. As the AP travels down the MF membrane, the contractile apparatus is activated in turn.
The endplate zone in a healthy muscle is fairly homogeneous in that the endplates are usually at the mid portion along the length of the MFs (see image above). This may vary depending on the shape of the muscle. [10] Such positioning of the endplates allows greater efficiency in the bidirectional spread of the AP along the length of the MF membrane.
Relatively minimal data are available on MFs in humans. Knowing how MF length was assayed experimentally and differentiating between anatomic length and functional length are important. [11] MFs may vary considerably in length from approximately a few centimeters in the biceps brachii to less than 2 cm in smaller distal limb muscles. The configuration of a muscle is complicated further by the spatial arrangement of its MFs (eg, pinnate vs staggered). MFs have AP propagation velocities of 2–6 m/s (mean value 3.7 m/s).
The composition of a muscle by MF types (see Table 2 below) depends on a muscle's functional demands. The gastrocnemius, which has more of a role in static postural maintenance, tends to be represented more heavily with type S (ie, slow twitch, fatigue-resistant) alpha MNs (see Table 2 below). In contrast, the first dorsal interosseous muscle of the hand participates in more rapid, phasic movements and has more type FF (ie, fast twitch, fast to fatigue) MNs. Different classification schemes have been offered for MNs and MFs, which also may have some interspecies differences (see Table 2 below). [7, 8, 12, 13, 14, 15]
Table 2. Types of Alpha MNs and Their Corresponding MF Type* (Open Table in a new window)
|
Alpha MN Types |
||
Relative Characteristics |
I (S = slow twitch, fatigue resistant) |
II (FR = fast twitch, resistant to fatigue) |
II (FF = fast twitch, fast to fatigue) |
Neuronal cell-body size |
Smaller |
NA |
Larger |
Axonal diameter |
Smaller |
NA |
Larger |
Axonal conduction velocity |
Slow |
Fast |
Faster |
After-hyperpolarization time |
Long |
Intermediate |
Short |
Firing rate |
Slow and regular on minimal effort |
Intermediate |
Fast on strong effort |
Afferent input (ie, dendritic volume) |
Large |
Intermediate |
Small |
Relative excitability threshold |
Low |
Intermediate |
High |
Twitch tension |
Low, long |
Intermediate, long |
High, brief |
Contraction time |
>99 ms |
Intermediate |
< 85 ms |
Fatigability |
Slow |
Relatively slow |
Fast |
Force generated |
Low |
Moderately high |
High |
|
Corresponding MF Types |
||
Histochemical Reactivity |
1 |
2A |
2B |
Alkaline ATPase (pH 9.4) |
Low |
High |
High |
Acidic ATPase (pH 4.65) |
High |
Low |
Moderate |
Oxidative enzymes |
High |
Medium high |
Low |
Glycogen |
Low |
High |
High |
Phosphorylase |
Low |
High |
High |
Myoglobin |
High |
High |
Low |
ATPase = adenosine triphosphatase; NA = not applicable. *Although related, alpha MN subtypes are not equal to MF histochemical types. |
|||
The MU territory (MUT) is defined as "the area in a muscle over which the MFs belonging to an individual MU are distributed". [16] In humans, MUTs vary in size in different muscles. In a larger proximal limb muscle such as the biceps brachii, the MUT has an estimated diameter of 5–10 mm (ie, cross-section) based on scanning EMG studies. [17] Data from animals suggest greater dispersion of the MUT in a muscle that also may change in size along the length of the muscle. [11]
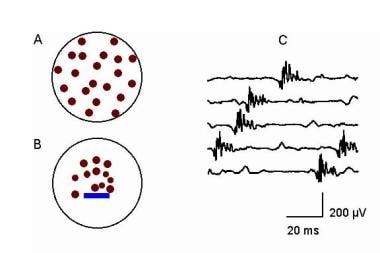
SFEMG fiber-density measurements in healthy muscle suggest that MFs (see image below, electrode C) are separated by about 300 µm. [18] MFs vary in diameter. In the upper and lower extremities, they range approximately 40–50 and 50–60 µm in diameter, respectively. Facial MFs are smaller, approximately 20–30 µm in diameter. Generally, MFs in males are slightly larger than those in females, by about 10%. [19] Regardless of the muscle, the inference is that MFs from other MUs separate MFs within the same MU as in a patchy, "mosaic" pattern.
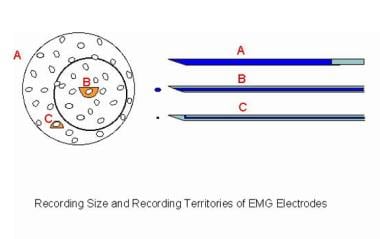 Electromyographic (EMG) evaluation of the motor unit (MU): electrophysiologic biopsy. Schematic compares 3 recording needle electrodes relative to a MU territory in a muscle. The recording surface of the macro-EMG electrode (A) is its cannula, which can extend throughout the MU territory. The concentric needle electrode (B) records from the inner core at its tip. The muscle fibers (MFs) closest to its tip contribute to such features as the amplitude (small semicircle), but it records from a moderate portion of the MU territory (circle). These MFs contribute to the duration feature of the MUP. The single-fiber EMG electrode is the most selective (C), with a recording surface of 25 μm diameter on the side of the needle's shaft. The recording area has a 300 μm radius. Image courtesy of www.casaengineering.com.
In a low-power histologic cross-section of muscle containing approximately 100 MFs, approximately 20–25 MUs are represented, with approximately 1–5 MFs per MU (see image below, section B). [8] This reflects the extensive interspersion of MFs from different MUs. Although an MU is homogeneous for the histochemical type of MF it contains, on routine histologic cross-section of muscle those MFs belonging to individual MUs still cannot be discerned. Newer techniques in quantitative histochemistry suggest a possible diversity in histochemical and biochemical properties even within the MFs of the same MU. [7, 8, 20]
Electromyographic (EMG) evaluation of the motor unit (MU): electrophysiologic biopsy. Schematic shows 2 MUs. A, Muscle fibers (MFs) are shown in side view. The endplate zone is central to the MFs (x). Distal region of the MFs on either side of their endplates is where their action potentials are propagated (y), ie, away from the endplates. B, Schematic representation of A on transverse view (ie, cross-section) demonstrates the overlap of MFs from different MUs and thus overlap in MU territories (of which only a portion is shown). C, MU potential (MUP) is recorded from the endplate region (see A, region x) and is characterized by its initial negative deflection. D, MUP shows the typical triphasic appearance with an initial positive deflection. This implies that it is recorded along the MFs away from the endplate zone (see A, region y) (sensitivity 100 mV per division vertical; sweep 5 ms per division). With permission, copyright P.E. Barkhaus, MD, 2001.
The MN exhibits considerable plasticity. Cross-innervation experiments have demonstrated that MFs may change their histochemical type. Fast MUs also may be changed experimentally to slow MUs by constant electrical stimulation, thymectomy, and castration. Exercise training in rats did not change the proportion of MN subtypes (see Table 2 above), which under usual conditions is fixed. [21] In the resting state, the MN continues to release quanta of acetylcholine in a random manner (ie, miniature endplate potentials) that is thought to have a trophic effect on muscle.
Subsequent to early development in animals, fast MUs may change to slow MUs with increasing age and body size, presumably in response to increased body weight and hence the need for more type S or tonic MUs. By selective training in which force is generated, MFs may hypertrophy, particularly the type II MFs. Endurance training alone (eg, running) generally does not result in MF hypertrophy. The exact mechanisms of force generation in muscle and the functional connections of the MFs to the extracellular matrix are still incompletely understood. [22, 7, 8]
Aging produces effects on the MU. [23, 24, 25, 26] Elderly individuals typically experience decrease in muscle bulk or sarcopenia. This is probably due to generalized atrophy of individual MFs rather than to a decrease in the total number of MFs. Type II MF atrophy is a frequent change noted in aging. Muscle biopsy of healthy elderly individuals also exhibited evidence of MU remodeling. This was based on the findings of targetoid MFs and mild degrees of MF type grouping. [26]
Electrophysiologic evidence of MU remodeling in elderly individuals comes from 3 observations. First, the concentric needle (CN) MUP demonstrates an increase in duration with increased age, though not to any significant degree until the individual is older than 60 years. [27, 28] Second, the (muscle) fiber density as measured in SFEMG increases after the sixth decade. [18] This is the electrophysiologic analogue to MF type grouping but is based on the MU discharge rather than histochemical grouping. Third, macro-EMG MUP amplitude in the vastus lateralis and anterior tibial muscles becomes larger after the sixth decade. [29] Studies of older indviduals using other techniques such as surface-recorded MUPs suggest a significant decline in numbers of MUs. This is an ongoing caveat in trying to reconcile results between electrophysiological techniques. [30]
These specialized EMG techniques are discussed in the Equipment section below. They collectively demonstrate changes in the MU compatible with reinnervation as suggested by the MF type grouping on muscle biopsy. Hence, these quantitative EMG and histologic findings suggest a drop out of MNs as aging proceeds beyond the fifth decade. Data from investigators counting motor axons in anterior roots support the concept of MN loss, [23] though dying back of motor axons cannot be excluded.
Homogeneity is found in the MFs supplied by a given alpha MN. Hence, a type I (ie, S alpha MN) has only histochemical type I MFs in its MU (see image below). If an MF is orphaned (eg, denervated), it assumes the characteristics of the MN, subsequently reinnervating it. Therefore, under such conditions, a histochemical type I MF may become a type II, or vice versa. During development, one neuron supplies a terminal axon to one MF. As stated above, polyneuronal innervation of MFs does not likely occur in the normal mature state. Polyneuronal innervation exists in early development but disappears in rats and kittens by the age of 6 weeks. A similar phenomenon may occur transiently in reinnervation after denervation before full maturation of the reinnervation process occurs. [22, 7, 8]
Electromyographic (EMG) evaluation of the motor unit (MU): electrophysiologic biopsy. Schematic shows 2 MUs. A, Muscle fibers (MFs) are shown in side view. The endplate zone is central to the MFs (x). Distal region of the MFs on either side of their endplates is where their action potentials are propagated (y), ie, away from the endplates. B, Schematic representation of A on transverse view (ie, cross-section) demonstrates the overlap of MFs from different MUs and thus overlap in MU territories (of which only a portion is shown). C, MU potential (MUP) is recorded from the endplate region (see A, region x) and is characterized by its initial negative deflection. D, MUP shows the typical triphasic appearance with an initial positive deflection. This implies that it is recorded along the MFs away from the endplate zone (see A, region y) (sensitivity 100 mV per division vertical; sweep 5 ms per division). With permission, copyright P.E. Barkhaus, MD, 2001.
The alpha MNs are arranged somatotopically into groups in the ventral horn according to myotomes and, in turn, the muscles that they supply. A group of alpha MNs supplying a muscle is organized in a vertical column within the ventral horn such that the rostral MNs supply the superficial and proximal MUs of the muscle and the more caudal MNs supply the deeper and more caudal MUs. Knight and Kamen reported that superficial MUs were larger relative to deeper MUs, as studied by using macro EMG. [31] In humans, almost all muscles are supplied by more than 1 root, allowing some protective effect in a single-level radiculopathy. The percent proportion of supply of a given muscle by a specific root may vary among individuals as well as between sides in the same individual. [32]
See Muscular System Anatomy and Autonomic Nervous System Anatomy for more information.
Physiology of the MU - Activation and control of MU discharges
Recruitment is defined as "the successive activation of the same and additional MUs with increasing strength of voluntary muscle contraction". [16] It is a complex process that is under CNS control. MU recruitment results in a strong efficient muscle contraction. Patterns of recruitment may differ between various types of motor activation (eg, slow isometric muscle contraction vs ballistic movement). The former pattern is used in routine clinical EMG assessment of MUPs (see image below); hence, a bias exists toward examination of the lower threshold, type S MUs. In healthy muscle, a programmed pattern of activation of MUs is under central control, depending on the type of activation needed (eg, slow postural movement vs rapid phasic movement). [13, 14, 33, 34, 15, 35]
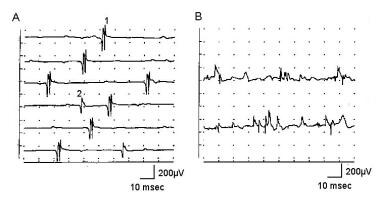 Electromyographic (EMG) evaluation of the motor unit (MU): electrophysiologic biopsy. Normal recruitment in deltoid muscle (A) recording with a concentric needle electrode: The first MUP is discharging at 13-15 Hz when a second, smaller MUP is recruited on sweep 4, discharging at 4 Hz. Potential 1 appears polyphasic, but only 4 phases are present. B shows 2 sweeps recruitment in myopathy with mild voluntary effort. The baseline appears relatively full, and individual MUPs cannot be identified without reducing level of effort and use of trigger delay. Calibration settings are as indicated. With permission, copyright P.E. Barkhaus, MD, 2001.
The size principle refers to alpha MN size relative to its order of recruitment in a population of MUs that comprises the fundamental organizational units of a muscle. The soma of alpha MNs vary in size, accounting for some of the differences between MU types I and II. Definite differences exist in other properties (see Table 2 above). Dendritic volume (ie, number of excitatory synapses on the neuronal soma) is constant in the 2 types of alpha MNs. Therefore, smaller type I MNs have relatively greater excitatory input given their smaller membrane size. In contrast, type II alpha MNs have a larger membrane, but given the same number of excitatory inputs, they have a lower excitatory potential. [7, 13, 14, 15]
Critical firing level (CFL) is a specific MU property whereby a MN has a precise and reliable level or threshold of excitation at which it discharges. It ceases to discharge when input drive to the MN pool drops below the CFL. This also may be termed functional threshold. This has a narrow range of approximately 1-3% as demonstrated by varying input stimulation. [7, 13, 14]
Although recruitment gradation refers to the number of alpha MNs being activated, rate gradation refers to the discharge frequency of a specific MN. In a smooth, graded isometric contraction (ie, ramp), a muscle must be capable of prolonged activation that is relatively resistant to fatigue. This is achieved by the size principle, in that the small type I MNs are activated initially. A single MU is activated first. With further effort, an increased rate gradation occurs within that particular MN before central input to a second MN (ie, recruitment gradation) reaches its CFL and begins to discharge. This continues until the larger type II MNs reach their CFLs and are activated. The type II MNs after the Type I MUs, as they are less resistant to fatigue. [7, 13, 14, 15]
Recruitment frequency is a clinical electrodiagnosis method used to assess the firing rate of a MU. This technique can be performed only at a low level of motor unit activation when MUPs can be clearly differentiated as they are recruited. [3, 4, 33, 36, 34] In normal muscle, an MU shows a rate gradation of 5–15 Hz before a second MU is recruited. The firing rate of the first MU is measured immediately prior to the point at which the second MU is activated. In myopathy, the recruitment frequency is reduced. The reverse occurs in a neurogenic process: the recruitment frequency may be increased, reflecting the loss of MUs.
To correlate with routine EMG needle examination, bias exists in assessing the waveforms of type I MNs. This is because the recording is made at low levels of activation (ie, voluntary muscle effort). MUP amplitudes are relatively lower than at higher levels of activation. At maximal levels of voluntary effort, MUAP amplitudes increase, reflecting activation of the larger type II MUs and superimposition of the discharging MUs. Special studies such as precision decomposition have demonstrated that in healthy human muscle, MUs may discharge at rates approaching 50 Hz at maximal effort. [37]
In practical application, the MUP amplitude reflects the size and distance of the closest MF to the recording surface of the needle electrode (see first image below, section A). [38, 39] Thus this does not reflect MU size. As force is increased, some recruited MUs have MFs very close to the needle electrode’s recording surface. Their MUPs are recognized easily by their relatively large size given their proximity to the needle electrode. Conversely, higher threshold MUs that are distant to the electrode recording surface will have smaller amplitude MUPs (eg, the second recruited MUP in the second image below, the second recruited MUP is smaller than than the first recruited MUP). Differentiating between Type I and Type II MUs on routine concentric needle EMG is not possible because of the selectivity of the electrode. Thus, the size principle is not demonstrated in CN EMG recordings. [40]
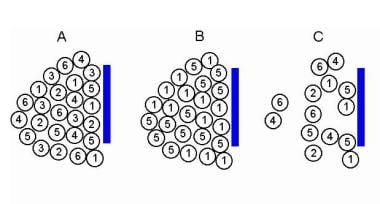 Electromyographic (EMG) evaluation of the motor unit (MU): electrophysiologic biopsy. Models to demonstrate increased recruitment frequency. A, Healthy muscle in which muscle fibers (MFs) from 6 MUs are observed close to the recording electrode. B, only 2 MUs have MFs close to the recording electrode surface; as this is a process of partial MU loss with subsequent reinnervation. C shows loss of MFs from MUs 2, 3, and 6 near the recording electrode, as may be observed in a myopathy. But MFs from only two MUs are actually close to the recording electrode surface (MUs 1 and 5) to give MUPs with sharp rise times. MUs 2, 4, and 6 are away from the recording surface and may be quite low in amplitude and appear as baseline noise, giving the erroneous impression of a reduced number of MUs. Courtesy of www.casaengineering.com.
Electromyographic (EMG) evaluation of the motor unit (MU): electrophysiologic biopsy. Normal recruitment in deltoid muscle (A) recording with a concentric needle electrode: The first MUP is discharging at 13-15 Hz when a second, smaller MUP is recruited on sweep 4, discharging at 4 Hz. Potential 1 appears polyphasic, but only 4 phases are present. B shows 2 sweeps recruitment in myopathy with mild voluntary effort. The baseline appears relatively full, and individual MUPs cannot be identified without reducing level of effort and use of trigger delay. Calibration settings are as indicated. With permission, copyright P.E. Barkhaus, MD, 2001.
Electromyographic (EMG) evaluation of the motor unit (MU): electrophysiologic biopsy. Models to demonstrate increased recruitment frequency. A, Healthy muscle in which muscle fibers (MFs) from 6 MUs are observed close to the recording electrode. B, only 2 MUs have MFs close to the recording electrode surface; as this is a process of partial MU loss with subsequent reinnervation. C shows loss of MFs from MUs 2, 3, and 6 near the recording electrode, as may be observed in a myopathy. But MFs from only two MUs are actually close to the recording electrode surface (MUs 1 and 5) to give MUPs with sharp rise times. MUs 2, 4, and 6 are away from the recording surface and may be quite low in amplitude and appear as baseline noise, giving the erroneous impression of a reduced number of MUs. Courtesy of www.casaengineering.com.
Electromyographic (EMG) evaluation of the motor unit (MU): electrophysiologic biopsy. Normal recruitment in deltoid muscle (A) recording with a concentric needle electrode: The first MUP is discharging at 13-15 Hz when a second, smaller MUP is recruited on sweep 4, discharging at 4 Hz. Potential 1 appears polyphasic, but only 4 phases are present. B shows 2 sweeps recruitment in myopathy with mild voluntary effort. The baseline appears relatively full, and individual MUPs cannot be identified without reducing level of effort and use of trigger delay. Calibration settings are as indicated. With permission, copyright P.E. Barkhaus, MD, 2001.
Indications
Electrophysiologic Biopsy
The "electrophysiologic biopsy" is a concept introduced to emphasize that concordance should exist between the electrophysiologic findings and the findings on muscle biopsy in various disease processes. This is not to suggest that conventional biopsy actually would be performed in muscles affected by a focal structural process such as a radiculopathy. The authors do this to take their formalized method of analysis (ie, objective-interactive EMG) to the next step of analysis and interpretation. This is done to comprehensively look at the electrophysiologic data to make inferences as to how the MU is remodeled in disease processes. This serves as a reminder to the electrodiagnostic consultant of his or her responsibility to carefully analyze and interpret the data to accurately reflect the disease process.
EMG differs from other electrophysiologic studies, such as EEG. The latter is a physiologic procedure that passively records the signals from central neuronal generators using preset montages. EMG is quite different. There is no standard "montage" to record myogenic activity both at rest and during volitional movement. The recording electrode is also constantly being manipulated by the electrodiagnostic consultant so as to optimize the signal. The MUAP waveform is also unique in that it may offer clues as to how the MU is remodeled in a particular disease process.
Sampling is critical, since the normal "mosaic" distribution of the MFs within the MUT is altered in many neuromuscular disorders. [41] Also, as shown in image below, needle electrode position within the MUT influences the MUP waveform. The "electrophysiologic biopsy" approach samples not only multiple "biopsy" or sampling sites within a muscle, but permits "electrophysiologic biopsy" or sampling of other muscles as indicated (depending on the clinical problem). This makes the needle electrode examination an excellent tool to sample sufficient sites when pathology may be minimal in severity or patchy in distribution. This minimizes sampling error. In cases where conventional muscle biopsy is needed (eg, as in myopathy), this approach may be quite helpful in determining the optimal choice of biopsy site for optimal diagnostic yield.
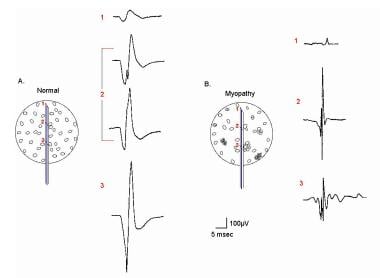 EMG evaluation of the MU: the electrophysiologic biopsy. Influence of needle electrode position in a healthy (A) and a myopathic (B) MU. Note in the normal MU (A) how the MUP durations change little during movement of the electrode through the MU territory. Note also in electrode position 2 in the normal MU that 2 MUPs are recorded with a slight change (rotation) of the electrode. This slight change in electrode position substantially affects the prominence of the turn seen on the negative slope of the second MUP from the top. In myopathy (B), movement of the needle electrode through the MU territory results in marked changes in the MUPs recorded from the same MU. With permission, copyright P.E. Barkhaus, MD, 2001.
Beyond the MUAP waveform, patterns of MUAP activation (recruitment) should be evaluated, as well as other data such as IA, SA, and nerve conductions. Recruitment of MUs is not covered in detail in this section. It requires special evaluation, and interpretation may be difficult. The reader is referred to other detailed discussions on MU recruitment. [3, 42, 43] The 3 major categories of basic neuromuscular disease processes (ie, myopathy, neuropathy, disorders of neuromuscular transmission) are described in this section.
Myopathic Disorders
The quintessential process in myopathies is the loss or dysfunction of MFs, including alteration of their distribution within the MUT, resulting in abnormal muscle function (see images below). Such abnormalities are reflected in changes in the myogenic signal.
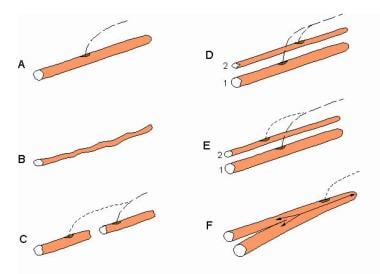 Electromyographic (EMG) evaluation of the motor unit (MU): electrophysiologic biopsy. Schematic of alterations in single muscle fibers (MFs) that contribute to changes in their action potentials (APs). A, healthy MF. B, Atrophy of the MF that results in a smaller AP. C, MF with segmental necrosis. In this instance the terminal axon branch (ie, innervated end to the right) has sent a collateral axon branch to the orphaned end (left) to reinnervate it. A terminal axon branch from an adjacent nonaffected MF also could have provided the source for the reinnervating collateral branch. D, Innervation of a denervated MF (2) by means of a collateral branch from an unaffected MF from another motor unit (1). E similar to D, shows the innervation of a regenerated MF from satellite cells via a collateral axonal branch from an adjacent MF. F, the MF is split distal to the endplate. Although a single arrow shows the AP propagating to the right, the AP propagating left into the split goes down each branch. An electrode recording from the split end would detect 2 APs with no jitter since they share a common end plate. Such splits may occur in hypertrophied MFs. With permission, copyright P.E. Barkhaus, MD, 2001.
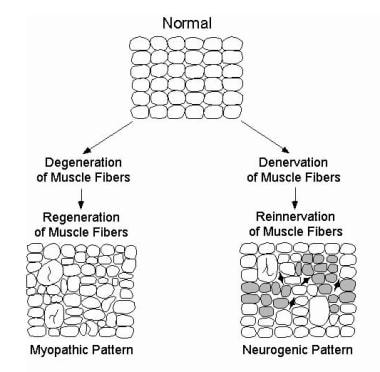 Electromyographic (EMG) evaluation of the motor unit (MU): electrophysiologic biopsy. Schematic showing typical alterations of MFs and their spatial arrangement in a myopathic process (bottom left) and neurogenic process (bottom right). Enlarged MFs represent MF hypertrophy, that may be seen in either process and may be associated with MF splitting. Specific disease processes within each pattern may vary (eg, not all myopathic processes exhibit MF hypertrophy). Also, the schematics are not intended to show specific changes in disease processes that do not directly influence the motor unit action potential waveform (eg, inflammatory cells). In the neurogenic pattern, shaded MFs represent those that would show fiber type grouping on histochemical staining. This technique does not reveal MFs innervated by a single MN (ie, an “enlarged” or reinnervated motor unit). Dark, angular MFs represent those that are still denervated and that have not yet undergone reinnervation. These would not contribute to the MUP. With permission, copyright P.E. Barkhaus, MD, 2001.
If muscle is affected significantly by a disease process, MUP amplitude is reduced, particularly when MF atrophy is present (see section B of the image below, MUP 1; see MUP 2 in the second image below).
EMG evaluation of the MU: the electrophysiologic biopsy. Influence of needle electrode position in a healthy (A) and a myopathic (B) MU. Note in the normal MU (A) how the MUP durations change little during movement of the electrode through the MU territory. Note also in electrode position 2 in the normal MU that 2 MUPs are recorded with a slight change (rotation) of the electrode. This slight change in electrode position substantially affects the prominence of the turn seen on the negative slope of the second MUP from the top. In myopathy (B), movement of the needle electrode through the MU territory results in marked changes in the MUPs recorded from the same MU. With permission, copyright P.E. Barkhaus, MD, 2001.
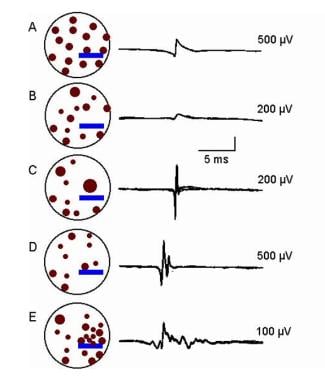 Electromyographic (EMG) evaluation of the motor unit (MU): electrophysiologic biopsy. Schematic of MU in a myopathic process with associated MUPs; amplitude calibrations as indicated. A, Normal pattern. B-E, Various alterations in the MUP waveforms. These are based on alterations in MF size, their distribution within the MU territory, and their proximity to the electrode’s recording surface. Courtesy of www.casaengineering.com.
MUP amplitude may be normal if the recording electrode surface is near even one functioning MF and may even be increased in amplitude if the MF is hypertrophied (assuming normal membrane function), as shown in section C of the image below. MUP area is reduced and, in simple MUPs, duration also may be reduced. In some myopathic processes, the myogenic signal may not be altered if the process involves primarily the subsarcolemmal structures (eg, contractile mechanism).
Electromyographic (EMG) evaluation of the motor unit (MU): electrophysiologic biopsy. Schematic of MU in a myopathic process with associated MUPs; amplitude calibrations as indicated. A, Normal pattern. B-E, Various alterations in the MUP waveforms. These are based on alterations in MF size, their distribution within the MU territory, and their proximity to the electrode’s recording surface. Courtesy of www.casaengineering.com.
Loss of MFs alone does not result in polyphasic or serrated MUPs. MF diameter variability produces increases in phases or turns by desynchronizing the main spike signal (see MUP 2 in B of the first image below and “E” of the second image). This often increases the MUP duration. MF hypertrophy may result in MF splitting. In myopathy, MUP complexity and duration are not correlated with chronicity of the process. [44]
EMG evaluation of the MU: the electrophysiologic biopsy. Influence of needle electrode position in a healthy (A) and a myopathic (B) MU. Note in the normal MU (A) how the MUP durations change little during movement of the electrode through the MU territory. Note also in electrode position 2 in the normal MU that 2 MUPs are recorded with a slight change (rotation) of the electrode. This slight change in electrode position substantially affects the prominence of the turn seen on the negative slope of the second MUP from the top. In myopathy (B), movement of the needle electrode through the MU territory results in marked changes in the MUPs recorded from the same MU. With permission, copyright P.E. Barkhaus, MD, 2001.
Electromyographic (EMG) evaluation of the motor unit (MU): electrophysiologic biopsy. Schematic of MU in a myopathic process with associated MUPs; amplitude calibrations as indicated. A, Normal pattern. B-E, Various alterations in the MUP waveforms. These are based on alterations in MF size, their distribution within the MU territory, and their proximity to the electrode’s recording surface. Courtesy of www.casaengineering.com.
Besides MF diameter variability, other possible reasons for increased complexity in myopathic processes include innervation of satellite cells as they develop into MFs. Finally, when loss of endplate areas occurs due to segmental necrosis (such as in inflammatory myopathy), MFs may be innervated or reinnervated. Though uncommon, instability (subjectively seen as increased jitter or "jiggle") [45] in MUPs may occasionally occur in myopathic processes. This is not a prominent finding. See section B of the first image below and section A of the second image.
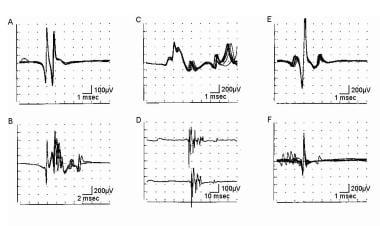
 Electromyographic (EMG) evaluation of the motor unit (MU): electrophysiologic biopsy. Trigger delay in instrumentation (calibration for A-E is 100 mV vertical, 5 ms horizontal per division): A shows 4 sweeps on free run mode from a patient with myopathy. First potential occurs at almost the same position on each sweep, indicating a steady firing rate of approximately 10 Hz. Second, smaller potential is discharging slightly faster, shifting left, to where it superimposes on potential 1 on the fourth sweep. Use of trigger delay is essential to ascertain each potential by visualizing it at least 3 times. B is a free run recording of rastered sweeps from a patient with severe myopathy. At least 2 MU potentials (MUPs) are seen as denoted by the numbers. The enlarged potential on the first sweep (open arrow) is the result of superimposition of MUPs 1 and 2. By slight manipulation of the recording electrode, trigger delay on potential 1 (C) shows a highly complex MUP that is unstable even at standard settings (note change in pattern of peaks). Two late components (“B” and “C”) are readily appreciated that are separated by baseline. Although this is observed in B sweep 2, demonstrating recurrence of the waveform 3 times is essential before ascertaining it as a MUP. D shows trigger delay on MUP 1. The highly complex MUP 2 is observed shifting left on subsequent sweeps, superimposing on potential 1 on sweeps 3 and 4. Another sweep showing potential 1 is needed to verify it as a bona fide MUP. In E, the recording electrode is manipulated slightly, and the trigger-delay now is set on MUP 2, thus confirming it as a complex MUP. MUP 1 is observed to the right on the top sweep and partially on the bottom sweep. With permission, copyright P.E. Barkhaus, MD, 2001.
 Electromyographic (EMG) evaluation of the motor unit (MU): electrophysiologic biopsy. Reduced recruitment. Single, fast, firing MUs are recorded in a severely weak muscle in a patient with myopathy (A) and a patient with neuropathy (B). MUP in A is complex and unstable. Note the missing large-amplitude spike as indicated by the thin arrow on sweep 4. Careful examination of the other complex waveforms reveals subtle changes among them, further demonstrating their instability. Open arrows on sweeps 3-5 indicate low-amplitude potentials on the baseline that represent small MUPs with few remaining MFs. These are easily overlooked unless the sensitivity is increased giving the false impression of a reduced number of MUPs as may be seen in a neurogenic process (see B). In B the MUP has very high amplitude and is considered a “giant MUP.” Calibration is as indicated. Courtesy of www.casaengineering.com.
If MF loss occurs, the APs from more distant MFs that contribute to the initial and terminal components of the MUP are lost, and duration becomes shortened (see image below). MUP duration has the inherent lower limit of the duration of a single MF AP, ie, a fibrillation potential. In simulation studies, a temporal dispersion of 1-2 milliseconds can easily produce a MUP with a duration of 4–5 milliseconds in a MU containing 5–15 MFs. The latter is observed in some healthy small muscles. A healthy larger muscle such as the biceps brachii, which has more than 200 MFs in its MUs, has a duration of 10–12 milliseconds. In simulation studies, 100–200 MFs generated the normal MUP duration. Hence, the relationship between the number of MFs in a MU and MUP duration is nonlinear. Smaller muscles that have shorter durations under normal circumstances (eg, distal hand muscles, laryngeal muscles) are thus unsuitable in assessing myopathy.
Electromyographic (EMG) evaluation of the motor unit (MU): electrophysiologic biopsy. Schematic of MU in a myopathic process with associated MUPs; amplitude calibrations as indicated. A, Normal pattern. B-E, Various alterations in the MUP waveforms. These are based on alterations in MF size, their distribution within the MU territory, and their proximity to the electrode’s recording surface. Courtesy of www.casaengineering.com.
Recruitment in myopathic processes may be difficult to assess. The central drivers (ie, upper MNs) are unaffected. In some myopathies, the early activated MUs controlled by the first-order neurons are not observed because of severe MF loss (see “C” of the first image below, “A” of the second image, and the third image). The higher threshold MUs controlled by second and third order neurons appear to be earlier in onset of activation. The result is the spurious pattern of reduced number of MUs firing rapidly for effort. This may be observed in moderately to severely affected muscles. The electrodiagnostic consultant should be cautious in describing neurogenic recruitment or IPs in the setting of MUP waveforms that suggest a myopathic process (i.e. small amplitude, short duration complex MUPs). [3]
Electromyographic (EMG) evaluation of the motor unit (MU): electrophysiologic biopsy. Models to demonstrate increased recruitment frequency. A, Healthy muscle in which muscle fibers (MFs) from 6 MUs are observed close to the recording electrode. B, only 2 MUs have MFs close to the recording electrode surface; as this is a process of partial MU loss with subsequent reinnervation. C shows loss of MFs from MUs 2, 3, and 6 near the recording electrode, as may be observed in a myopathy. But MFs from only two MUs are actually close to the recording electrode surface (MUs 1 and 5) to give MUPs with sharp rise times. MUs 2, 4, and 6 are away from the recording surface and may be quite low in amplitude and appear as baseline noise, giving the erroneous impression of a reduced number of MUs. Courtesy of www.casaengineering.com.
Electromyographic (EMG) evaluation of the motor unit (MU): electrophysiologic biopsy. Reduced recruitment. Single, fast, firing MUs are recorded in a severely weak muscle in a patient with myopathy (A) and a patient with neuropathy (B). MUP in A is complex and unstable. Note the missing large-amplitude spike as indicated by the thin arrow on sweep 4. Careful examination of the other complex waveforms reveals subtle changes among them, further demonstrating their instability. Open arrows on sweeps 3-5 indicate low-amplitude potentials on the baseline that represent small MUPs with few remaining MFs. These are easily overlooked unless the sensitivity is increased giving the false impression of a reduced number of MUPs as may be seen in a neurogenic process (see B). In B the MUP has very high amplitude and is considered a “giant MUP.” Calibration is as indicated. Courtesy of www.casaengineering.com.
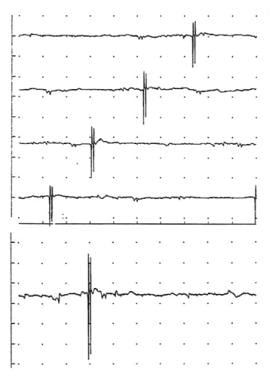 Top - A large, complex motor unit potential (MUP; 5 phases, approximately 2500 microV amplitude and 3 ms duration) firing at a progressively increasing rate (ie, shifting left) at about 13 Hz in apparent isolation. In normal muscle, other motor units would be typically recruited at this threshold (calibration 1 mV/division vertical; 10 ms/division horizontal). In the bottom trace the sensitivity is increased to 500 microV/division vertical (no change in horizontal time base), showing very small MUPs in the baseline on either side of the large MUP. This may give an erroneous impression of a “neurogenic” MUP, as these small potentials are overlooked easily or mistaken for baseline noise or fibrillation potentials. Note also that despite the large amplitude of this MUP, the spikes have essentially no area, giving them a very sharp, “needle-like” appearance. Copyright, Paul E Barkhaus, MD, 2000, with permission.
In summary, increased MUP complexity (ie, increased phases, turns, or linked components) may be observed as a sensitive but nonspecific finding of abnormality in early or mild myopathy. Abnormalities specific for myopathy include short MUP duration or reduced area, particularly the area-to-amplitude ratio (ie, the "thinning" of the main spike of the MUP). [39] Although MUP amplitude may be decreased in myopathy, it may be normal or even increased. [46, 47, 48]
In a serial quantitative EMG study of sporadic inclusion body myositis, the more selective concentric needle electrode was useful in detecting remodeling of the MUs but was not useful in correlating with clinical strength of the muscle studied (biceps brachii). [47] The macro-EMG MUPs recorded by the less selective macro-EMG electrode correlated better with change in clinical strength between patients and over time. The latter observation makes sense in that the macro-EMG MUP reflects the contribution of most all MFs to its MUP signal than that of the more selective (ie, smaller recording surface) concentric electrode.
Neurogenic Disorders
In neurogenic disorders, whole MUs are lost by virtue of loss of their MNs or axons. In processes such as axonal polyneuropathies, partial losses of MUs may occur progressively as axons degenerate. In such instances, however, the axons generally degenerate or die back in segments, making total loss of the MU more likely than partial loss of the MU. The severity in dropout of MUs in a muscle may range from partial to complete loss. In general, the MU uses 2 basic compensatory mechanisms to regain function. One way is MF hypertrophy. The second is the reinnervation of orphaned MFs that have lost their controlling MNs. This is accomplished by other surviving MUs, the MFs of which are interspersed within their original MUT (see image below). A final mechanism is possible, when an axon that is cut off from the MFs it innervates regrows into the muscle. The latter may be seen in trauma.
 Electromyographic (EMG) evaluation of the motor unit (MU): electrophysiologic biopsy. MU architecture in neurogenic process characterized by partial loss of MUs. “A” shows normal pattern with 2 MUPs (arrows denote MUP duration) that might be recorded by a concentric electrode (blue bar). In “B”, a surviving MU is reinnervating MFs from a denervated MU. Portions of the MU territory of the surviving MU may have normal distribution of the MFs if no reinnervation is occurring in that area. The MUP becomes complex with increased duration (note also the late component in “B” under the voltage marker). “C” is a more severe example of chronic ongoing MU loss with reinnervation by a surviving MU. Collateral reinnervation, as shown by MF type grouping on muscle biopsy, will be prominent. Shown are 2 MUPs that might be recorded by a concentric electrode (blue bar). These are enlarged in amplitude and duration (note difference in amplitude calibration compared with A: duration measurement at 100 mV sensitivity would be greater as shown in the second serrated MUP below, where duration is denoted by arrows). In “D” and “E”, schematic representations of “fractionation” are shown, in which previously reinnervated MFs (open circles) in an enlarged MU undergo denervation a second time. Courtesy of www.casaengineering.com.
For general categorization, neurogenic processes can be divided into 2 basic types that share common characteristics but different patterns on EMG: acute-onset monophasic denervation that may range from partial to complete MU loss (eg, nerve trauma [49] ), followed by reinnervation. The other pattern is an ongoing, progressive chronic neurogenic process. In such instances, variable rates of progression may exhibit concurrent denervation and reinnervation (eg, diabetic polyneuropathy, motor neuron disease, spondylotic radiculopathy). The electrodiagnostic consultant must rely heavily on the history, examination, and other electrophysiologic data such as nerve conductions to help decide which pattern is most likely.
Acute onset monophasic partial loss of MUs
Acute onset, monophasic partial loss of MUs may occur with partial trauma to a nerve trunk or root. [49] The motor axons involved fail to propagate their impulses from their central MNs past the site of the lesion. Assuming actual acute axonal loss (vs temporary block from compression, which is typically a transient lesion), MU structure (i.e., the distribution of the MFs with the MUT) initially is unchanged. Between onset and 7–10 days after onset, degeneration of the distal axon occurs. Before this time, the compound muscle action potential (CMAP) evoked distal to the lesion is normal despite clinical weakness. Increase in IA supervenes after several days, and SA such as fibrillation potentials occur at 21 days, sooner in axons of shorter length (eg, facial nerve). [50]
The voluntary activity in the EMG in this initial period demonstrates a decrease in recruitment of normal appearing MUPs, roughly reflecting the severity of the lesion. In turn, the IP is reduced. The MUP amplitude is defined by MFs within 0.5 mm of the electrode tip. If the MU activated has no MFs within the electrode’s recording area, it does not contribute to the measurement of the IP. If the activated MU is out of range of the recording electrode, it does not exist (even though the MU may be activated at a distance remote from the recording electrode, yielding "distant," low amplitude activity on the signal baseline). In such instances, the electrodiagnostic consultant may need to “search”(i.e. move the recording electrode) to find MUPs that can be recorded.
The area near the recording electrode tip is normally represented by MFs from approximately 20 MUs. Assuming a normal firing rate of 20 Hz at full effort (IP), this results in 400 spikes per second (assuming a spike duration of 5 ms at a lower sensitivity setting on the amplifier). This is adequate to fill the display screen to show a full IP (ie, >500 ms of a 1-s baseline epoch).
Now assume a 50% loss of MUs. By using the same values as given above, more than half the baseline will still remain full. Therefore, a reduced pattern of baseline may not be seen until more than half of the MUs are lost. In uncomplicated cases, MUP waveforms are normal during this acute period, as they represent the unaffected (ie, surviving) MUs prior to the reinnervation phase.
In the weeks after the acute insult, the MUPs begin to exhibit changes in their waveforms that reflect the reinnervation process. This is achieved by collateral sprouting from the terminal axons of the surviving MUs. These terminal axons are responding to the trophic signals from the denervated or orphaned MFs from the lost MUs. This requires development of new collateral branches to these denervated MFs with the establishment of new synapses (see images below). The once relatively narrow, well-defined endplate zone of the surviving MU adopting these MFs now becomes more diffuse. The once denervated, small orphaned MFs begin to increase in diameter as reinnervation is established and they become functional within the MU that “adopted” (innervated) them.
Electromyographic (EMG) evaluation of the motor unit (MU): electrophysiologic biopsy. Schematic of alterations in single muscle fibers (MFs) that contribute to changes in their action potentials (APs). A, healthy MF. B, Atrophy of the MF that results in a smaller AP. C, MF with segmental necrosis. In this instance the terminal axon branch (ie, innervated end to the right) has sent a collateral axon branch to the orphaned end (left) to reinnervate it. A terminal axon branch from an adjacent nonaffected MF also could have provided the source for the reinnervating collateral branch. D, Innervation of a denervated MF (2) by means of a collateral branch from an unaffected MF from another motor unit (1). E similar to D, shows the innervation of a regenerated MF from satellite cells via a collateral axonal branch from an adjacent MF. F, the MF is split distal to the endplate. Although a single arrow shows the AP propagating to the right, the AP propagating left into the split goes down each branch. An electrode recording from the split end would detect 2 APs with no jitter since they share a common end plate. Such splits may occur in hypertrophied MFs. With permission, copyright P.E. Barkhaus, MD, 2001.
Electromyographic (EMG) evaluation of the motor unit (MU): electrophysiologic biopsy. Schematic showing typical alterations of MFs and their spatial arrangement in a myopathic process (bottom left) and neurogenic process (bottom right). Enlarged MFs represent MF hypertrophy, that may be seen in either process and may be associated with MF splitting. Specific disease processes within each pattern may vary (eg, not all myopathic processes exhibit MF hypertrophy). Also, the schematics are not intended to show specific changes in disease processes that do not directly influence the motor unit action potential waveform (eg, inflammatory cells). In the neurogenic pattern, shaded MFs represent those that would show fiber type grouping on histochemical staining. This technique does not reveal MFs innervated by a single MN (ie, an “enlarged” or reinnervated motor unit). Dark, angular MFs represent those that are still denervated and that have not yet undergone reinnervation. These would not contribute to the MUP. With permission, copyright P.E. Barkhaus, MD, 2001.
The MUP waveform may begin to show increased complexity (ie, increased phases, turns, or linked components), an early but nonspecific finding. This is reflected in the variability of MF diameter as in section B of the image below where small orphaned MFs are now joining a "family" of otherwise healthy MFs of normal diameter in a MU. This creates increased variation in theconduction velocities of the MFs. There is also increased dispersion of the endplate zones and the new terminal collateral axons to these reinnervated MFS have variable lengths and conduction times. All of these factors will contribute to increased temporal dispersion (complexity) in the MUP waveform.
Electromyographic (EMG) evaluation of the motor unit (MU): electrophysiologic biopsy. MU architecture in neurogenic process characterized by partial loss of MUs. “A” shows normal pattern with 2 MUPs (arrows denote MUP duration) that might be recorded by a concentric electrode (blue bar). In “B”, a surviving MU is reinnervating MFs from a denervated MU. Portions of the MU territory of the surviving MU may have normal distribution of the MFs if no reinnervation is occurring in that area. The MUP becomes complex with increased duration (note also the late component in “B” under the voltage marker). “C” is a more severe example of chronic ongoing MU loss with reinnervation by a surviving MU. Collateral reinnervation, as shown by MF type grouping on muscle biopsy, will be prominent. Shown are 2 MUPs that might be recorded by a concentric electrode (blue bar). These are enlarged in amplitude and duration (note difference in amplitude calibration compared with A: duration measurement at 100 mV sensitivity would be greater as shown in the second serrated MUP below, where duration is denoted by arrows). In “D” and “E”, schematic representations of “fractionation” are shown, in which previously reinnervated MFs (open circles) in an enlarged MU undergo denervation a second time. Courtesy of www.casaengineering.com.
Another early finding is instability (or "jiggle") [45] of the MUP, reflecting the reinnervation process as the terminal sprouts from new synapses on the orphaned MFs (see "B" and “C” of the first image below and “C” of the second image). Here, the successively discharging MUPs change in shape even with standard filter settings.
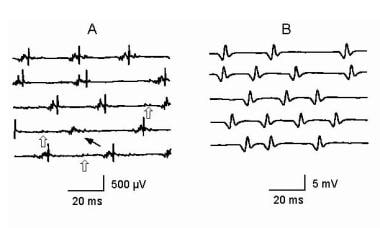
 Electromyographic (EMG) evaluation of the motor unit (MU): electrophysiologic biopsy. MUP stability assessment by using a concentric needle (CN) electrode. A, B, C, E, and F recordings are made with low-frequency filter increased from standard 2-500 Hz; D is made with low-frequency filter at 2 Hz; calibration settings are as indicated. Trigger (except in D) is set at the third horizontal division from left to ensure entire signal can be seen. "A" superimposed sweeps from a healthy MUP showing stability. “B” and “C” show 4 and 10 superimposed sweeps, respectively, from a chronic neurogenic process with instability. D shows 2 sample sweeps of the same MUP in early reinnervation without the trigger. They look superficially similar; however, the potential on the second sweep is obviously shorter in duration as a result of instability (ie, drop out or "block" of some of the spike components). “E” and “F” are 10 superimposed sweeps from a patient with myasthenia. “E” shows increased instability or jitter, particularly in the spike to the left. “F” shows increased instability with blocking. With permission, copyright P.E. Barkhaus, MD, 2001.
 Electromyographic (EMG) evaluation of the motor unit (MU): electrophysiologic biopsy. This schematic shows MU remodeling after complete MU loss (eg, complete nerve transection). “A” shows a healthy MU. In contrast, “B” shows early change in architecture characterized by variation in muscle fiber (MF) size as reinnervation proceeds with increased grouping of the MFs. The nascent motor unit action potential MUP showing complexity and instability is shown in “C.” Courtesy of www.casaengineering.com.
As these MFs mature in the reinnervation process, instability decreases such that it may require the use of high pass filtering to demonstrate this phenomenon (see image below). Instability or jiggle persists until the synapses fully mature (typically many weeks to months).
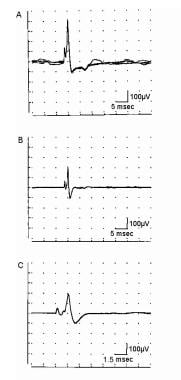 Electromyographic (EMG) evaluation of the motor unit (MU): electrophysiologic biopsy. Demonstration of the “blanket principle.”{ref79} Four trigger-delayed superimposed sweeps of a MUP (A) recorded with a concentric needle electrode from a patient with myopathy. Low-frequency filter is increased to 1000 Hz in B. Note that the amplitude is reduced and baseline "sharpened" with removal of the low-frequency components (i.e., MFs distant from the recording electrode tip). C, sweep speed is increased, shifting the smaller spike to the left. This recording is stable. Calibrations are as indicated. With permission, copyright P.E. Barkhaus, MD, 2001.
As the reinnervating MU acquires more MFs, MUP amplitude increases with a concomitant increase in area. This is particularly apparent in the main spike, indicating increase in focal rearrangement of the MFs in the MUT within 0.5 mm of the recording electrode tip. This is analogous to the MF type grouping seen on muscle biopsy. MUAP duration also increases.
These changes in the MUP waveform are specific to neurogenic processes. As reinnervation proceeds successfully, IA and SA decrease. [52] The recruitment and IP may remain decreased because MUs are not replaced and remain reduced; rather, the remaining MUs are enlarged (see section B of each image below). Hence, increase in spike amplitude occurs in IP. A recent study suggests that experimental partial peripheral motor nerve lesions may induce some changes in axon conduction properties of the surviving MNs. [53]
Electromyographic (EMG) evaluation of the motor unit (MU): electrophysiologic biopsy. Models to demonstrate increased recruitment frequency. A, Healthy muscle in which muscle fibers (MFs) from 6 MUs are observed close to the recording electrode. B, only 2 MUs have MFs close to the recording electrode surface; as this is a process of partial MU loss with subsequent reinnervation. C shows loss of MFs from MUs 2, 3, and 6 near the recording electrode, as may be observed in a myopathy. But MFs from only two MUs are actually close to the recording electrode surface (MUs 1 and 5) to give MUPs with sharp rise times. MUs 2, 4, and 6 are away from the recording surface and may be quite low in amplitude and appear as baseline noise, giving the erroneous impression of a reduced number of MUs. Courtesy of www.casaengineering.com.
Electromyographic (EMG) evaluation of the motor unit (MU): electrophysiologic biopsy. Reduced recruitment. Single, fast, firing MUs are recorded in a severely weak muscle in a patient with myopathy (A) and a patient with neuropathy (B). MUP in A is complex and unstable. Note the missing large-amplitude spike as indicated by the thin arrow on sweep 4. Careful examination of the other complex waveforms reveals subtle changes among them, further demonstrating their instability. Open arrows on sweeps 3-5 indicate low-amplitude potentials on the baseline that represent small MUPs with few remaining MFs. These are easily overlooked unless the sensitivity is increased giving the false impression of a reduced number of MUPs as may be seen in a neurogenic process (see B). In B the MUP has very high amplitude and is considered a “giant MUP.” Calibration is as indicated. Courtesy of www.casaengineering.com.
Several months to upward of a year after onset, reinnervation becomes complete in that it reaches its maximum. This depends on a number of variables but predominantly on the degree of the original MU loss. This is reflected secondarily in the size of the surviving MUs that have provided reinnervation to the orphaned MFs (see section C of the image below; note the calibration). Successful reinnervation is reflected by enlarged but stable MUAPs with minimal to no fibrillation potentials. [23]
Electromyographic (EMG) evaluation of the motor unit (MU): electrophysiologic biopsy. MU architecture in neurogenic process characterized by partial loss of MUs. “A” shows normal pattern with 2 MUPs (arrows denote MUP duration) that might be recorded by a concentric electrode (blue bar). In “B”, a surviving MU is reinnervating MFs from a denervated MU. Portions of the MU territory of the surviving MU may have normal distribution of the MFs if no reinnervation is occurring in that area. The MUP becomes complex with increased duration (note also the late component in “B” under the voltage marker). “C” is a more severe example of chronic ongoing MU loss with reinnervation by a surviving MU. Collateral reinnervation, as shown by MF type grouping on muscle biopsy, will be prominent. Shown are 2 MUPs that might be recorded by a concentric electrode (blue bar). These are enlarged in amplitude and duration (note difference in amplitude calibration compared with A: duration measurement at 100 mV sensitivity would be greater as shown in the second serrated MUP below, where duration is denoted by arrows). In “D” and “E”, schematic representations of “fractionation” are shown, in which previously reinnervated MFs (open circles) in an enlarged MU undergo denervation a second time. Courtesy of www.casaengineering.com.
Acute complete loss of MUs
Acute complete loss of MUs (ie, complete transection of a nerve) demonstrates the same changes in the temporal sequence of loss of the distal portions of the axons as they degenerate (as discussed in the Acute onset monophasic partial loss of MUs section directly above). The difference lies in the complete loss of clinical function despite a normal evoked CMAP in the early post-onset period as already discussed (ie, up to 7 days after onset). The timing of increases in IA and SA is also the same except that it is more prominent, reflecting the complete loss of MUs. Since all MUs are lost, no voluntary activation occurs, and only baseline activity is recorded on voluntary activation with the needle electrode. [50]
The major difference in this reinnervation process is the source of the reinnervating axons. In this situation, the key to recovery is successful regrowth of the axons from the proximal side of the lesion through the area of lesion, then distally along the path of the original axon. Many factors affect this, including the distance of the lesion to the muscle (regrowth of axons is approximately 1 mm/day) and how much the lesion has disrupted the original anatomic path for the axons to regrow to their orphaned MFs in the muscle.
Assuming successful regrowth, the axon sends sprouts to innervate the MFs in a manner analogous to that already described. In this setting, no "normally" sized MUs are present at the beginning, thus the reinnervation process forms MUs de novo (see image below). These MUs have abnormal architecture (i.e. distribution of the MFs within the MU territiory) from the beginning of their formation. As the number of successfully innervated MFs increases, the MUP in turn becomes proportionately more enlarged. The reinnervating MUP ultimately may become more enlarged than normal for that particular muscle. [54]
Electromyographic (EMG) evaluation of the motor unit (MU): electrophysiologic biopsy. This schematic shows MU remodeling after complete MU loss (eg, complete nerve transection). “A” shows a healthy MU. In contrast, “B” shows early change in architecture characterized by variation in muscle fiber (MF) size as reinnervation proceeds with increased grouping of the MFs. The nascent motor unit action potential MUP showing complexity and instability is shown in “C.” Courtesy of www.casaengineering.com.
These MUs initially are characterized as normal-to-reduced amplitude, highly complex, short-duration MUP waveforms. Because these MUPs are formed de novo from a completely denervated muscle, they sometimes are termed “nascent” MUPs (see “C” in the image above). Viewed in isolation when the details of the disease process are unknown, they may resemble superficially a MUP from a myopathic process. The exception is that they are highly unstable within the setting of markedly increased IA and SA. Note in “C” of the image above how the configuration of the spikes varies on successive occurrences of the reinnervating MUP. While the latter may be observed in myopathy (eg, inflammatory myopathy), MUP instability is not a prominent feature in myopathy.
Depending on the number of successful axons re-growing into the muscle, the MUs enlarge to variable degrees compared to those observed in partial lesions, as already described. In this setting, the topography of the MFs distribution within the newly formed MUT is quite different with respect to size of the original MUT. The reinnervated MFs cluster (ie, prominent MF type grouping) due to innervation from a single terminal axon to a greater degree than in lesions with partial axon loss (see “B” of the image above).
The changes in the MUP waveform in the early period reflect 1) the variability in size and dispersion of the endplates (ie, MUP complexity), 2) relatively fewer MFs in the initially formed MU (ie, reduced MUP area and duration), and 3) marked instability (ie, immature terminal sprouts and synapses). As additional MFs are reinnervated, MUP amplitude, area, and duration increase to reflect the addition of these MF APs to the MUP. When reinnervation reaches its maximum (which is not necessarily equivalent to a complete functional recovery), the MUPs become stable and SA becomes essentially normal.
Ongoing processes of denervation
Ongoing processes of denervation have ongoing concomitant reinnervation. These are typically diffuse processes such as polyneuropathies and motor neuron disorders but also may be focal, such as progressive radiculopathy secondary to spondylosis. The process is characterized by ongoing MU loss with compensatory reinnervation. In this pattern, dating the onset is difficult because typically no identifiable precipitating event can be determined.
In such chronic processes, denervation may be insidious such that compensatory reinnervation soon occurs concomitant with MU loss. Therefore, patients do not appreciate any early change in strength. This compensatory reinnervation process is so successful that as many as half of the MUs in a muscle may be lost before the reinnervation mechanism begins to fail and clinical weakness becomes manifest. [55, 56]
Meriggioli and Rowin reported a case of Kennedy disease that manifested as fatigue but normal clinical strength. [57] The expected chronic reinnervation changes were found on routine EMG, with the added presence of increased jitter on single fiber EMG. The authors believed that the latter finding of impaired neuromuscular transmission explained the patient's fatigue. Macro-EMG MUPs in such processes may show innervation ratios (ratio of the motor neuron to the number of MFs it innervates) approximately 20 times normal, implying an extraordinary ability to reinnervate and add MFs to its MU (see “C” of the image below). Sandberg and Stalberg reported a serial macro EMG study in old polio, showing a differential change in macro MUP size between the biceps brachii and the anterior tibial muscles. [58]
Electromyographic (EMG) evaluation of the motor unit (MU): electrophysiologic biopsy. MU architecture in neurogenic process characterized by partial loss of MUs. “A” shows normal pattern with 2 MUPs (arrows denote MUP duration) that might be recorded by a concentric electrode (blue bar). In “B”, a surviving MU is reinnervating MFs from a denervated MU. Portions of the MU territory of the surviving MU may have normal distribution of the MFs if no reinnervation is occurring in that area. The MUP becomes complex with increased duration (note also the late component in “B” under the voltage marker). “C” is a more severe example of chronic ongoing MU loss with reinnervation by a surviving MU. Collateral reinnervation, as shown by MF type grouping on muscle biopsy, will be prominent. Shown are 2 MUPs that might be recorded by a concentric electrode (blue bar). These are enlarged in amplitude and duration (note difference in amplitude calibration compared with A: duration measurement at 100 mV sensitivity would be greater as shown in the second serrated MUP below, where duration is denoted by arrows). In “D” and “E”, schematic representations of “fractionation” are shown, in which previously reinnervated MFs (open circles) in an enlarged MU undergo denervation a second time. Courtesy of www.casaengineering.com.
This compensatory mechanism eventually fails, and the reinnervated enlarged MU also begins to fail. This process is called fractionation of the MU (see “D” and “E” of the image above). This has been demonstrated on macro-EMG studies in which the recording is made from an area exceeding that of the MUT (ie, a larger recording area than that using an intermediate selective CN or MON electrode). Fractionation therefore is not appreciated on CN or MON electrode studies. It is the process whereby enlarged MUPs, as a result of reinnervation, become relatively "less enlarged" (i.e., reduced innervation ratio) due to loss of MFs within the reinnervated MU. [59] The other obvious mechanism could be the complete loss of reinnervated MUs.
Does this loss represent sporadic loss of MFs within the MUT or, more likely, selective loss of terminal branches (much like losing a limb on a tree to disease rather than a patchy loss of leaves)? Because the (muscle) fiber-density measurements (by SFEMG study) remain unchanged (analogous to the highly localized measure of the leaves), loss of limbs seems more likely. [59]
The electrophysiologic changes in the MUP have similarities to the reinnervation process already described but with some important distinguishing characteristics. On initial study, the MUPs already are enlarged to varying degrees (ie, MUP amplitude, area, and duration with variable complexity). A common clinical scenario is one of a patient asserting that onset of their weakness was recent, but the changes recorded in their MUPs clearly indicate significant chronicity (ie, months).
IA and SA may be increased, depending on the relative activity of the disease process. The presence of fibrillation potentials indicates duration of at least 21 days, whereas enlarged MUPs imply a chronicity of months. These alone do not indicate an active process. As already discussed, SA in the form of fibrillation potentials can occur in the setting of an acute lesion and take many months or longer to resolve. [52] The concomitant presence of MUP instability suggests a lesion is active. Therefore, electrophysiologic evidence exists for both denervation and reinnervation.
One caveat may be made regarding the presence of fibrillation potentials. In chronic processes, fibrillation potentials may appear absent. To truly ascertain this, the authors suggest increasing the high pass filter from the usual settings of 2–20 Hz to 500–1000 Hz and increasing the sensitivity setting to at least 50 microV/division. This manipulation in electromyograph settings reduces baseline noise and "distant" myogenic activity, allowing a greater focus on the myogenic activity immediately near the recording electrode tip. This makes sense in that denervated muscle fibers (seen on muscle biopsy as small dark-staining angulated fibers) would generate relatively small APs. At standard filter settings, these small fibrillation potentials can be easily obscured.
To summarize, nonspecific changes in MUP waveforms such as increased complexity and increased amplitude may be sensitive markers for abnormality but are nonspecific overall because these changes also may occur in myopathic processes. The specific changes in MUP waveform that characterize a chronic neurogenic process are increases in duration of MUPs with increases in amplitude and area. Mean amplitude that is more than twice the upper limit also is considered a specific abnormality for neuropathy. [46] Instability in such MUPs indicates ongoing reinnervation.
Recruitment is said to be decreased, that is, the number of high-amplitude spikes firing rapidly for effort is reduced. Such patterns may be observed in myopathy as described in the Myopathic disorders section above (see “C” of the first image below and “A” of the second image below).
Electromyographic (EMG) evaluation of the motor unit (MU): electrophysiologic biopsy. Models to demonstrate increased recruitment frequency. A, Healthy muscle in which muscle fibers (MFs) from 6 MUs are observed close to the recording electrode. B, only 2 MUs have MFs close to the recording electrode surface; as this is a process of partial MU loss with subsequent reinnervation. C shows loss of MFs from MUs 2, 3, and 6 near the recording electrode, as may be observed in a myopathy. But MFs from only two MUs are actually close to the recording electrode surface (MUs 1 and 5) to give MUPs with sharp rise times. MUs 2, 4, and 6 are away from the recording surface and may be quite low in amplitude and appear as baseline noise, giving the erroneous impression of a reduced number of MUs. Courtesy of www.casaengineering.com.
Electromyographic (EMG) evaluation of the motor unit (MU): electrophysiologic biopsy. Reduced recruitment. Single, fast, firing MUs are recorded in a severely weak muscle in a patient with myopathy (A) and a patient with neuropathy (B). MUP in A is complex and unstable. Note the missing large-amplitude spike as indicated by the thin arrow on sweep 4. Careful examination of the other complex waveforms reveals subtle changes among them, further demonstrating their instability. Open arrows on sweeps 3-5 indicate low-amplitude potentials on the baseline that represent small MUPs with few remaining MFs. These are easily overlooked unless the sensitivity is increased giving the false impression of a reduced number of MUPs as may be seen in a neurogenic process (see B). In B the MUP has very high amplitude and is considered a “giant MUP.” Calibration is as indicated. Courtesy of www.casaengineering.com.
To distinguish neurogenic processes, the spikes representing MUP waveforms are of increased amplitude and area (see “B” of image above). Ostensible dropout of MUs must be interpreted with caution in that the location of the recording electrode determines the number of MUs being recorded (see the first image “B” above). This emphasizes the importance of recording electrode position and the sampling of adequate sites in assessing MU loss.
The image below summarizes how the increasing presence of fibrillation potentials relates to stability of the MUPs. Under normal circumstances, MUPs are normal in size and no fibrillation potentials are seen. If enlarged stable MUPs are noted but without fibrillation potentials, then this suggests either completed reinnervation or, possibly, a very slowly progressive process. In the opposite situation (prominent fibrillation potentials and marked instability of typically mildly enlarged or enlarged MUPs), active denervation with ongoing reinnervation is present in a relatively rapidly progressive process (eg, focal, such as in a radiculopathy; or diffuse, such as in motor neuron disease).
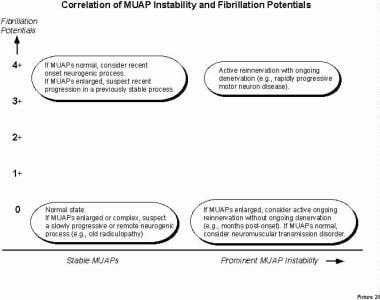 Electromyographic (EMG) evaluation of the motor unit (MU): electrophysiologic biopsy. Image shows the correlation of MU action potential (MUP) stability and fibrillation potentials. Note that the degree of MUP stability (number of unstable MUPs) and density of fibrillation potentials imply different explanations with respect to progressive versus stable neurogenic processes. Adapted from Stålberg. With permission, copyright P.E. Barkhaus, MD, 2001.
The presence of fibrillation potentials without MUP instability suggests recent onset of a neurogenic process or, if the MUPs are enlarged, recent progression in a previously stable/reinnervated process. The presence of unstable enlarged MUPs in the absence of fibrillation potentials suggests ongoing reinnervation without concomitant denervation. If the MUPs are relatively normal in size, then a disorder of neuromuscular transmission should be suspected. As stated before, these relationships can be interpreted properly only after consideration of other variables, such as MUP size, other electrophysiologic data, and, of course, clinical history and examination.
Disorders of Neuromuscular Transmission
Two important points must be considered in this category. The first is that these disorders usually are not picked up passively on basic electrodiagnostic testing; they must be suspected. Special techniques often may be required to detect them. The second point is that neuromuscular transmission disorders are not detected readily on routine needle electrode examination because as discussed, they typically do not change the architecture of the MU. Their pathology lies in the functional dynamics of the neuromuscular system (ie, MUP stability) rather than the morphology (ie, MUP waveform size or complexity). This further emphasizes the importance of the electrophysiologic biopsy as a comprehensive assessment of the MUP signal.
Occasionally, variations in MUP waveform at standard settings is so florid that suspicion of a disorder of neuromuscular transmission can be made very quickly. In mild to moderately severe disorders (eg, myasthenia gravis), the variability is not observed easily. Hence, the electrodiagnostic consultant must interact with the instrumentation to convert the intermediate level selectivity of the recording electrode (CN, MON) to a highly selective one (ie, increasing the low-frequency filter to 1000 Hz and increasing sweep speed to 0.5–1.5 ms per division).
By trigger delaying and superimposing successive sweeps, instability or intermittent blocking is observed readily in most instances, particularly when clinical weakness exists (see the first image below and “E” and “F” of the second image). Blocking is usually incomplete. If it is complete, it cannot be appreciated since no APs are recorded. The latter situation may occur in severe disorders of neuromuscular transmission. In such instances, the blocked MFs are analogous to the MF loss in a myopathy, resulting in similar electrophysiologic changes to the MUP. Again, the differentiating feature is that smaller complex MUPs in myopathy are stable overall, whereas those in disorders of neuromuscular transmission are unstable.
Electromyographic (EMG) evaluation of the motor unit (MU): electrophysiologic biopsy. Demonstration of the “blanket principle.”{ref79} Four trigger-delayed superimposed sweeps of a MUP (A) recorded with a concentric needle electrode from a patient with myopathy. Low-frequency filter is increased to 1000 Hz in B. Note that the amplitude is reduced and baseline "sharpened" with removal of the low-frequency components (i.e., MFs distant from the recording electrode tip). C, sweep speed is increased, shifting the smaller spike to the left. This recording is stable. Calibrations are as indicated. With permission, copyright P.E. Barkhaus, MD, 2001.
Electromyographic (EMG) evaluation of the motor unit (MU): electrophysiologic biopsy. MUP stability assessment by using a concentric needle (CN) electrode. A, B, C, E, and F recordings are made with low-frequency filter increased from standard 2-500 Hz; D is made with low-frequency filter at 2 Hz; calibration settings are as indicated. Trigger (except in D) is set at the third horizontal division from left to ensure entire signal can be seen. "A" superimposed sweeps from a healthy MUP showing stability. “B” and “C” show 4 and 10 superimposed sweeps, respectively, from a chronic neurogenic process with instability. D shows 2 sample sweeps of the same MUP in early reinnervation without the trigger. They look superficially similar; however, the potential on the second sweep is obviously shorter in duration as a result of instability (ie, drop out or "block" of some of the spike components). “E” and “F” are 10 superimposed sweeps from a patient with myasthenia. “E” shows increased instability or jitter, particularly in the spike to the left. “F” shows increased instability with blocking. With permission, copyright P.E. Barkhaus, MD, 2001.
This change in electrode selectivity is analogous to performing a semi-quantitative single fiber EMG (SFEMG) study. The complete details and differences between the two are beyond the scope of this discussion. A confirmatory electrophysiologic study for a disorder of neuromuscular transmission should rely on a more detailed quantitative study (eg, SFEMG). An SFEMG electrode is more selective than a CN or MON needle electrode, either of which may permit underestimation of jitter or instability. Because of growing requirements for disposable needle electrodes, recent literature has shown that CON or MON needle electrodes can be used in SFEMG to study jitter but not fiber density. [60, 61]
MUP instability ("jiggle") may be observed in both myopathic and neurogenic disorders. In the former, instability is uncommon. In neurogenic processes, instability is common while reinnervation is incomplete (see “B”–“D” of the image below). In that setting, MUP instability is associated with increases in IA and SA and enlarging MUPs. In some cases, increased instability may be a predominant finding. [57] Disorders of neuromuscular transmission usually exhibit normal MUP configuration. When the low-frequency filter is increased to assess stability, the waveform is not as spiky as compared to neurogenic and myopathic processes (see the image below; compare E and F with B–D). [62] Hence, it may take effort to manipulate the needle electrode to find pairs of spike to assess stability (ie, jiggle). When instability is actually quantitated, it is termed "jitter" and blocking.
Electromyographic (EMG) evaluation of the motor unit (MU): electrophysiologic biopsy. MUP stability assessment by using a concentric needle (CN) electrode. A, B, C, E, and F recordings are made with low-frequency filter increased from standard 2-500 Hz; D is made with low-frequency filter at 2 Hz; calibration settings are as indicated. Trigger (except in D) is set at the third horizontal division from left to ensure entire signal can be seen. "A" superimposed sweeps from a healthy MUP showing stability. “B” and “C” show 4 and 10 superimposed sweeps, respectively, from a chronic neurogenic process with instability. D shows 2 sample sweeps of the same MUP in early reinnervation without the trigger. They look superficially similar; however, the potential on the second sweep is obviously shorter in duration as a result of instability (ie, drop out or "block" of some of the spike components). “E” and “F” are 10 superimposed sweeps from a patient with myasthenia. “E” shows increased instability or jitter, particularly in the spike to the left. “F” shows increased instability with blocking. With permission, copyright P.E. Barkhaus, MD, 2001.
In some cases of myasthenia (particularly those that are severe, chronic, or untreated), the MUPs may appear small in amplitude, reduced in duration, or mildly complex. This reflects marked instability and prolonged block in neuromuscular transmission. Although the inference is that these MFs are denervated, fibrillation potentials are not reported commonly in myasthenia gravis, and when present, they are usually minimal in density. Therefore, the MF loss is more functional from blocking in transmission (ACh receptor loss outpaces ACh receptor regeneration), but the trophic influence of the axon terminal on the MF is presumably preserved.
Some mention should be made of the CMAP, since repetitive motor nerve stimulation is a mainstay in the diagnosis of these disorders. The CMAP is recorded with the least selective of all electrodes used, the surface electrode. [63, 64] Therefore, significant pathology must be present to indicate a positive finding (ie, significant change in amplitude or area of evoked CMAPs). Fluctuations in evoked CMAP amplitudes may occur in myopathic and neurogenic disorders. Waveform changes in the CMAP in smaller, distal muscles usually are easier to detect than the broader, longer duration CMAPs recorded from larger, proximal muscles.
What is the pathophysiology of the decremental CMAP response in a repetitive motor nerve stimulation study recorded with surface electrodes? This may be considered to be the large-scale manifestation of what is going on at the neuromuscular synapse: increased jitter, but primarily blocking of neuromuscular transmission (see E and F of the image below). This pattern of blocking is incomplete (or it cannot be appreciated) and is typically associated with large degrees of instability (ie, jitter).
Electromyographic (EMG) evaluation of the motor unit (MU): electrophysiologic biopsy. MUP stability assessment by using a concentric needle (CN) electrode. A, B, C, E, and F recordings are made with low-frequency filter increased from standard 2-500 Hz; D is made with low-frequency filter at 2 Hz; calibration settings are as indicated. Trigger (except in D) is set at the third horizontal division from left to ensure entire signal can be seen. "A" superimposed sweeps from a healthy MUP showing stability. “B” and “C” show 4 and 10 superimposed sweeps, respectively, from a chronic neurogenic process with instability. D shows 2 sample sweeps of the same MUP in early reinnervation without the trigger. They look superficially similar; however, the potential on the second sweep is obviously shorter in duration as a result of instability (ie, drop out or "block" of some of the spike components). “E” and “F” are 10 superimposed sweeps from a patient with myasthenia. “E” shows increased instability or jitter, particularly in the spike to the left. “F” shows increased instability with blocking. With permission, copyright P.E. Barkhaus, MD, 2001.
Instability is not the basis for the decrement of the CMAPs , but rather the actual blocking in neuromuscular transmission. If, hypothetically and simplistically, 40% of MFs are blocking (and of these, they are blocking 50% of the time), then a 20% decrement may be anticipated. If, in another, less severe, case, 20% of MFs exhibit blocking, but the blocking is less marked (eg, 10% of the time), then an approximately 2.0% decrement may be anticipated. Severe blocking in neuromuscular transmission may not be appreciated easily from surface-recorded CMAPs other than for reduced amplitude of response. If CMAP amplitudes are already reduced, then significant decrement may be difficult to appreciate. One may consider blocking in neuromuscular transmission as the clinical analogue of weakness and the instability to be the clinical analogue of fatigue.
Other disorders of neuromuscular transmission, such as Lambert-Eaton myasthenic syndrome, have special characteristics in the change of CMAP amplitude on repetitive nerve stimulation (ie, incremental responses in presynaptic disorders). Some neuromuscular disorders that do not affect the synapse also may exhibit changes on repetitive motor nerve stimulation (eg, periodic paralysis, motor neuron disease). If a neuromuscular disorder has its primary effect on the synapse, the MUAPs are typically normal in size and shape on routine analysis, but exhibit increased instability and blocking.
Other Miscellaneous Disorders
The clinical problem of delayed relaxation, suggesting myotonia, may occur in the setting of electrical silence. The muscle is contracted, yet no electrical activity appears on the screen. This suggests a nonelectrical neuromuscular disorder, which by inference would occur at the subsarcolemmal membrane or contractile mechanism level (eg, Brody syndrome [65, 66] ). The opposite and very dramatic example is the patient with pronounced spontaneous muscle movements that are quite obvious clinically but are electrically silent (eg, so-called rippling muscle disease). [67, 68, 69] In some myopathic processes, the MUPs actually may appear normal despite obvious clinical weakness. A common example is mild to moderately severe steroid myopathy in which the MFs are affected globally (eg, steroid myopathy with particular involvement of type II MFs). These represent instances in which the abnormality is outside of the MU's electrical function (ie, generation of its AP along the MF membrane).
In partial central disorders (ie, involvement of an upper motor neuron), clinical weakness is apparent. Input to the lower motor neurons is compromised, resulting in reduced activation and therefore incomplete IP. In this setting, the MUPs are normal in waveform. The MU discharges are discharging relatively slowly for level of effort, and the recruitment and derecruitment pattern is erratic. [3] Lukacs has reported changes in the EMG signal after ischemic stroke. [70] Changes in the EMG signal secondary to hysteria, somatoform disorders, and malingering are not associated with changes in MUP waveform, but recruitment patterns may be decreased spuriously, requiring careful assessment of effort. [71]
Equipment
Recording of the EMG signal
In most modern EMGs, the myogenic or EMG signal is amplified by using a high-quality digital differential amplifier, which is then displayed on a digital screen (usually a computer monitor). A differential amplifier has 3 inputs: active, reference, and ground. Current electromyographs are computer-based. Some are based in smaller notebook-type computers yet still have powerful analysis capability compared with that of older-generation analog electromyographs. The EMG signal is concurrently fed into an audio amplifier.
The basic (or routine) technique of recording the EMG signal uses intramuscular needle electrodes. The 2 basic types are monopolar (MON) and CN needle electrodes. The MON needle electrode is fabricated by grinding a Teflon-coated metal wire to a sharp conical tip (see image below). This is the recording surface of the MON electrode. Two additional surface electrodes serve as a reference and ground. [3, 4, 42]
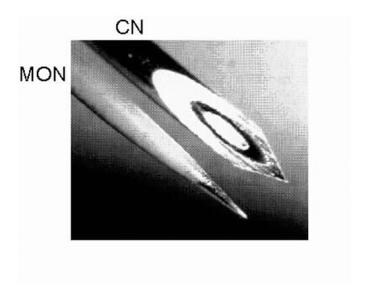 Electromyographic (EMG) evaluation of the motor unit (MU): electrophysiologic biopsy. Photomicrograph showing differences between the most commonly used needle electrodes: monopolar (MON) and concentric (CN). Courtesy of www.casaengineering.com.
The CN needle electrode is constructed from a fine metal wire inserted through a larger diameter metal cylinder, termed the cannula. The inner core is insulated from the cannula. The tip of this electrode is ground to a 15° angle to expose the inner wire's surface (150 X 580 µm) as an ellipse. The exposed core at the tip of the CN is the recording surface, with the cannula serving as the reference. (In some images in this article, a short solid line is shown as the recording surface; this is meant to represent the CN recording surface in side view.) A third surface electrode is used for the ground input to the amplifier, similar to the recording montage of the MON electrode. [3, 4, 42]
The size of the recording surface affects the recording characteristics of the needle electrode. Although the recording surfaces of these 2 electrodes differ (MON is 0.24 mm2, whereas CN is 0.07 mm2), they are similar compared to other needle electrodes used in QA (see first image below). The SFEMG electrode is the most selective, with a recording surface of 25 µm in diameter, and it can reliably differentiate the APs generated by single MFs (see second image below). [18] Because of health safety requirements to use disposable electrodes and the lack of a commercially available disposable SFEMG electrode, single-fiber EMG is generally not practiced today as it was originally designed. Fiber density measurements can only be made with a SFEMG electrode. Thus this measurement technique is not available at this time. Jitter measurement can be done with a MON, or preferably CN electrode. [61]
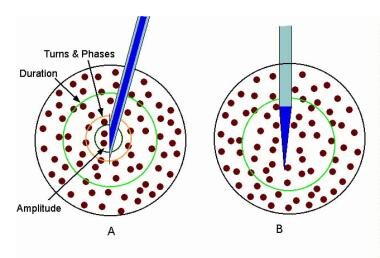 Electromyographic (EMG) evaluation of the motor unit (MU): electrophysiologic biopsy. Schematic showing the recording areas of the concentric (A) and monopolar (B) needle electrodes. In “A” the relative recording areas of the various features of the MUP (e.g., amplitude, area, etc.) have been modeled.{ref37} Courtesy of www.casaengineering.com.
Electromyographic (EMG) evaluation of the motor unit (MU): electrophysiologic biopsy. Schematic compares 3 recording needle electrodes relative to a MU territory in a muscle. The recording surface of the macro-EMG electrode (A) is its cannula, which can extend throughout the MU territory. The concentric needle electrode (B) records from the inner core at its tip. The muscle fibers (MFs) closest to its tip contribute to such features as the amplitude (small semicircle), but it records from a moderate portion of the MU territory (circle). These MFs contribute to the duration feature of the MUP. The single-fiber EMG electrode is the most selective (C), with a recording surface of 25 μm diameter on the side of the needle's shaft. The recording area has a 300 μm radius. Image courtesy of www.casaengineering.com.
Electromyographic (EMG) evaluation of the motor unit (MU): electrophysiologic biopsy. Schematic showing the recording areas of the concentric (A) and monopolar (B) needle electrodes. In “A” the relative recording areas of the various features of the MUP (e.g., amplitude, area, etc.) have been modeled.{ref37} Courtesy of www.casaengineering.com.
Electromyographic (EMG) evaluation of the motor unit (MU): electrophysiologic biopsy. Schematic compares 3 recording needle electrodes relative to a MU territory in a muscle. The recording surface of the macro-EMG electrode (A) is its cannula, which can extend throughout the MU territory. The concentric needle electrode (B) records from the inner core at its tip. The muscle fibers (MFs) closest to its tip contribute to such features as the amplitude (small semicircle), but it records from a moderate portion of the MU territory (circle). These MFs contribute to the duration feature of the MUP. The single-fiber EMG electrode is the most selective (C), with a recording surface of 25 μm diameter on the side of the needle's shaft. The recording area has a 300 μm radius. Image courtesy of www.casaengineering.com.
At the other end of the spectrum is the macro-EMG needle electrode, with a recording surface of 27 mm2, which makes it the least selective recording needle electrode. [72] It is used to record the electrical signal generated by the entire MU, a useful technique in looking at changes in MU size and in monitoring certain neuromuscular disorders. [47, 59] Collectively, these techniques provide complementary information to supplement the routine needle EMG. Again, because of current health safety regulations and required use of disposable electrodes and the unavailability of disposable macro-EMG electrodes, this technique is generally unavailable.
Although the MON and CN needle electrodes have similar recording surfaces and both have intermediate selectivity, they differ from each other in the waveforms they generate (eg, MON-recorded MUAPs tend to have higher amplitude values and more phases), which are related to the inherent physical properties of these needle electrodes. The electrodiagnostic consultant must be aware of these differences when using these electrodes. [73]
A further caveat involves use of the so-called facial (or pediatric) CN needle electrode. This electrode has a smaller recording surface than the standard CN (approximately 0.019 mm2, which may vary among manufacturers) and is shorter in length (25 mm), making it appealing for those trying to compromise between use of a CN and an MON needle electrode. Because of its smaller recording surface, there are expected differences in MUAP metrics. [73] Its length limits its use in sampling MUs in larger muscle or large individuals. It is usually the recording electrode of choice for jitter analysis.
Technique
EMG Signal
Generation of the EMG signal
Although this article emphasizes MUAPs, a brief review of the EMG signal may be helpful because signals are occasionally difficult to identify or because they may overlap each other. [43] Examination of the EMG signal can initially be divided into 2 parts on routine assessment: involuntary and voluntary activity (see Examination of the EMG signal below). See also Stålberg et al: Standards for quantification of EMG and neurography. [74]
Two further categories are found under involuntary activity: insertional activity (IA) and spontaneous activity (SA). IA results from mechanical irritation of the muscle as the needle electrode passes through the muscle and is velocity-dependent with respect to the speed of electrode movement in the muscle. This is a phenomenon called "plowing," during which the MFs are pushed aside (and sometimes actually injured) by the advancing needle electrode. [45] Hence, a slow-moving needle electrode generates little to no IA in healthy muscle, whereas fast movements, particularly "pogo-sticking" the electrode at various sites, tend to provoke a greater (but still normal) amount of IA. Use of the latter technique should be judicious from the standpoint of patient comfort and interpretation. [43, 75]
The 2 basic categories of IA are random (ie, bursts of spikes of varying shape and duration) and patterned (eg, complex repetitive discharges, myotonic discharges, trains of positive sharp waves, fibrillation potentials).
Examination of the EMG signal
-
Part I. Involuntary
Insertional activity (IA)
Random
Patterned
Spontaneous activity (SA)
Sub-MUP
MUP
-
Part II. Voluntary
Assessment of individually recruited MUAPs
Size
Shape
Stability
Assessment of activation pattern of MUAPs
Recruitment
Interference pattern (IP)
SA is described while the needle electrode is held in a fixed position in rested muscle. In healthy muscle, the signal baseline should be smooth and uninterrupted. In pathological conditions, patterned signals may appear similar to those that may have been recorded on IA assessment. Therefore, SA and IA are different in that they record APs generated spontaneously or by mechanical movement, respectively. Most of these signals are derived from single MFs or groups of MFs below the organizational level of the MU (ie, “sub-MUP”). [43]
Examples of SA may occur at the MUP organizational level, including fasciculation potentials that are the spontaneous random discharge of single MUs. Another example may be resting tremor, which represents periodic bursts of MUP discharges as a result of abnormal central output from upper MNs (eg, Parkinson disease). Identification and classification of IA and SA, particularly the rogue sub-MUP and MUP discharges, are essential in making a comprehensive assessment of the EMG signal.
The second portion in the generation and assessment of the EMG signal includes 2 parts: the assessment of individual MUPs and their patterns of activation. Individual MUP measurement is made by having the patient slowly and minimally activate the muscle. The EMG signal should contain only the discharges of a few MUPs with adequate baseline between discharges to enable full identification of their size and shape. The bias in the routine assessment of MUPs is that they represent the signals generated by low-threshold type I (S) MUs. At low levels of activation, a presumed MUP should be visualized 3 times before finally accepting it as a MUP because of frequent superimposition between discharging MUPs. These superimpositions may result in bizarre waveforms that may imply a pathological process in an otherwise normal study (see image below). [75, 43]
Electromyographic (EMG) evaluation of the motor unit (MU): electrophysiologic biopsy. Trigger delay in instrumentation (calibration for A-E is 100 mV vertical, 5 ms horizontal per division): A shows 4 sweeps on free run mode from a patient with myopathy. First potential occurs at almost the same position on each sweep, indicating a steady firing rate of approximately 10 Hz. Second, smaller potential is discharging slightly faster, shifting left, to where it superimposes on potential 1 on the fourth sweep. Use of trigger delay is essential to ascertain each potential by visualizing it at least 3 times. B is a free run recording of rastered sweeps from a patient with severe myopathy. At least 2 MU potentials (MUPs) are seen as denoted by the numbers. The enlarged potential on the first sweep (open arrow) is the result of superimposition of MUPs 1 and 2. By slight manipulation of the recording electrode, trigger delay on potential 1 (C) shows a highly complex MUP that is unstable even at standard settings (note change in pattern of peaks). Two late components (“B” and “C”) are readily appreciated that are separated by baseline. Although this is observed in B sweep 2, demonstrating recurrence of the waveform 3 times is essential before ascertaining it as a MUP. D shows trigger delay on MUP 1. The highly complex MUP 2 is observed shifting left on subsequent sweeps, superimposing on potential 1 on sweeps 3 and 4. Another sweep showing potential 1 is needed to verify it as a bona fide MUP. In E, the recording electrode is manipulated slightly, and the trigger-delay now is set on MUP 2, thus confirming it as a complex MUP. MUP 1 is observed to the right on the top sweep and partially on the bottom sweep. With permission, copyright P.E. Barkhaus, MD, 2001.
The final portion of the assessment of the MUPs lies in their activation pattern. The patient gradually increases the force of contraction, resulting in greater recruitment of MUs (see first image below) until full activation is achieved (ie, IP; see second image below). It is this second portion of the assessment (ie, of the MUPs) that is the focus of this article, including how the MUP reflects pathological changes in the MUs. Of course, comprehensive assessment is not possible without considering other information such as IA, SA, and other electrophysiologic studies such as motor and sensory nerve conductions.
Electromyographic (EMG) evaluation of the motor unit (MU): electrophysiologic biopsy. Normal recruitment in deltoid muscle (A) recording with a concentric needle electrode: The first MUP is discharging at 13-15 Hz when a second, smaller MUP is recruited on sweep 4, discharging at 4 Hz. Potential 1 appears polyphasic, but only 4 phases are present. B shows 2 sweeps recruitment in myopathy with mild voluntary effort. The baseline appears relatively full, and individual MUPs cannot be identified without reducing level of effort and use of trigger delay. Calibration settings are as indicated. With permission, copyright P.E. Barkhaus, MD, 2001.
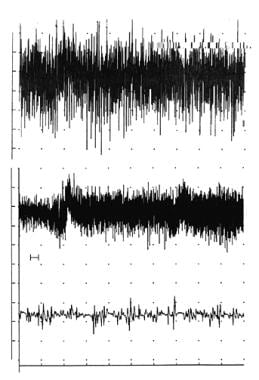 Interference pattern in biceps brachii. Top trace - Normal interference pattern at full effort (calibration - 500 microV/division vertical; 1 s/division horizontal). The middle trace is an interference pattern from a patient with severe sporadic inclusion body myositis (s-IBM) (calibration - 100 microV/division vertical; 1 s/division horizontal). This epoch of signal actually shows the patient going from minimal activation at the left (beginning of the sweep) to full effort on the far right. The "notch" just to the right of the second division mark shows a baseline shift from needle electrode movement. Overall, minimal amplitude change of "fullness" is seen going from minimal to full effort, and the amplitude of the signal epoch is less than half of what might be expected in normal muscle. The bottom trace is an expanded segment from the start of the middle trace (calibration - 100 microV/division vertical; 10 ms/division horizontal) (see "H" bar position between the middle and lower sweeps at the start of the middle trace). This shows a relatively full baseline of small-amplitude, complex motor unit action potentials (MUPs). Copyright, Paul E Barkhaus, MD, 2000, with permission.
Sampling of MU action potentials within a muscle and signal acquisition
Before starting a study, the electrodiagnostic consultant must decide on a strategy of which muscles to sample. In presumed diffuse processes, the pattern of muscles most likely affected is based on clinical examination (eg, distal in most polyneuropathies vs proximal in most myopathies). In focal processes (eg, radiculopathy, mononeuropathy), segmental anatomy or myotomes and their potential variations must be considered. [32, 75]
Acquisition of the EMG signal with attention to sampling of MUPs is based on knowledge of the MU and the MUT as already described. To acquire MUPs, the patient minimally activates the muscle after the needle electrode is inserted through the skin to the surface of the muscle. The needle electrode then is advanced in a linear track or "corridor" that is perpendicular to the long axis of the MFs. This ensures that the needle electrode passes through the maximum number of MFs proportionate to the length of the electrode that is in the muscle. [75]
Scanning EMG studies demonstrate that the MUP may vary considerably depending on where it is recorded in the MUT (see first image below). [17] This variability is even more marked in neuromuscular disorders in which the normal mosaic distribution of the MFs in the MU is altered due to changes in the MFs themselves or in their distribution within the MUT. Sampling different MUPs from different MUs may exhibit wide variation (see second image below). To ensure that a different MUP is sampled at a given site, advancing the needle electrode the distance of the diameter of the MUT (eg, 5–10 mm in the biceps brachii) may be necessary.
EMG evaluation of the MU: the electrophysiologic biopsy. Influence of needle electrode position in a healthy (A) and a myopathic (B) MU. Note in the normal MU (A) how the MUP durations change little during movement of the electrode through the MU territory. Note also in electrode position 2 in the normal MU that 2 MUPs are recorded with a slight change (rotation) of the electrode. This slight change in electrode position substantially affects the prominence of the turn seen on the negative slope of the second MUP from the top. In myopathy (B), movement of the needle electrode through the MU territory results in marked changes in the MUPs recorded from the same MU. With permission, copyright P.E. Barkhaus, MD, 2001.
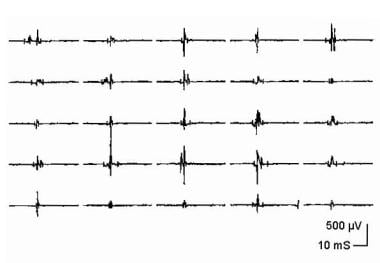 Electromyographic (EMG) evaluation of the motor unit (MU): electrophysiologic biopsy. Composite display of 25 MU action potentials (MUPs) from a patient with myopathy. Courtesy of www.casaengineering.com.
To enter a different corridor once the needle electrode is at full depth of penetration, it is withdrawn to the surface of the muscle. The electrode then is angled approximately 30–45° medial or lateral to the axis of the first perpendicular corridor, and the electrode again is advanced, sampling MUPs at each site. Three corridors are generally sufficient to sample a large limb muscle by using an electrode of suitable length (50 mm). With CN electrodes, the depth of sampling may affect amplitude because of the influence of the cannula on the signal. [76] If more corridors are needed in the same muscle, the electrode is moved to a new skin insertion site at a suitable distance medial or lateral to the previous site and the long axis of the MFs. [75]
Electrophysiologic Measurements of the MU
When the MN discharges, all of the MFs respond by generating an AP. Collectively, these single MF APs summate to form the MUP (see first image below). The AP from a single MF recorded extracellularly is triphasic in shape when recorded away from the endplate zone. The shape of the MUP varies considerably depending on from where it is recorded within the MUT, as demonstrated by "scanning" EMG studies (see second image below).
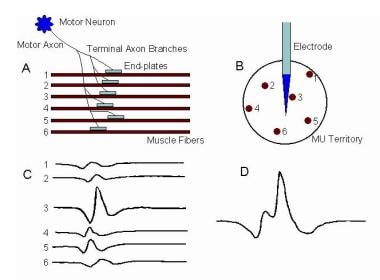 Electromyographic (EMG) evaluation of the motor unit (MU): electrophysiologic biopsy. Schematic showing the generation of the MU action potential (MUP). A, Motoneuron (MN) generates an action potential (AP) that in turn excites the muscle fibers (MFs) by means of neuromuscular transmission. Propagation of the APs down the MF membranes is bidirectional away from the endplates. B, Cross-section schematic emphasizes dispersion of the MFs of that MU in the MU territory and their relative position to the recording needle electrode. Recording electrode is positioned between the endplate zone and the end of the MFs (ie, away from the endplate zone). C, Single MF APs recorded by the needle electrode (1-6 corresponding to the numbered MFs shown in A and B). AP recorded from MF 3 is largest because of its proximity to the electrode. D, Summation of the individual MF APs as they form the MUP. Courtesy of www.casaengineering.com.
EMG evaluation of the MU: the electrophysiologic biopsy. Influence of needle electrode position in a healthy (A) and a myopathic (B) MU. Note in the normal MU (A) how the MUP durations change little during movement of the electrode through the MU territory. Note also in electrode position 2 in the normal MU that 2 MUPs are recorded with a slight change (rotation) of the electrode. This slight change in electrode position substantially affects the prominence of the turn seen on the negative slope of the second MUP from the top. In myopathy (B), movement of the needle electrode through the MU territory results in marked changes in the MUPs recorded from the same MU. With permission, copyright P.E. Barkhaus, MD, 2001.
Electromyographic (EMG) evaluation of the motor unit (MU): electrophysiologic biopsy. Schematic showing the generation of the MU action potential (MUP). A, Motoneuron (MN) generates an action potential (AP) that in turn excites the muscle fibers (MFs) by means of neuromuscular transmission. Propagation of the APs down the MF membranes is bidirectional away from the endplates. B, Cross-section schematic emphasizes dispersion of the MFs of that MU in the MU territory and their relative position to the recording needle electrode. Recording electrode is positioned between the endplate zone and the end of the MFs (ie, away from the endplate zone). C, Single MF APs recorded by the needle electrode (1-6 corresponding to the numbered MFs shown in A and B). AP recorded from MF 3 is largest because of its proximity to the electrode. D, Summation of the individual MF APs as they form the MUP. Courtesy of www.casaengineering.com.
EMG evaluation of the MU: the electrophysiologic biopsy. Influence of needle electrode position in a healthy (A) and a myopathic (B) MU. Note in the normal MU (A) how the MUP durations change little during movement of the electrode through the MU territory. Note also in electrode position 2 in the normal MU that 2 MUPs are recorded with a slight change (rotation) of the electrode. This slight change in electrode position substantially affects the prominence of the turn seen on the negative slope of the second MUP from the top. In myopathy (B), movement of the needle electrode through the MU territory results in marked changes in the MUPs recorded from the same MU. With permission, copyright P.E. Barkhaus, MD, 2001.
Although the typical MUP is also thought to be triphasic, it easily may be polyphasic or exhibit increased turns if phase interaction occurs between its component single MF APs (see sections C and D of the image below). [3, 42, 38, 77]
Electromyographic (EMG) evaluation of the motor unit (MU): electrophysiologic biopsy. Schematic showing the generation of the MU action potential (MUP). A, Motoneuron (MN) generates an action potential (AP) that in turn excites the muscle fibers (MFs) by means of neuromuscular transmission. Propagation of the APs down the MF membranes is bidirectional away from the endplates. B, Cross-section schematic emphasizes dispersion of the MFs of that MU in the MU territory and their relative position to the recording needle electrode. Recording electrode is positioned between the endplate zone and the end of the MFs (ie, away from the endplate zone). C, Single MF APs recorded by the needle electrode (1-6 corresponding to the numbered MFs shown in A and B). AP recorded from MF 3 is largest because of its proximity to the electrode. D, Summation of the individual MF APs as they form the MUP. Courtesy of www.casaengineering.com.
The radial distance to the nearest MF determines the amplitude, which is high if the radial distance is less than 500 µm but lower when recorded from a distance of 2000–2500 µm (see the image above; compare the positions of MFs 3 versus 1 and 6 in Image 12B and their corresponding APs in section C of the image above). When the MUP is recorded 2 cm or more from the endplate region, the electrodes are roughly equidistant from the endplates. Thus, the initial and terminal slow components are the same for all the MFs (see image above).
An exception is a MUP recorded from the endplate zone (see section A, position x, of the first image below). Because the recording is made at the endplate, no initial wave of positivity or depolarization occurs, as when the single MF APs are recorded away from the endplate. The MUP recorded here is typically biphasic with an initial negative-going phase (see section C of the image below). Endplate noise on the baseline may be also noted. [77]
Electromyographic (EMG) evaluation of the motor unit (MU): electrophysiologic biopsy. Schematic shows 2 MUs. A, Muscle fibers (MFs) are shown in side view. The endplate zone is central to the MFs (x). Distal region of the MFs on either side of their endplates is where their action potentials are propagated (y), ie, away from the endplates. B, Schematic representation of A on transverse view (ie, cross-section) demonstrates the overlap of MFs from different MUs and thus overlap in MU territories (of which only a portion is shown). C, MU potential (MUP) is recorded from the endplate region (see A, region x) and is characterized by its initial negative deflection. D, MUP shows the typical triphasic appearance with an initial positive deflection. This implies that it is recorded along the MFs away from the endplate zone (see A, region y) (sensitivity 100 mV per division vertical; sweep 5 ms per division). With permission, copyright P.E. Barkhaus, MD, 2001.
The positive-to-negative-going spike of the AP is not synchronous, signifying variable arrival times of the single MFs at the electrode (see image below). This variation in time is termed temporal dispersion and is the result of several physiologic characteristics of the MU.
Electromyographic (EMG) evaluation of the motor unit (MU): electrophysiologic biopsy. Schematic showing the generation of the MU action potential (MUP). A, Motoneuron (MN) generates an action potential (AP) that in turn excites the muscle fibers (MFs) by means of neuromuscular transmission. Propagation of the APs down the MF membranes is bidirectional away from the endplates. B, Cross-section schematic emphasizes dispersion of the MFs of that MU in the MU territory and their relative position to the recording needle electrode. Recording electrode is positioned between the endplate zone and the end of the MFs (ie, away from the endplate zone). C, Single MF APs recorded by the needle electrode (1-6 corresponding to the numbered MFs shown in A and B). AP recorded from MF 3 is largest because of its proximity to the electrode. D, Summation of the individual MF APs as they form the MUP. Courtesy of www.casaengineering.com.
Temporal dispersion is lower in muscles with shorter MF lengths. Inherent variation exists in neuromuscular transmission at the endplates. Hence, the normal biologic system always has some variability, and the formal quantification of this is termed jitter in SFEMG (subjectively "jiggle"). This is approximated in routine EMG by assessing the stability of the MUPs (or the instability when it is increased) (see images below). This is best appreciated when the high pass filter is increased from 5–10 Hz standard settings to 500 or 1000 Hz.
Electromyographic (EMG) evaluation of the motor unit (MU): electrophysiologic biopsy. Demonstration of the “blanket principle.”{ref79} Four trigger-delayed superimposed sweeps of a MUP (A) recorded with a concentric needle electrode from a patient with myopathy. Low-frequency filter is increased to 1000 Hz in B. Note that the amplitude is reduced and baseline "sharpened" with removal of the low-frequency components (i.e., MFs distant from the recording electrode tip). C, sweep speed is increased, shifting the smaller spike to the left. This recording is stable. Calibrations are as indicated. With permission, copyright P.E. Barkhaus, MD, 2001.
Electromyographic (EMG) evaluation of the motor unit (MU): electrophysiologic biopsy. MUP stability assessment by using a concentric needle (CN) electrode. A, B, C, E, and F recordings are made with low-frequency filter increased from standard 2-500 Hz; D is made with low-frequency filter at 2 Hz; calibration settings are as indicated. Trigger (except in D) is set at the third horizontal division from left to ensure entire signal can be seen. "A" superimposed sweeps from a healthy MUP showing stability. “B” and “C” show 4 and 10 superimposed sweeps, respectively, from a chronic neurogenic process with instability. D shows 2 sample sweeps of the same MUP in early reinnervation without the trigger. They look superficially similar; however, the potential on the second sweep is obviously shorter in duration as a result of instability (ie, drop out or "block" of some of the spike components). “E” and “F” are 10 superimposed sweeps from a patient with myasthenia. “E” shows increased instability or jitter, particularly in the spike to the left. “F” shows increased instability with blocking. With permission, copyright P.E. Barkhaus, MD, 2001.
The MUP from an MU in a larger limb muscle is actually a theoretical ideal. Why? As stated already, the needle electrodes used to record the MUAPs have limitations and distort the "ideal" MUP waveform signal. The CN electrode MUP recorded in the biceps brachii has a recording area of approximately 2500 µm (this defines the MUP duration feature as discussed below). Thus, it does not record equally the contributions of all the MFs within the MUT (estimated to be 5- to 10-mm in diameter). Furthermore, the size of the individual MF AP it records is heavily dependent on the distance of the MF from the recording electrode. In anatomic cross-section of healthy muscle, there is an appearance of homogeneity in the size and shape of the MFs. But in generating the MUP as recorded by the needle electrode, variation found in the APs generated by these single MFs based on their distance from the recording electrode. [3, 42, 38, 77]
Most of this discussion covers the CN because less is known about the effects of the physical characteristics of the MON electrode on the MUP. [78] The formidable-sounding macro-EMG needle electrode is the least selective needle electrode (see image below). Although it has the largest recording area, it records waveforms that are actually much lower in amplitude than the routine CN MUP. [72, 29] This brings us back to the prefatory quote of this article. The measuring device (ie, needle electrode) is of the user's construction, and the MUP as recorded is not nature itself but a signal that the operator extracts, and to some degree distorts, by their method of questioning (ie, the CON or MON EMG signal, etc.).
Electromyographic (EMG) evaluation of the motor unit (MU): electrophysiologic biopsy. Schematic compares 3 recording needle electrodes relative to a MU territory in a muscle. The recording surface of the macro-EMG electrode (A) is its cannula, which can extend throughout the MU territory. The concentric needle electrode (B) records from the inner core at its tip. The muscle fibers (MFs) closest to its tip contribute to such features as the amplitude (small semicircle), but it records from a moderate portion of the MU territory (circle). These MFs contribute to the duration feature of the MUP. The single-fiber EMG electrode is the most selective (C), with a recording surface of 25 μm diameter on the side of the needle's shaft. The recording area has a 300 μm radius. Image courtesy of www.casaengineering.com.
Rise time is not a feature of the MUP but rather a criterion for MUP quality when accepting MUPs for measurement. Rise time is defined as the time interval between the maximum initial positive peak to the maximum negative peak. This is uncomplicated when one deals with simple triphasic waves (see image below, time interval between the first 2 arrows denoting turns). The traditional rise time value should be less than 0.5 milliseconds. [79, 77]
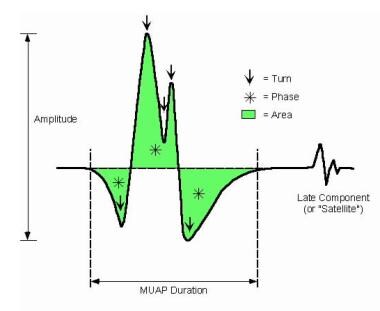 Electromyographic (EMG) evaluation of the motor unit (MU): electrophysiologic biopsy. Schematic showing the features of the MUP. With permission, copyright P.E. Barkhaus, MD, 2001.
However, when dealing with pathologic conditions, the traditional rise time value cannot be used since very few MUPs affected by chronic reinnervation would be accepted. Highly complex waveforms (see sections B and D of the image below) may have 2 or more turns or phases between the maximum initial positive peak and maximum negative peak, making the measurement points problematic. Some automated algorithms do not select MUPs on rise time but rather on slope. [77] Even otherwise high-quality simple triphasic MUPs may have rise times slightly greater than 0.5 millisecond. Therefore, the authors have proposed relaxing this criterion. [79]
Electromyographic (EMG) evaluation of the motor unit (MU): electrophysiologic biopsy. MUP stability assessment by using a concentric needle (CN) electrode. A, B, C, E, and F recordings are made with low-frequency filter increased from standard 2-500 Hz; D is made with low-frequency filter at 2 Hz; calibration settings are as indicated. Trigger (except in D) is set at the third horizontal division from left to ensure entire signal can be seen. "A" superimposed sweeps from a healthy MUP showing stability. “B” and “C” show 4 and 10 superimposed sweeps, respectively, from a chronic neurogenic process with instability. D shows 2 sample sweeps of the same MUP in early reinnervation without the trigger. They look superficially similar; however, the potential on the second sweep is obviously shorter in duration as a result of instability (ie, drop out or "block" of some of the spike components). “E” and “F” are 10 superimposed sweeps from a patient with myasthenia. “E” shows increased instability or jitter, particularly in the spike to the left. “F” shows increased instability with blocking. With permission, copyright P.E. Barkhaus, MD, 2001.
Table 3. MUP Features [77, 80] (see also first image below Table 3) (Open Table in a new window)
Feature |
Definition or Comment |
Amplitude |
This is measured as the total peak-to-peak amplitude. |
Area |
This is measured as the area under the rectified waveform within a defined duration. |
Area-to-amplitude ratio |
This measures the thickness of the main spike. [39] |
Duration |
Duration is defined as the time interval between the signal's deviation from the baseline and its return to the baseline. In quantitative EMG, polyphasic MUPs are not included in duration measurements. [81] |
Phase |
This is a deviation of the signal from, until its return to, the baseline. A MUP having more than 4 phases is considered polyphasic. |
Turn |
This is a change in polarity (must be defined in terms of µV; usually a turn of 50 µV is considered clinically significant). A MUP having more than 5 turns is abnormal. When excess turns are present, the MUP is termed serrated. Slight movement may easily change a turn onto a phase, or vice versa. |
Late component |
This is a waveform that is time locked to the main MUP but separated from it by an isoelectric interval. It sometimes is referred to as a satellite or linked potential. (The duration measure does not include such potentials.) |
Complexity |
A MUP is called complex if it has more than 4 phases, more than 5 turns, or a satellite potential. |
Variability |
This refers to changes in shape of the MUP on consecutive discharges at standard filter settings. By changing the instrument settings to those used in SFEMG, increases in jitter or instability of the CN MUP may be best assessed by superimposing successive sweeps (see second and third image below this table). Stålberg et al have quantified the vertical instability of the MUP, terming it jiggle. |
Electromyographic (EMG) evaluation of the motor unit (MU): electrophysiologic biopsy. Schematic showing the features of the MUP. With permission, copyright P.E. Barkhaus, MD, 2001.
Data from simulation studies indicate that the CN MUP peak-to-peak amplitude is determined by the MFs within 0.5 mm of the recording tip as shown in the image below (particularly on the distance to and diameter of the closest MF). Thus, the most obvious feature of the MUP is recorded from few MFs (typically 2–3) and from a disproportionately small area of the MUT. Not surprisingly, minor movement of the electrode's recording tip may significantly alter MUP amplitude. [38, 39]
Electromyographic (EMG) evaluation of the motor unit (MU): electrophysiologic biopsy. Schematic showing the recording areas of the concentric (A) and monopolar (B) needle electrodes. In “A” the relative recording areas of the various features of the MUP (e.g., amplitude, area, etc.) have been modeled.{ref37} Courtesy of www.casaengineering.com.
The main spike component of the MUP depends on the temporal dispersion of the MF APs within 1 mm of the recording electrode tip. This is estimated to comprise 5–10 MFs. The number of phases and turns and main spike duration define and characterize the main spike. As temporal dispersion increases so also do the values of these features. [38, 82]
Area is determined by the MFs of an MU within 2.0 mm of the electrode tip and duration by those MFs within 2.5 mm of the electrode tip (see image above). Since the MUT may measure upward of 10 mm, only a portion of the total MFs of the MU are being reflected in what is termed the CN MUP. This assumption also does not take into consideration that the recording surface of the needle electrode actually may be central or eccentric in its location within the MUT. The Polish American philosopher and semanticist Alfred Korzybski once quipped, "The map is not the territory." To make a bit of a pun for emphasis, one might say, "The MUP is not the (MU) territory." The MON electrode has a recording area similar to that of the CN (see image above). MUP duration values are similar for both electrodes. [38]
The CN MUP duration metric is derived from the single MF APs within 2.5 mm (or 2500 μm) of the electrode's recording tip. It is defined as the initial deviation from the baseline to the terminal portion where the signal returns to the baseline. While MUP amplitude varies greatly due to position of the electrode within the MUT, duration is a fairly robust metric that changes little. It is quite useful in distinguishing the long-duration MUPs seen in chronic neurogenic processes from the simple (ie, nonpolyphasic), short-duration MUPs typically seen in myopathic disorders. Unfortunately, measuring MUP duration is difficult, either manually or using automated methods. Recently, some authors [83, 84] have advocated different approaches to duration analysis; however, in routine practice, the traditional approach has remained the standard.
In healthy muscle, each MN discharge results in generation of an AP in all of the MFs of its MU. If, on repeated discharges, sporadic increased variation or failure in AP generation occurs in 1 or more muscle MFs, the waveform varies in shape from 1 discharge to the next (jiggle). This variability is analogous to the increased jitter and blocking quantified in SFEMG (see image below). This may be subtle or unappreciated on standard filter and sweep speed settings (see image below, section D). [2, 42, 77, 80]
Electromyographic (EMG) evaluation of the motor unit (MU): electrophysiologic biopsy. MUP stability assessment by using a concentric needle (CN) electrode. A, B, C, E, and F recordings are made with low-frequency filter increased from standard 2-500 Hz; D is made with low-frequency filter at 2 Hz; calibration settings are as indicated. Trigger (except in D) is set at the third horizontal division from left to ensure entire signal can be seen. "A" superimposed sweeps from a healthy MUP showing stability. “B” and “C” show 4 and 10 superimposed sweeps, respectively, from a chronic neurogenic process with instability. D shows 2 sample sweeps of the same MUP in early reinnervation without the trigger. They look superficially similar; however, the potential on the second sweep is obviously shorter in duration as a result of instability (ie, drop out or "block" of some of the spike components). “E” and “F” are 10 superimposed sweeps from a patient with myasthenia. “E” shows increased instability or jitter, particularly in the spike to the left. “F” shows increased instability with blocking. With permission, copyright P.E. Barkhaus, MD, 2001.
By using the blanket principle [51] (ie, increasing the low-frequency filter from 5–10 Hz to 500–1000 Hz and increasing the sweep speed to 0.5–2 ms per division), instability may be observed easily, as well as any increase in spikiness of the main spike component. The latter suggests subtle changes in the microarchitecture of the MU in the form of abnormal increase or dispersion of the MFs closest to the recording tip of the CN or MON electrode (see Remodeling of the MU in neuromuscular disorders below and the Indications section above).
Remodeling of the MU in neuromuscular disorders
The MU may remodel in neuromuscular disorders in 2 basic ways. The first relates to intrinsic changes to the MFs. The second is the way in which they are distributed, or rather redistributed, within the MUT. Other morphologic change may occur but does not have direct electrophysiologic implications on the MUP per se (eg, accumulation of storage products, presence of inflammatory cells).
-
Alterations in structure of MFs (ie, changes that may alter MF membrane function) (see figure below)
MF atrophy
MF (longitudinal) splitting
MF hypertrophy
Segmental necrosis of MF (ie, segment isolated from endplate)
-
Alterations in spatial arrangement of MFs within the MU
Loss of MFs
Collateral reinnervation of MFs (MF type grouping)
Regeneration of MFs from satellite cells
Electromyographic (EMG) evaluation of the motor unit (MU): electrophysiologic biopsy. Schematic of alterations in single muscle fibers (MFs) that contribute to changes in their action potentials (APs). A, healthy MF. B, Atrophy of the MF that results in a smaller AP. C, MF with segmental necrosis. In this instance the terminal axon branch (ie, innervated end to the right) has sent a collateral axon branch to the orphaned end (left) to reinnervate it. A terminal axon branch from an adjacent nonaffected MF also could have provided the source for the reinnervating collateral branch. D, Innervation of a denervated MF (2) by means of a collateral branch from an unaffected MF from another motor unit (1). E similar to D, shows the innervation of a regenerated MF from satellite cells via a collateral axonal branch from an adjacent MF. F, the MF is split distal to the endplate. Although a single arrow shows the AP propagating to the right, the AP propagating left into the split goes down each branch. An electrode recording from the split end would detect 2 APs with no jitter since they share a common end plate. Such splits may occur in hypertrophied MFs. With permission, copyright P.E. Barkhaus, MD, 2001.
Table 4 below shows that similar electrophysiologic findings may be encountered in both myopathic and neurogenic disease processes. An example is MUP amplitude, which may be increased in both myopathic and neurogenic processes. However, the key to proper interpretation is to look at all of the MUP features collectively to make the correct assessment. Although MUP amplitude may be increased in myopathic processes, it is rarely accompanied by any commensurate increase in area and certainly not in duration of simple (ie, noncomplex) MUPs.
Table 4. Pathologic Correlates of MU Action Potential Features (Open Table in a new window)
|
Pathologic Correlates |
|
MU Action Potential Abnormality |
Myopathic Processes |
Neurogenic Processes |
Increased Amplitude |
|
|
Decreased Amplitude |
|
|
Increased Duration |
|
|
Decreased Duration |
|
|
Polyphasia |
|
|
MU instability |
|
|
Table 4 above gives the electrophysiologic correlates relating to these pathologic changes in morphologic restructuring. Note that no single MUP feature is pathognomonic for a particular disease process. This implies overlap in both morphologic (eg, MF hypertrophy) and physiologic (eg, instability) features in both myopathic and neurogenic processes. Ultimately, the consideration of all MUP features (in addition to other electrodiagnostic findings such as the IA, SA, nerve conductions, etc.), offers optimal interpretation as to the actual pathologic process. [85]
Quantitative Analysis
Reviewing the mathematical aspects of QA is beyond the scope of this article. In general, a sampling of 20 MUPs is considered adequate. [86] No matter which QA technique is used, the standard protocol for that technique must be followed carefully to ensure accurate measurement. For instance, MUP duration typically is measured at a sensitivity setting of 100–200 µV per division. As recommended by Buchthal, polyphasic MUPs should not be included in MUP duration measurements to increase diagnostic sensitivity in myopathy. [81] MUPs must be measured at the same instrumentation settings as the reference data. [3, 42]
If a laboratory uses published reference data, the electrodiagnostic consultant must confirm these by comparing their laboratory’s data before using them. Use of the term reference data is deliberate in lieu of “normal.” What is normal? In collecting reference data in asymptomatic subjects, finding "abnormality" that is not clinically significant is always possible. Collective reference data involve the decision as to whether a subject should be included. Such a decision may be purely subjective. In assuming a gaussian distribution of values, the range within ±2 standard deviations should include 95% of tested subjects. Based on this, the chance always exists that a healthy subject may have an "abnormal" measurement. Mean values of MUP features such as amplitude and duration traditionally have been used in QA, along with percent polyphasic MUPs. [77, 80]
In routine EMG or subjective analysis, the strategy is different. The electrodiagnostic consultant looks for MUPs with features that would not be observed in normal muscle (eg, increased amplitude, long duration, increased number of phases). Stålberg et al have designated these MUPs as "outliers." [87] They defined upper and lower limit values for MUP features such as amplitude. A muscle may have no more than 10% outlier recordings. Assuming a typical study sample of 20 MUPs, the study becomes abnormal when the third outlier is encountered. At this point, the testing of that particular muscle has reached diagnostic significance, and the study can be extended to another muscle or concluded. This approach allows a greater economy of time, yet still requires the examiner to quantify the MUP signal.
A further point is that the patterns of abnormality should be consistent. In other words, the duration values in a muscle should not be abnormal by being both below and above the reference ranges. This occasionally happens, often resulting in the unsuitable terms, mixed findings or neuromyopathy. Careful scrutiny of all data generally reveals a predominant trend in abnormality in key MUP features. A special caveat extends to the pooling of EMG data in patients (ie, both distal and proximal muscle). Thus, in neuromuscular disorders, look for a pattern or gestalt to help arrive at an interpretation or diagnostic impression. The images below show composites of different MUPs recorded from the biceps brachii in a myopathic process.
Electromyographic (EMG) evaluation of the motor unit (MU): electrophysiologic biopsy. Composite display of 25 MU action potentials (MUPs) from a patient with myopathy. Courtesy of www.casaengineering.com.
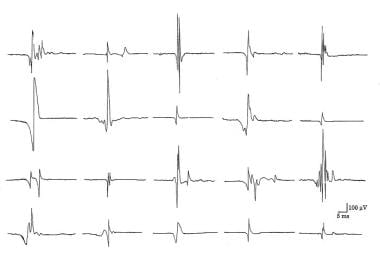 Composite of 20 motor unit action potentials (MUAPs) recorded with a concentric needle electrode from the biceps brachii of a patient with s-IBM. Note the wide range in size and complexity in the MUAPs. Copyright, Paul E Barkhaus, MD, 2000, with permission.
Note the wide range in MUP features (see Electrophysiologic measurements of the motor unit in the Technique section above), particularly amplitude.
Methods in QA
To perform QA, a standardized methodology or protocol is necessary. The main methodologies in QA are described in Table 5 below. For a more extensive review, the reader is referred to Nandedkar and Barkhaus. [3, 42] If an electrodiagnostic consultant is using commercially available software for analysis, they are obliged to understand the algorithm in how it makes measurements. In CN electrode analysis, the authors' protocol excludes polyphasic MUPs from duration measurement, and they do not accept CN-recorded MUPs less than 50 µV in amplitude for analysis.
Table 5. QA Methods in EMG [77, 80] (Open Table in a new window)
Method |
Description or Comment |
Manual |
Pioneered by Buchthal [1] Requires low activation of muscle Analysis essentially limited to MUP amplitude, duration, and phases Easily performed with most equipment but time-consuming |
Trigger delay |
Requires some modification to equipment: amplitude trigger, delay line, and averager [46] Measurements biased toward higher amplitude MUPS, and usually only 1 MUP can be collected per site Requires experience and practice in acquisition Analysis of MUP features may be basic as above, or software may allow additional analysis of measurements (eg, area) Time-consuming |
Multi-MU analysis [88] |
Acquires 1–6 MUPs per site at minimal activation Therefore no bias toward larger amplitude MUPs Uses decomposition and averaging technique Acquisition and analysis very rapid Requires review and editing of data to ensure quality Good reproducibility |
Decomposition |
Allows acquisition at higher levels of activation with subsequent breakdown of signals into their component MUPs Requires editing and validation of MUPs by operator [89] |
Although trigger delay is a QA technique, its intermittent use in routine EMG (ie, interacting with instrumentation) to scrutinize waveforms may be essential during a study (see image below). Trigger delay also may be used to examine other waveforms such as iterative discharges (eg, myotonic discharges, complex repetitive discharges) in performing a study. Moreover, this instrumentation adjustment is essential to study MUP stability. [3, 42, 90]
Electromyographic (EMG) evaluation of the motor unit (MU): electrophysiologic biopsy. Trigger delay in instrumentation (calibration for A-E is 100 mV vertical, 5 ms horizontal per division): A shows 4 sweeps on free run mode from a patient with myopathy. First potential occurs at almost the same position on each sweep, indicating a steady firing rate of approximately 10 Hz. Second, smaller potential is discharging slightly faster, shifting left, to where it superimposes on potential 1 on the fourth sweep. Use of trigger delay is essential to ascertain each potential by visualizing it at least 3 times. B is a free run recording of rastered sweeps from a patient with severe myopathy. At least 2 MU potentials (MUPs) are seen as denoted by the numbers. The enlarged potential on the first sweep (open arrow) is the result of superimposition of MUPs 1 and 2. By slight manipulation of the recording electrode, trigger delay on potential 1 (C) shows a highly complex MUP that is unstable even at standard settings (note change in pattern of peaks). Two late components (“B” and “C”) are readily appreciated that are separated by baseline. Although this is observed in B sweep 2, demonstrating recurrence of the waveform 3 times is essential before ascertaining it as a MUP. D shows trigger delay on MUP 1. The highly complex MUP 2 is observed shifting left on subsequent sweeps, superimposing on potential 1 on sweeps 3 and 4. Another sweep showing potential 1 is needed to verify it as a bona fide MUP. In E, the recording electrode is manipulated slightly, and the trigger-delay now is set on MUP 2, thus confirming it as a complex MUP. MUP 1 is observed to the right on the top sweep and partially on the bottom sweep. With permission, copyright P.E. Barkhaus, MD, 2001.
The blanket principle (or "poor-person's" SFEMG) is as follows: Payan [51] used the example of a blanket covering a statue to describe how an electrode of intermediate selectivity such as the CN or MON electrode could be changed to one of higher selectivity by altering the instrumentation. To use a different example, imagine standing in a precisely fixed position within a forest and wishing to take a picture of a tree that is directly before you. Acquisition is made with a single lens reflex camera that has a 55 mm (intermediate size) lens. The photographer would like to refocus to appreciate closer details on the tree but cannot change position. Therefore, stopping and breaking the fixed focus with the camera to change to a separate, close-up lens is not possible.
Modern photography has provided the zoom lens. In an analogous manner, modern EMGs have also provided better instrumentation to "zoom in" without breaking needle electrode position (ie, losing the waveform of interest). This is achieved by increasing the low-frequency (or high pass) filter from the 2–20Hz standard setting for routine MUP acquisition to 500–1000 Hz. This removes surrounding low-frequency components of the MUP signal, leaving only those APs of MFs very close to the recording surface of the needle electrode.
Increasing the low-frequency filter reduces the electrode's recording territory by removing generally the contribution of the MFs between those contributing to turns and phases and those contributing to the duration measure at standard filter settings (see section A of the first image below). In other words, increasing the low-frequency filter reduces the electrode's recording territory by attenuating the contribution of the MFs beyond those contributing to turns and phases at filter standard settings; see section A of the second image below). Therefore, the "blanket" (ie, low-frequency components of the signal) is removed, and the inherent detail can be appreciated. [51]
In the case of the MUP, most of the microarchitecture of the MU can be observed immediately near the recording surface of the electrode to appreciate its "spikiness" (not the same as fiber-density measure in SFEMG) [62] and stability (analogous to jitter on SFEMG). [3, 42] Despite change in filter settings and other changes in instrumentation, a CN or MON electrode cannot substitute completely for the highly selective SFEMG electrode. The spikes or APs observed may represent single MFs or more than 1 MF. By increasing the sweep speed (0.5–1.5 ms per division), stability of the MU may be appreciated readily in an objective manner by superimposing successive sweeps of the signal. Therefore, in addition to making quantitative assessments of the MUP's basic metrics at standard settings, the electrodiagnostic consultant is interacting actively with the EMG to extract even more information (see images below).
Electromyographic (EMG) evaluation of the motor unit (MU): electrophysiologic biopsy. Demonstration of the “blanket principle.”{ref79} Four trigger-delayed superimposed sweeps of a MUP (A) recorded with a concentric needle electrode from a patient with myopathy. Low-frequency filter is increased to 1000 Hz in B. Note that the amplitude is reduced and baseline "sharpened" with removal of the low-frequency components (i.e., MFs distant from the recording electrode tip). C, sweep speed is increased, shifting the smaller spike to the left. This recording is stable. Calibrations are as indicated. With permission, copyright P.E. Barkhaus, MD, 2001.
With practice, training one's eyes to use the graticule markings on the monitor to make objective measures of the signals is a significant step up from making subjective, visual impressions. Therefore, a qualitative description such as "large amplitude" becomes quantitative (eg, >2 mV in amplitude). This is termed objective EMG. By interacting with the instrument, more data are extracted in a time-efficient manner. Taken together, this approach is termed objective-interactive EMG. The authors feel that this yields a more thoughtful interpretation of the EMG signal. Changes in the MUP waveforms allow inferences to be made with respect to the integrity of the MFs and their MNs. The authors consider this to be an "electrophysiologic biopsy" of the MUs within a muscle (see Indications above), somewhat analogous to the traditional morphologic muscle biopsy.
In summary, QA requires a discipline in acquisition and recording that may be time-consuming. Because it is not needed in the majority of studies, it may be considered superfluous by many electrodiagnostic consultants. However, QA is the foundation upon which current understanding of EMG is based. Therefore, understanding the fundamentals is essential so that, in turn, disease processes are better understood.
-
Electromyographic (EMG) evaluation of the motor unit (MU): electrophysiologic biopsy. Schematic shows 2 MUs. A, Muscle fibers (MFs) are shown in side view. The endplate zone is central to the MFs (x). Distal region of the MFs on either side of their endplates is where their action potentials are propagated (y), ie, away from the endplates. B, Schematic representation of A on transverse view (ie, cross-section) demonstrates the overlap of MFs from different MUs and thus overlap in MU territories (of which only a portion is shown). C, MU potential (MUP) is recorded from the endplate region (see A, region x) and is characterized by its initial negative deflection. D, MUP shows the typical triphasic appearance with an initial positive deflection. This implies that it is recorded along the MFs away from the endplate zone (see A, region y) (sensitivity 100 mV per division vertical; sweep 5 ms per division). With permission, copyright P.E. Barkhaus, MD, 2001.
-
Electromyographic (EMG) evaluation of the motor unit (MU): electrophysiologic biopsy. Schematic compares 3 recording needle electrodes relative to a MU territory in a muscle. The recording surface of the macro-EMG electrode (A) is its cannula, which can extend throughout the MU territory. The concentric needle electrode (B) records from the inner core at its tip. The muscle fibers (MFs) closest to its tip contribute to such features as the amplitude (small semicircle), but it records from a moderate portion of the MU territory (circle). These MFs contribute to the duration feature of the MUP. The single-fiber EMG electrode is the most selective (C), with a recording surface of 25 μm diameter on the side of the needle's shaft. The recording area has a 300 μm radius. Image courtesy of www.casaengineering.com.
-
Electromyographic (EMG) evaluation of the motor unit (MU): electrophysiologic biopsy. Normal recruitment in deltoid muscle (A) recording with a concentric needle electrode: The first MUP is discharging at 13-15 Hz when a second, smaller MUP is recruited on sweep 4, discharging at 4 Hz. Potential 1 appears polyphasic, but only 4 phases are present. B shows 2 sweeps recruitment in myopathy with mild voluntary effort. The baseline appears relatively full, and individual MUPs cannot be identified without reducing level of effort and use of trigger delay. Calibration settings are as indicated. With permission, copyright P.E. Barkhaus, MD, 2001.
-
Electromyographic (EMG) evaluation of the motor unit (MU): electrophysiologic biopsy. Models to demonstrate increased recruitment frequency. A, Healthy muscle in which muscle fibers (MFs) from 6 MUs are observed close to the recording electrode. B, only 2 MUs have MFs close to the recording electrode surface; as this is a process of partial MU loss with subsequent reinnervation. C shows loss of MFs from MUs 2, 3, and 6 near the recording electrode, as may be observed in a myopathy. But MFs from only two MUs are actually close to the recording electrode surface (MUs 1 and 5) to give MUPs with sharp rise times. MUs 2, 4, and 6 are away from the recording surface and may be quite low in amplitude and appear as baseline noise, giving the erroneous impression of a reduced number of MUs. Courtesy of www.casaengineering.com.
-
Electromyographic (EMG) evaluation of the motor unit (MU): electrophysiologic biopsy. Photomicrograph showing differences between the most commonly used needle electrodes: monopolar (MON) and concentric (CN). Courtesy of www.casaengineering.com.
-
Electromyographic (EMG) evaluation of the motor unit (MU): electrophysiologic biopsy. Schematic showing the recording areas of the concentric (A) and monopolar (B) needle electrodes. In “A” the relative recording areas of the various features of the MUP (e.g., amplitude, area, etc.) have been modeled.{ref37} Courtesy of www.casaengineering.com.
-
Electromyographic (EMG) evaluation of the motor unit (MU): electrophysiologic biopsy. Trigger delay in instrumentation (calibration for A-E is 100 mV vertical, 5 ms horizontal per division): A shows 4 sweeps on free run mode from a patient with myopathy. First potential occurs at almost the same position on each sweep, indicating a steady firing rate of approximately 10 Hz. Second, smaller potential is discharging slightly faster, shifting left, to where it superimposes on potential 1 on the fourth sweep. Use of trigger delay is essential to ascertain each potential by visualizing it at least 3 times. B is a free run recording of rastered sweeps from a patient with severe myopathy. At least 2 MU potentials (MUPs) are seen as denoted by the numbers. The enlarged potential on the first sweep (open arrow) is the result of superimposition of MUPs 1 and 2. By slight manipulation of the recording electrode, trigger delay on potential 1 (C) shows a highly complex MUP that is unstable even at standard settings (note change in pattern of peaks). Two late components (“B” and “C”) are readily appreciated that are separated by baseline. Although this is observed in B sweep 2, demonstrating recurrence of the waveform 3 times is essential before ascertaining it as a MUP. D shows trigger delay on MUP 1. The highly complex MUP 2 is observed shifting left on subsequent sweeps, superimposing on potential 1 on sweeps 3 and 4. Another sweep showing potential 1 is needed to verify it as a bona fide MUP. In E, the recording electrode is manipulated slightly, and the trigger-delay now is set on MUP 2, thus confirming it as a complex MUP. MUP 1 is observed to the right on the top sweep and partially on the bottom sweep. With permission, copyright P.E. Barkhaus, MD, 2001.
-
EMG evaluation of the MU: the electrophysiologic biopsy. Influence of needle electrode position in a healthy (A) and a myopathic (B) MU. Note in the normal MU (A) how the MUP durations change little during movement of the electrode through the MU territory. Note also in electrode position 2 in the normal MU that 2 MUPs are recorded with a slight change (rotation) of the electrode. This slight change in electrode position substantially affects the prominence of the turn seen on the negative slope of the second MUP from the top. In myopathy (B), movement of the needle electrode through the MU territory results in marked changes in the MUPs recorded from the same MU. With permission, copyright P.E. Barkhaus, MD, 2001.
-
Electromyographic (EMG) evaluation of the motor unit (MU): electrophysiologic biopsy. Composite display of 25 MU action potentials (MUPs) from a patient with myopathy. Courtesy of www.casaengineering.com.
-
Electromyographic (EMG) evaluation of the motor unit (MU): electrophysiologic biopsy. Demonstration of the “blanket principle.”{ref79} Four trigger-delayed superimposed sweeps of a MUP (A) recorded with a concentric needle electrode from a patient with myopathy. Low-frequency filter is increased to 1000 Hz in B. Note that the amplitude is reduced and baseline "sharpened" with removal of the low-frequency components (i.e., MFs distant from the recording electrode tip). C, sweep speed is increased, shifting the smaller spike to the left. This recording is stable. Calibrations are as indicated. With permission, copyright P.E. Barkhaus, MD, 2001.
-
Electromyographic (EMG) evaluation of the motor unit (MU): electrophysiologic biopsy. MUP stability assessment by using a concentric needle (CN) electrode. A, B, C, E, and F recordings are made with low-frequency filter increased from standard 2-500 Hz; D is made with low-frequency filter at 2 Hz; calibration settings are as indicated. Trigger (except in D) is set at the third horizontal division from left to ensure entire signal can be seen. "A" superimposed sweeps from a healthy MUP showing stability. “B” and “C” show 4 and 10 superimposed sweeps, respectively, from a chronic neurogenic process with instability. D shows 2 sample sweeps of the same MUP in early reinnervation without the trigger. They look superficially similar; however, the potential on the second sweep is obviously shorter in duration as a result of instability (ie, drop out or "block" of some of the spike components). “E” and “F” are 10 superimposed sweeps from a patient with myasthenia. “E” shows increased instability or jitter, particularly in the spike to the left. “F” shows increased instability with blocking. With permission, copyright P.E. Barkhaus, MD, 2001.
-
Electromyographic (EMG) evaluation of the motor unit (MU): electrophysiologic biopsy. Schematic showing the generation of the MU action potential (MUP). A, Motoneuron (MN) generates an action potential (AP) that in turn excites the muscle fibers (MFs) by means of neuromuscular transmission. Propagation of the APs down the MF membranes is bidirectional away from the endplates. B, Cross-section schematic emphasizes dispersion of the MFs of that MU in the MU territory and their relative position to the recording needle electrode. Recording electrode is positioned between the endplate zone and the end of the MFs (ie, away from the endplate zone). C, Single MF APs recorded by the needle electrode (1-6 corresponding to the numbered MFs shown in A and B). AP recorded from MF 3 is largest because of its proximity to the electrode. D, Summation of the individual MF APs as they form the MUP. Courtesy of www.casaengineering.com.
-
Electromyographic (EMG) evaluation of the motor unit (MU): electrophysiologic biopsy. Schematic showing the features of the MUP. With permission, copyright P.E. Barkhaus, MD, 2001.
-
Electromyographic (EMG) evaluation of the motor unit (MU): electrophysiologic biopsy. Schematic of alterations in single muscle fibers (MFs) that contribute to changes in their action potentials (APs). A, healthy MF. B, Atrophy of the MF that results in a smaller AP. C, MF with segmental necrosis. In this instance the terminal axon branch (ie, innervated end to the right) has sent a collateral axon branch to the orphaned end (left) to reinnervate it. A terminal axon branch from an adjacent nonaffected MF also could have provided the source for the reinnervating collateral branch. D, Innervation of a denervated MF (2) by means of a collateral branch from an unaffected MF from another motor unit (1). E similar to D, shows the innervation of a regenerated MF from satellite cells via a collateral axonal branch from an adjacent MF. F, the MF is split distal to the endplate. Although a single arrow shows the AP propagating to the right, the AP propagating left into the split goes down each branch. An electrode recording from the split end would detect 2 APs with no jitter since they share a common end plate. Such splits may occur in hypertrophied MFs. With permission, copyright P.E. Barkhaus, MD, 2001.
-
Electromyographic (EMG) evaluation of the motor unit (MU): electrophysiologic biopsy. Schematic showing typical alterations of MFs and their spatial arrangement in a myopathic process (bottom left) and neurogenic process (bottom right). Enlarged MFs represent MF hypertrophy, that may be seen in either process and may be associated with MF splitting. Specific disease processes within each pattern may vary (eg, not all myopathic processes exhibit MF hypertrophy). Also, the schematics are not intended to show specific changes in disease processes that do not directly influence the motor unit action potential waveform (eg, inflammatory cells). In the neurogenic pattern, shaded MFs represent those that would show fiber type grouping on histochemical staining. This technique does not reveal MFs innervated by a single MN (ie, an “enlarged” or reinnervated motor unit). Dark, angular MFs represent those that are still denervated and that have not yet undergone reinnervation. These would not contribute to the MUP. With permission, copyright P.E. Barkhaus, MD, 2001.
-
Electromyographic (EMG) evaluation of the motor unit (MU): electrophysiologic biopsy. Schematic of MU in a myopathic process with associated MUPs; amplitude calibrations as indicated. A, Normal pattern. B-E, Various alterations in the MUP waveforms. These are based on alterations in MF size, their distribution within the MU territory, and their proximity to the electrode’s recording surface. Courtesy of www.casaengineering.com.
-
Electromyographic (EMG) evaluation of the motor unit (MU): electrophysiologic biopsy. Reduced recruitment. Single, fast, firing MUs are recorded in a severely weak muscle in a patient with myopathy (A) and a patient with neuropathy (B). MUP in A is complex and unstable. Note the missing large-amplitude spike as indicated by the thin arrow on sweep 4. Careful examination of the other complex waveforms reveals subtle changes among them, further demonstrating their instability. Open arrows on sweeps 3-5 indicate low-amplitude potentials on the baseline that represent small MUPs with few remaining MFs. These are easily overlooked unless the sensitivity is increased giving the false impression of a reduced number of MUPs as may be seen in a neurogenic process (see B). In B the MUP has very high amplitude and is considered a “giant MUP.” Calibration is as indicated. Courtesy of www.casaengineering.com.
-
Electromyographic (EMG) evaluation of the motor unit (MU): electrophysiologic biopsy. MU architecture in neurogenic process characterized by partial loss of MUs. “A” shows normal pattern with 2 MUPs (arrows denote MUP duration) that might be recorded by a concentric electrode (blue bar). In “B”, a surviving MU is reinnervating MFs from a denervated MU. Portions of the MU territory of the surviving MU may have normal distribution of the MFs if no reinnervation is occurring in that area. The MUP becomes complex with increased duration (note also the late component in “B” under the voltage marker). “C” is a more severe example of chronic ongoing MU loss with reinnervation by a surviving MU. Collateral reinnervation, as shown by MF type grouping on muscle biopsy, will be prominent. Shown are 2 MUPs that might be recorded by a concentric electrode (blue bar). These are enlarged in amplitude and duration (note difference in amplitude calibration compared with A: duration measurement at 100 mV sensitivity would be greater as shown in the second serrated MUP below, where duration is denoted by arrows). In “D” and “E”, schematic representations of “fractionation” are shown, in which previously reinnervated MFs (open circles) in an enlarged MU undergo denervation a second time. Courtesy of www.casaengineering.com.
-
Electromyographic (EMG) evaluation of the motor unit (MU): electrophysiologic biopsy. This schematic shows MU remodeling after complete MU loss (eg, complete nerve transection). “A” shows a healthy MU. In contrast, “B” shows early change in architecture characterized by variation in muscle fiber (MF) size as reinnervation proceeds with increased grouping of the MFs. The nascent motor unit action potential MUP showing complexity and instability is shown in “C.” Courtesy of www.casaengineering.com.
-
Electromyographic (EMG) evaluation of the motor unit (MU): electrophysiologic biopsy. Image shows the correlation of MU action potential (MUP) stability and fibrillation potentials. Note that the degree of MUP stability (number of unstable MUPs) and density of fibrillation potentials imply different explanations with respect to progressive versus stable neurogenic processes. Adapted from Stålberg. With permission, copyright P.E. Barkhaus, MD, 2001.
-
Composite of 20 motor unit action potentials (MUAPs) recorded with a concentric needle electrode from the biceps brachii of a patient with s-IBM. Note the wide range in size and complexity in the MUAPs. Copyright, Paul E Barkhaus, MD, 2000, with permission.
-
Top - A large, complex motor unit potential (MUP; 5 phases, approximately 2500 microV amplitude and 3 ms duration) firing at a progressively increasing rate (ie, shifting left) at about 13 Hz in apparent isolation. In normal muscle, other motor units would be typically recruited at this threshold (calibration 1 mV/division vertical; 10 ms/division horizontal). In the bottom trace the sensitivity is increased to 500 microV/division vertical (no change in horizontal time base), showing very small MUPs in the baseline on either side of the large MUP. This may give an erroneous impression of a “neurogenic” MUP, as these small potentials are overlooked easily or mistaken for baseline noise or fibrillation potentials. Note also that despite the large amplitude of this MUP, the spikes have essentially no area, giving them a very sharp, “needle-like” appearance. Copyright, Paul E Barkhaus, MD, 2000, with permission.
-
Interference pattern in biceps brachii. Top trace - Normal interference pattern at full effort (calibration - 500 microV/division vertical; 1 s/division horizontal). The middle trace is an interference pattern from a patient with severe sporadic inclusion body myositis (s-IBM) (calibration - 100 microV/division vertical; 1 s/division horizontal). This epoch of signal actually shows the patient going from minimal activation at the left (beginning of the sweep) to full effort on the far right. The "notch" just to the right of the second division mark shows a baseline shift from needle electrode movement. Overall, minimal amplitude change of "fullness" is seen going from minimal to full effort, and the amplitude of the signal epoch is less than half of what might be expected in normal muscle. The bottom trace is an expanded segment from the start of the middle trace (calibration - 100 microV/division vertical; 10 ms/division horizontal) (see "H" bar position between the middle and lower sweeps at the start of the middle trace). This shows a relatively full baseline of small-amplitude, complex motor unit action potentials (MUPs). Copyright, Paul E Barkhaus, MD, 2000, with permission.
Tables
ACh |
Acetylcholine |
AP |
Action potential |
ATPase |
Adenosine triphosphatase |
CMAP |
Compound muscle action potential |
CN |
Concentric needle electrode |
CFL |
Critical firing level |
EMG |
Electromyography |
FF |
Fast twitch, fatigable (type II alpha MN) |
FR |
Fast twitch, fatigue-resistant (type II alpha MN) |
IA |
Insertion activity |
IP |
Interference pattern |
MF |
Muscle fiber |
MN |
Motoneuron |
MON |
Monopolar |
MU |
Motor unit |
MUP |
Motor unit potential |
MUT |
Motor unit territory |
NA |
Not applicable |
QA |
Quantitative analysis |
S |
Slow twitch, slow fatigue (type I alpha MN) |
SA |
Spontaneous activity |
SFEMG |
Single-fiber EMG |
|
Alpha MN Types |
||
Relative Characteristics |
I (S = slow twitch, fatigue resistant) |
II (FR = fast twitch, resistant to fatigue) |
II (FF = fast twitch, fast to fatigue) |
Neuronal cell-body size |
Smaller |
NA |
Larger |
Axonal diameter |
Smaller |
NA |
Larger |
Axonal conduction velocity |
Slow |
Fast |
Faster |
After-hyperpolarization time |
Long |
Intermediate |
Short |
Firing rate |
Slow and regular on minimal effort |
Intermediate |
Fast on strong effort |
Afferent input (ie, dendritic volume) |
Large |
Intermediate |
Small |
Relative excitability threshold |
Low |
Intermediate |
High |
Twitch tension |
Low, long |
Intermediate, long |
High, brief |
Contraction time |
>99 ms |
Intermediate |
< 85 ms |
Fatigability |
Slow |
Relatively slow |
Fast |
Force generated |
Low |
Moderately high |
High |
|
Corresponding MF Types |
||
Histochemical Reactivity |
1 |
2A |
2B |
Alkaline ATPase (pH 9.4) |
Low |
High |
High |
Acidic ATPase (pH 4.65) |
High |
Low |
Moderate |
Oxidative enzymes |
High |
Medium high |
Low |
Glycogen |
Low |
High |
High |
Phosphorylase |
Low |
High |
High |
Myoglobin |
High |
High |
Low |
ATPase = adenosine triphosphatase; NA = not applicable. *Although related, alpha MN subtypes are not equal to MF histochemical types. |
|||
Feature |
Definition or Comment |
Amplitude |
This is measured as the total peak-to-peak amplitude. |
Area |
This is measured as the area under the rectified waveform within a defined duration. |
Area-to-amplitude ratio |
This measures the thickness of the main spike. [39] |
Duration |
Duration is defined as the time interval between the signal's deviation from the baseline and its return to the baseline. In quantitative EMG, polyphasic MUPs are not included in duration measurements. [81] |
Phase |
This is a deviation of the signal from, until its return to, the baseline. A MUP having more than 4 phases is considered polyphasic. |
Turn |
This is a change in polarity (must be defined in terms of µV; usually a turn of 50 µV is considered clinically significant). A MUP having more than 5 turns is abnormal. When excess turns are present, the MUP is termed serrated. Slight movement may easily change a turn onto a phase, or vice versa. |
Late component |
This is a waveform that is time locked to the main MUP but separated from it by an isoelectric interval. It sometimes is referred to as a satellite or linked potential. (The duration measure does not include such potentials.) |
Complexity |
A MUP is called complex if it has more than 4 phases, more than 5 turns, or a satellite potential. |
Variability |
This refers to changes in shape of the MUP on consecutive discharges at standard filter settings. By changing the instrument settings to those used in SFEMG, increases in jitter or instability of the CN MUP may be best assessed by superimposing successive sweeps (see second and third image below this table). Stålberg et al have quantified the vertical instability of the MUP, terming it jiggle. |
|
Pathologic Correlates |
|
MU Action Potential Abnormality |
Myopathic Processes |
Neurogenic Processes |
Increased Amplitude |
|
|
Decreased Amplitude |
|
|
Increased Duration |
|
|
Decreased Duration |
|
|
Polyphasia |
|
|
MU instability |
|
|
Method |
Description or Comment |
Manual |
Pioneered by Buchthal [1] Requires low activation of muscle Analysis essentially limited to MUP amplitude, duration, and phases Easily performed with most equipment but time-consuming |
Trigger delay |
Requires some modification to equipment: amplitude trigger, delay line, and averager [46] Measurements biased toward higher amplitude MUPS, and usually only 1 MUP can be collected per site Requires experience and practice in acquisition Analysis of MUP features may be basic as above, or software may allow additional analysis of measurements (eg, area) Time-consuming |
Multi-MU analysis [88] |
Acquires 1–6 MUPs per site at minimal activation Therefore no bias toward larger amplitude MUPs Uses decomposition and averaging technique Acquisition and analysis very rapid Requires review and editing of data to ensure quality Good reproducibility |
Decomposition |
Allows acquisition at higher levels of activation with subsequent breakdown of signals into their component MUPs Requires editing and validation of MUPs by operator [89] |