Overview
Although they are not universally available, functional neuroimaging techniques, including positron emission tomography (PET) scanning, single-photon emission computerized tomography (SPECT) scanning, magnetic resonance spectroscopy (MRS), magnetic source imaging (MSI), and functional magnetic resonance imaging (fMRI), can be very helpful in the localization of the epileptogenic zone and for mapping functional areas of the brain, such as those for language and motor function. [1] (See the image below.)
The clinical use of each of the above imaging modalities in patients with epilepsy is reviewed in this article, with an emphasis on MRI structural imaging.
For more information, see the following:
Epilepsy Protocol MRI
The imaging of epilepsy has vastly changed since the end of the 20th century. Prior imaging with computed tomography (CT) scanning infrequently revealed the pathologic substrate for epilepsy. Although early low-field strength magnetic resonance imaging (MRI) increased the diagnostic yield, it could identify only obvious pathology, such as neoplasms, encephalomalacia, and vascular malformations.
The advent of high-resolution MRI with a dedicated epilepsy protocol has significantly increased the frequency with which pathologic substrates for epilepsy are identified. This has had a dramatic clinical impact on the evaluation and management of epilepsy, because MRI findings can assist with classification, determine prognosis for remission, predict long-term intractability to antiepileptic medications, and identify potential surgical candidates.
The International League Against Epilepsy (ILAE) guidelines for neuroimaging in patients with epilepsy (1997) recommends a dedicated epilepsy protocol MRI for all patients with a new-onset seizure or newly diagnosed epilepsy in a nonemergent setting. [2] In addition, the ILAE Commission on Neuroimaging recommends an epilepsy protocol MRI in all patients with intractable epilepsy.
Conventional versus epilepsy protocol MRI
Conventional MRI is inadequate for patients with epilepsy, since many of the findings are subtle and easily missed. Routine MRI consists of a short scan time, 3- to 5-mm thick slices with an interslice gap of 2-3 mm. These studies do not include spoiled gradient recalled (SPGR) or magnetization prepared rapid gradient echo (MPRAGE), T1-weighted images that enhance gray/white matter differentiation, which is crucial to the analysis of cortical architecture.
These images are also not acquired in a coronal oblique plane perpendicular to the long axis of the hippocampus, which is particularly important when evaluating temporal lobe epilepsy (TLE).
Epilepsy protocol MRI at 1.5T or 3.0T, on the other hand, includes the entire brain from nasion to inion, T1-weighted MPRAGE or SPGR images 1.5-mm slice thickness with no intervening gap obtained in the coronal oblique plane (if TLE is suspected). These images are acquired as a 3-dimensional (3D) volume, thereby allowing postprocessing to correct for head misalignment and for reformatting images into multiple planes to confirm a subtle MCD.
An epilepsy protocol MRI also includes coronal and axial fluid-attenuated inversion recovery (FLAIR) sequences with a 2- to 3-mm slice thickness and a 0- to 1-mm interslice gap. A conventional thin-slice (3-mm), T2-weighted, axial and coronal sequence is also obtained.
Gadolinium is not required unless a patient has new-onset epilepsy or if a known tumor or vascular malformation is identified. Gadolinium is also used if certain neurocutaneous syndromes, such as Sturge-Weber syndrome, are present, to visualize leptomeningeal angiomatosis.
Benefits of epilepsy protocol MRI
Unfortunately, in most clinical practice settings, a nonepilepsy protocol MRI is performed. While a routine MRI excludes ominous structural substrates that require urgent treatment, such as high-grade gliomas and arteriovenous malformations, subtle structural substrates, such as hippocampal sclerosis and malformations of cortical development (MCDs), are missed. Identification of these substrates has long-term therapeutic and prognostic implications for remission versus intractability.
Approximately one third of patients with focal-onset epilepsy are medically intractable (defined as failing at least 2 first-line antiepileptic drugs [AEDs]). The chance of being considered a candidate for epilepsy surgery is greatly enhanced when a structural substrate is found on MRI. [3, 4]
In a cross-sectional study, in patients with focal epilepsy who had a standard MRI scan, an abnormality was found in 49%, and in patients who had an epilepsy protocol MRI scan, an abnormality was found in 72%. [5] Similar findings occurred in an earlier study, by Li et al. [6]
In another study, using radiologists considered expert in interpreting epilepsy findings, focal-lesion sensitivity for standard MRI was 50%, compared with a sensitivity of 91% for epilepsy protocol MRI. [7] A study by Kwan and Brodie in 2000 found that in patients with newly diagnosed epilepsy, only 47% became seizure free with the first AED and only 14% with the second AED. [8] Further AED trials achieved seizure freedom in only 5% of patients. This study showed that intractable epilepsy is more common than generally believed and can be identified early. However, referral for epilepsy surgery is delayed in half of patients with intractable epilepsy who are referred more than 10 years from the onset of intractability.
This study further underscores the importance of epilepsy protocol MRI, which has a high yield for identifying a structural substrate that would enable these patients to be referred early for an epilepsy surgery evaluation, thus providing them with an optimal chance of attaining seizure freedom.
Evaluation of a First Seizure
The author's practice is that all patients presenting with a first seizure in adulthood should be evaluated with high-resolution epilepsy protocol MRI. In one study of 300 consecutive patients presenting with a first seizure, an epileptogenic lesion was identified by MRI in 14%. [9] In another study, MRI detected etiologically relevant structural abnormalities in 12.7%. [10] Thus, even in patients with a single seizure, a significant number of patients had an abnormal MRI that correlated with their epilepsy.
In intractable epilepsy, on the other hand, MRI identifies the pathologic substrate in 82-86% of patients. Children presenting with focal seizures also should be evaluated by MRI scanning. Children or adults with clinically evident idiopathic generalized epilepsies (eg, childhood absence epilepsy, juvenile myoclonic epilepsy) probably can forgo MRI scanning, although in clinical practice, being confident of the diagnosis at the time of presentation is often difficult. The presence of MRI abnormalities in patients with new-onset epilepsy is predictive of seizure recurrence and also predicts lack of seizure control with medical therapy.
Most importantly, MRI scanning in this setting detects abnormalities, such as brain tumors, arteriovenous malformations, or cryptogenic infarctions, that may require further diagnostic and therapeutic interventions to prevent neurologic deterioration. CT scanning is used widely in patients presenting with a first seizure, usually because it is more readily available than MRI in most emergency departments. However, patients should be referred for an epilepsy protocol MRI scanning as an outpatient.
MRI of the Temporal Lobe
Hippocampal sclerosis
Hippocampal sclerosis (HS) is characterized by neuronal loss and gliosis. HS is the most common pathologic substrate of surgically treated epilepsy in adults and is seen in 67% of patients. In patients with newly diagnosed epilepsy, it has been reported in 1.5-3% of adults. When evaluating the medial temporal structures (hippocampus, amygdala, entorhinal cortex, and parahippocampal gyrus), one should evaluate the size, signal, shape, and dual pathology (SSSD).
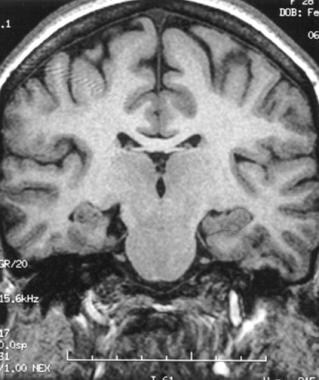
The typical MRI findings of HS include atrophy of the hippocampus on T1-weighted SPGR (typically seen in 90-95% of cases). The atrophy is most prominent in the hippocampal body.
On FLAIR imaging, increased signal is observed in the hippocampus (see the image below). FLAIR is ideally suited to identify signal changes in the hippocampus, since gliotic changes have increased water content appearing as increased signal on T2-weighted MRI. The FLAIR sequence nulls the increased signal intensity of the cerebrospinal fluid (CSF) in the temporal horn of the lateral ventricle and the choroidal fissure that can dwarf the increased signal in the hippocampus on a conventional thin-slice T2-weighted spin echo image.
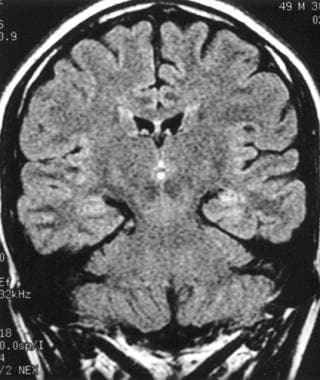 Fluid-attenuated inversion recovery (FLAIR) MRI showing increased signal within the left hippocampus.
The baseline signal of the hippocampus on FLAIR MRI is greater than that of the cortex and can be mistakenly interpreted as bilateral HS. In these cases, thin-slice coronal T2-weighted images should be reviewed for confirmation.
Hippocampal atrophy and increased signal are not always seen together in the same patient. For example, some patients have an increased FLAIR or T2 signal without accompanying atrophy. The increased T2 signal is felt to reflect gliosis rather than neuronal cell loss. Occasionally, secondary findings of hippocampal sclerosis are observed, such as (1) enlargement of the ipsilateral temporal horn, (2) thinning of the fornix, (3) mamillary body atrophy, (4) loss of normal interdigitations of the hippocampal head, and (5) atrophy of the collateral white matter between the hippocampus and the collateral sulcus.
High-resolution MRI is 80-90% sensitive for identifying hippocampal sclerosis by qualitative interpretation. Bilateral hippocampal atrophy is seen in 10-20% of patients, but it may be difficult to visualize unless quantitative measures are done.
In children, HS is observed in 21% of patients with newly diagnosed TLE and in up to 57% of patients with intractable TLE. More common findings in children with intractable TLE include MCDs and developmental tumors.
Hippocampal sclerosis and dual pathology
Approximately 15-20% of patients with HS have dual pathology, that is, another pathologic substrate within or outside the temporal lobe in addition to HS.
Dual pathology is more commonly observed with malformations of cortical development and developmental lesions, such as porencephaly. It is less commonly seen with vascular malformations (7%) and neoplasms (2%). With vascular malformations, HS is more likely to be present if the lesion is in close proximity to the hippocampus.
Pitfalls in the evaluation of hippocampal sclerosis
One must also be vigilant not to attribute all cases of increased signal within the hippocampus to HS. While increased signal on FLAIR indicative of HS is not always accompanied by hippocampal atrophy, the hippocampus should never be abnormally enlarged, since this indicates a low-grade neoplasm, hamartoma, or hippocampal dysplasia and not HS.
Entorhinal cortex atrophy
While quantitative assessment of the entorhinal cortex (ERC) is ideal, ERC size can be evaluated by visual assessment. ERC atrophy is often seen concomitantly with hippocampal atrophy, but it can also be seen independently. It is characterized by thinning ERC gray matter and the underlying collateral white matter.
Amygdala atrophy and dysplasia
The amygdala should be evaluated for symmetry. Occasionally, the amygdala may be reduced in size along with hippocampal atrophy. However, this is difficult to observe visually. Amygdala atrophy accompanying HS has been identified with volumetric analysis in 12% of pathologically confirmed patients with HS. Another study identified ipsilateral amygdala atrophy by volumetry accompanied HS in 20% of patients. However, it was also found that amygdala atrophy was contralateral to HS in 15% of patients.
Sometimes, the amygdala is pathologically enlarged consistent with amygdala dysplasia, hamartoma, or a low-grade neoplasm. This enlargement may or may not be associated with increased signal on FLAIR MRI. Usually, in the setting of a low-grade glioma or a developmental tumor, accompanying T2-signal changes are present.
Amygdala enlargement is not associated with hippocampal atrophy and is seen in imaging-negative TLE. However, sometimes amygdala enlargement is accompanied by hippocampal enlargement and likely represents hamartomatous enlargement of the hippocampus and the amygdala.
Viewing the images in the axial plane may also increase the yield of identifying enlargement of the amygdala. One group recommended that abnormal amygdalar enlargement can be visually assessed by evaluating for prominent amygdala gray matter extending medially, anterior to the sylvian fissure. [11]
Classification of Malformations of Cortical Development
MCDs are classified into the following 3 categories based on the stage the MCD occurred:
-
Cortical dysplasia - Neuronal and glial proliferation or apoptosis < 10 wk
-
Heterotopias - Abnormal neuronal migration 10-20 wk
-
Polymicrogyria - Abnormal late cortical migration and organization >20 wk
Some degree of cortical organization also occurs postnatally. [12]
MRI of Malformations of Cortical Development
Malformations due to abnormal neuronal and glial proliferation or apoptosis
Microlissencephaly and microcephaly with simplified gyral pattern has been described in patients with profound congenital microcephaly (head circumference that is more than 3 standard deviations below normal at birth). These conditions are felt to result from abnormally decreased cellular proliferation or pathologically increased apoptosis. The sulcal pattern is similar to the sulcal pattern in healthy patients; however, there are too few sulci. If the cortex is of normal thickness (3 mm), a diagnosis of microcephaly with simplified gyral pattern can be made. If the cortex is abnormally thick, then a diagnosis of microlissencephaly is made.
Hemimegalencephaly is characterized by abnormal enlargement of a lobe, multiple lobes, or a hemisphere due to marked dysplasia. This condition can be an isolated finding or can be seen with neurocutaneous syndromes such as (1) epidermal nevus syndrome, (2) hypomelanosis of Ito, (3) neurofibromatosis type 1, (4) Klippel-Trenaunay-Weber syndrome, or (5) tuberous sclerosis. Imaging findings include large clumps of gray matter that extend from the pial surface to the ventricle. The affected lobe or hemisphere is enlarged, the white matter shows increased signal on T2-weighted images, and usually the lateral ventricle is enlarged in the dysplastic region.
Cortical dysplasias
Palmini et al described a consensus panel on the terminology of cortical dysplasias based on histopathologic, clinical, and imaging findings. [13] Cortical dysplasias are separated into minor malformations of cortical development (mMCDs) and more severe focal cortical dysplasias (FCDs). (See the image below.) [14]
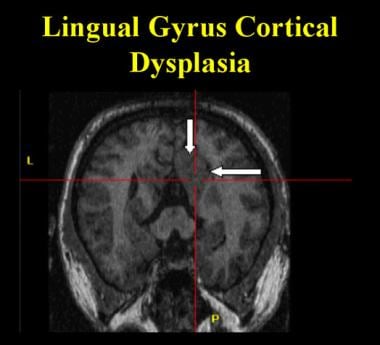 Cortical dysplasia in the lingual gyrus extending anteriorly into the posterior parahippocampal gyrus. Note the thickened cortex and the loss of the gray-white matter interface as compared to the contralateral side.
The mMCDs consist of derangements of focal cortical architecture, with type 1 mMCD lesions representing ectopic neurons involving or adjacent to cortical layer 1 and type II mMCDs representing microscopic neuronal heterotopias outside layer 1.
FCDs are divided into those without dysmorphic neurons or balloon cells (type 1) and those with dysmorphic neurons (type 2). Type 1 FCDs are further divided into those with architectural abnormalities only (type 1A) and those with giant or immature (but not dysplastic) neurons (type 1B).
Type 2 FCD classification is based on the absence (type 2A) or presence (type 2B) of balloon cells. [13]
The mMCDs are usually not identifiable on epilepsy protocol MRI, but they can sometimes be seen at 3T MRI with phase array coils. [15] Type 2B FCDs are nearly identical on MRI to those seen in tuberous sclerosis.
FCDs, particularly the type 2 variety, are more likely to be visualized on MRI. Of all malformations of cortical development, FCDs are the most likely to be amenable to surgical resection. Sometimes, the cortical dysplasia extends from the pia to the ventricle (transmantle dysplasia).
MRI findings in patients with FCD include the following:
-
Cortical thickening observed on at least 3 or more contiguous slices
-
Blurring of the gray-white matter junction
-
Increased signal of the underlying white matter on T2-weighted image/FLAIR
-
Often, a linear, curvilinear, or funnel-shaped tapering of abnormal signal intensity extending from the cortical white matter junction to the ependymal surface of the lateral ventricle
-
A deep or wide sulcus, with thickened gray matter at the depth of a sulcus
-
Broadening of a gyrus
Malformation due to abnormal neuronal migration
Classic lissencephaly (smooth brain) is defined as reduced sulcation, and the cortical surface shows reduced number and depth of sulci. In some cases, there is complete absence of sulcation; in others, there is a reduction of sulcation.
This condition is due to a mutation of either the LIS1 gene at chromosome 17p13.3 or the DCX gene at Xq22. Both mutations are believed to cause lissencephaly by interfering with translocation of migrating neurons as they advance along radial glial cells. With the LIS1 mutation, the abnormality is most severe in the parieto-occipital lobes, and with the DCX mutation, the gyral abnormality is most severe in the middle and anterior half of the frontal lobes.
Heterotopia refers to a collection of neurons in an abnormal location. The neurons can be located in the subcortical white matter or in the subependymal region (periventricular), or they can be underlying the normal-appearing cortex in a laminar pattern (SBH). The collections of cells exist as round to ovoid nodules that consist of neuronal and glial cells. On MRI, they are gray matter isointense on T1- and T2-weighted imaging.
Subcortical heterotopias can range from single to multiple gray matter nodules that may extend from the ventricular wall to the cortical mantle. Occasionally, there may be dimpling of the cortex overlying the region of the heterotopia. They are usually unilateral but can be bilateral, in which case they are associated with cognitive delay.
Subcortical band heterotopia (SBH) represents a milder form of the LIS1 or DCX mutation. On MRI, either a thick or a thin band of cortex is seen in the white matter underlying and running parallel to the normal-appearing cortex.
If the SBH is mainly frontal, the DCX mutation is the likely cause, whereas if it is observed in the parieto-occipital region, the LIS1 mutation is more likely. Other mutations have also been described, and the reader is referred to a review by Barkovich. [16]
SBH can easily be missed when it consists of a thin band of cortex. Clinically, some of these patients appear to have localization-related epilepsy from another region. However, surgical outcome in this group is poor, since the SBH is a marker of diffuse epileptogenicity.
Periventricular nodular heterotopias (PVNs) are most commonly seen in the lateral ventricles, with the trigones and the frontal horns being the most frequent locations. PVNs are round or oval and can lie in the wall of the ventricle and protrude into the ventricular space or sometimes are present in the periventricular white matter.
In mild cases of PVN, only a few nodules are seen, whereas, in more severe cases, a continuous layer can be seen lining the ventricular wall. These nodules are gray matter isointense on all MRI sequences. While many cases are sporadic, some cases are due to a mutation of the FLNA gene that codes for filamin 1, which is involved in the migration of the neuron from the germinal zone onto the radial glial fibers, and is located on band Xq28.
Identification of PVNs is clinically important, because seizure-free outcome after anteromedial temporal is poor in patients with PVNs with clinical and EEG features of TLE. The reason for this is that these nodules are epileptogenic; small series have demonstrated that a good surgical outcome can be obtained when the PVNs are unilateral and seizures localize to the nodule(s) and are resected.
Malformations secondary to abnormal late migration and organization
Polymicrogyria (PMG) consists of an excessive number of small gyri with shallow sulci. PMG can be (1) focal and limited, (2) focal unilateral and extensive, (3) bilateral and symmetrical, (4) bilateral and asymmetrical, (5) multifocal, or (6) diffuse. On MRI, numerous small gyri with shallow sulci are seen. Sometimes, the cortex has an irregular, bumpy inner and outer cortical surface with broad gyri and shallow sulci. The cortical-subcortical junction is often irregular.
Schizencephaly consists of a CSF cleft extending from the subarachnoid space to the lateral ventricle. The wall of the cleft is lined with dysplastic cortex and/or polymicrogyria. The lips of the cleft can be closed (type 1) or open (type 2). The most common location is posterior perisylvian cortex. Two thirds of cases are unilateral, and one third of cases are bilateral. Schizencephaly is commonly associated with polymicrogyria, optic nerve hypoplasia, and absence of the septum pellucidum. Although PMG and schizencephaly are strikingly abnormal on MRI, they often contain primary motor, sensory, or visual function.
Focal cortical dysplasia (FCD) without balloon cells consists of a focal abnormality of cortical lamination of the cerebral cortex and the underlying white matter with abnormal cortical neurons but without the presence of balloon cells or cells extending from the pial surface to the ventricular surface. MRI findings include cortical thickening on 3 or more contiguous slices, blurring of the gray-white matter junction, and focal cortical thinning with volume loss of the underlying white matter. An increased signal on T2-weighted imaging may be seen; however, the signal does not extend to the ventricular surface.
An occasional helpful finding is the "cleft-dimple" complex, in which the size of the subarachnoid space overlying the FCD is enlarged and the cortex appears to buckle away from the subarachnoid space. The neuroimager must be aware that normal cortex may appear thickened when sliced obliquely cross a sulcus. In this regard, it is imperative to make sure that the findings seen on numerous contiguous slices are still present when reformatted into multiple planes and correlated with clinical, EEG, and functional imaging data. One must also be aware that the mildest forms of FCD characterized by dyslamination alone may not show any abnormality even on high-resolution MRI.
MRI of Neoplasms Associated With Epilepsy
Neoplasms are the structural substrate in 3-4% of patients with epilepsy in the general population. In patients with intractable epilepsy treated with epilepsy surgery, neoplasms account for approximately 20% of cases. Neoplasms associated with chronic epilepsy are usually located in the cortex and are not usually associated with mass effect or vasogenic edema. The temporal lobe is the most common location (68%).
Neoplasms found in patients with chronic epilepsy include (1) low-grade astrocytic tumors, (2) oligodendroglioma, (3) gangliogliomas, (4) dysembryoplastic neuroepithelial tumor (DNET), and (5) a pleomorphic xanthoastrocytoma (PXA).
Most neoplasms are hypointense on T1-weighted images and hyperintense on T2-weighted images. However, distinguishing these neoplasms is often difficult, unless specific imaging characteristics for each tumor are present on MRI.
Astrocytomas, fibrillary subtype (World Health Organization [WHO] grade 2), are usually ill-defined, infiltrative tumors that usually do not enhance with gadolinium. Pilocytic astrocytomas, on the other hand, are well defined, although not encapsulated, and a mural nodule is seen after gadolinium enhancement.
Oligodendrogliomas are usually peripherally located and may appear cortically based with gyriform calcifications and adjacent changes in the calvaria. They are commonly seen in the frontal or temporal lobe. Gadolinium enhancement is variable.
Gangliogliomas are most commonly seen in the temporal lobe of patients younger than age 30 years. They are mixed solid and cystic lesions that are cortically based, with minimal or no mass effect. Calcification is often present. Gadolinium enhancement is variable. The finding of calcification and cystic changes in a cortically based lesion raises the possibility of this neoplasm. These lesions can be associated with concomitant cortical dysplasia.
Dysembryoplastic neuroepithelial tumors (DNET) are benign, low-grade, multicystic, and multinodular cortical-based tumors that are seen primarily in children and young adults. A cortically based hypointense nodule can be seen on T1-weighted images. Calvarial remodeling may be seen. Cortical dysplasia can be seen in 20-30% of these tumors. Gadolinium enhancement is variable. If a cortically based, multicystic tumor is seen on MRI, a DNET should be considered.
Pleomorphic xanthoastrocytomas (PXAs) are superficially located tumors adjacent to the leptomeninges with an enhancing mural nodule. Leptomeningeal involvement is characteristic of this tumor. Local recurrence and malignant transformation can occur with this tumor in 50% of patients.
MRI of Vascular Malformations
Vascular malformations constitute 5% of epileptogenic substrates in the general population of patients with epilepsy. In surgically treated patients with TLE, vascular malformations constitute approximately 10% of cases. Arteriovenous malformations (AVM) and cavernous malformations are the most common vascular malformations causing seizures.
AVMs consist of a tangle of blood vessels lacking an intervening capillary network, leading to direct arteriovenous shunting of blood. T1- and T2-weighted images demonstrate serpiginous flow voids with areas of T2 prolongation in adjacent brain. The high velocity flow masks gadolinium enhancement.
Cavernous malformations (CMs) are composed of well-circumscribed vascular spaces with blood in varying stages of evolution. A characteristic feature is the absence of intervening brain tissue. Most CMs are sporadic, but 10-30% are familial. An associated developmental venous anomaly is seen in 25%.
Hemorrhage is more common in women with CMs, as well as in lesions with an associated developmental venous anomaly. CMs are slow-flow lesions and are therefore angiographically occult. Familial cases often have multiple CMs.
In CM imaging, hemosiderin results in magnetic susceptibility artifacts, which appear as flow voids on MRI. Therefore, gradient echo images that are affected by magnetic susceptibility are highly sensitive to identify occult CM. Since the internal bleeding is of different ages, there may be conversion from hemoglobin to methemoglobin, which produces foci of hyperintensity on T1-weighted images. The peripheral hemosiderin produces T2 shortening, causing a black halo to surround the lesion.
T2* gradient recall echo (GRE) sequence is excellent for augmenting the appearance of magnetic susceptibility artifact that is seen with lesions associated with hemosiderin. With this technique, focal regions of occult hypointensity can be identified, indicating regions of remote trauma or cavernous malformations. This technique is essential in patients with cavernous malformations, since it can identify other occult, cavernous malformations manifesting as tiny circular regions of hypointensity.
Susceptibility weighted imaging (SWI) is even more sensitive than T2*GRE in identifying lesions that produce magnetic susceptibility artifact. [17] In this regard, either T2*GRE or SWI (if available) must be a component of any epilepsy protocol MRI.
Diffusion Tensor Imaging
Diffusion tensor imaging (DTI) allows information on the magnitude and direction of water diffusion to be collected. The apparent diffusion coefficient map represents the magnitude of diffusion in a given voxel. The fractional anisotropy (FA) map reflects the average directional bias of the diffusion in a given voxel.
FA is a ratio with a range of 0 to 1, with 0 representing no directional bias and 1 representing the theoretical limit of all diffusion in 1 direction. In the white matter, diffusion is directionality determined primarily by the myelin and the cell membranes of the axons. Thus, by evaluating the directional bias of diffusion in adjacent voxels, the path of white matter tracts can be inferred.
In the epilepsy surgery evaluation process, DTI helps to identify potentially important white matter tracts with functional implications to help guide epilepsy surgery resections. In addition, DTI can be helpful in detecting the extent of white matter involvement beyond areas of visually detectable signal change. [18]
Positron Emission Tomography Scanning
Fluorodeoxyglucose PET scanning
Fluorodeoxyglucose PET (FDG-PET) scanning reveals interictal hypometabolism of the epileptogenic temporal lobe in more than 85% of cases. This zone of hypometabolism is much larger than the ictal-onset zone defined electrophysiologically and the epileptogenic region defined pathologically. [19]
FDG-PET scanning is more sensitive when an asymmetry index is calculated, comparing the quantitative metabolism of each temporal lobe; the test prevents misinterpretation due to partial volume averaging artifact. The degree of hypometabolism does not correlate with the degree of cell loss or the degree of hippocampal atrophy identified by MRI. In patients with TLE, unilateral hippocampal atrophy, and concordant EEG data, FDG-PET scanning provides redundant data. However, it may provide additional information in patients whose MRI and EEG findings are discordant and in patients whose MRI findings are normal.
Visual analysis of FDG-PET scans is less sensitive in frontal lobe epilepsy, with fewer than 50% of cases showing localized abnormalities. In these cases, quantitative, normalized analysis may improve sensitivity of this test.
Techniques such as statistical parametric mapping (SPM) and 3D stereotactic surface projection (3-DSSP) images, may be more sensitive than conventional FDG-PET analysis.
With the SPM technique, the subject's PET scan is subtracted on a pixel-by-pixel basis from a normal database of control subjects. This technique may provide localizing information in patients with either extratemporal epilepsy or TLE with a normal MRI.
Coregistration with MRI improves the sensitivity and specificity of FDG-PET scanning by correcting for partial volume effects and enables close correlation with subtle malformations of cortical development. [20] Furthermore, such coregistration can also predict which cortical tubers, which are often multiple, in tuberous sclerosis are epileptogenic and can improve surgical seizure-free outcomes.
11C-flumazenil PET
Early evidence suggested that radioligand PET scans with the benzodiazepine antagonist11 C-flumazenil (FMZ) may have greater sensitivity in identifying the epileptogenic region than do FDG-PET scans. FMZ labels central GABA receptors.
Early studies at the University of Michigan showed a reduction in FMZ binding in the temporal lobe of patients with intractable TLE, which is more restricted than the region of hypometabolism seen with FDG-PET scanning. This reduction in FMZ binding correlates with neuron loss in the hippocampus.
Techniques using SPM and an MRI-based method for partial-volume effect correction have shown that the reduction in FMZ binding is greater than the reduction that would be expected from volume loss alone. This finding suggests that, in addition to neuronal loss, GABA binding in the epileptogenic hippocampus is reduced.
FMZ-PET scanning also shows enhanced sensitivity in patients with MCDs.
Studies have shown either increases or decreases in benzodiazepine receptor density in regions of MCDs. However, surgical outcome in patients with a localized abnormality on FMZ-PET scans and normal MRI findings is not yet known.
The difficulty of creating such tracers with a short half-life limits the practicality and the availability of this technique to a handful of centers. Furthermore, the lack of outcome data and the cost prevent the routine clinical use of this technique.
Alpha methyl L-tryptophan and serotonin receptor PET imaging
In view of evidence that serotonin plays a role in epilepsy, PET imaging with serotonin precursors or serotonin agonists has been used in hopes of improving the detection of the epileptogenic zone.
For example, reduced concentrations of brain serotonin are found in the brains of the genetically epilepsy-prone rat (GEPR). In addition, treatment with agents that facilitate serotonergic transmission inhibits seizures in many animal models of epilepsy. Reduction of brain serotonin concentrations, on the other hand, increases seizure susceptibility in animal models of epilepsy. Furthermore, in human epileptic brain tissue resected for the treatment of epilepsy, increased serotonin was found.
Alpha methyl L-tryptophan, like L-tryptophan, is a serotonin precursor that can help to measure brain serotonin synthesis rates. Like tryptophan, AMT is metabolized into serotonin, but unlike tryptophan, it is not converted into protein. AMT is converted to alpha methyl serotonin, but unlike serotonin, it is not metabolized by monoamine oxidase.
Chugani and colleagues used AMT in patients with tuberous sclerosis and found reduced AMT uptake in cortical tubers as compared with normal cortex. However, epileptogenic tubers confirmed by ictal onset region demonstrated increased uptake. [21]
In a study by Fedi and colleagues involving patients with either cortical dysplasia on MRI or a normal MRI, the investigators identified an increased AMT uptake in 60% of the patients with cortical dysplasia and in 30% of the patients with normal MRI. [22] Juhasz et al reported similar findings. [23]
AMT has also been studied in patients who failed epilepsy surgery, and intracranial EEG was able to identify increased AMT uptake in residual epileptogenic cortex. However, it could only identify the epileptogenic region in 43% of patients. [24]
Serotonin 5-HT1A receptor binding has also been studied with the PET ligands (18F)FCWAY and (11C)WAY. Toczek et al found reduced 5-HT1A binding in the medial and lateral temporal regions ipsilateral to the epileptogenic temporal lobe. [25] Savic and colleagues reported similar findings, but they also reported reduced binding in limbic connections, such as the cingulate cortex and the insula. [26]
Single-Photon Emission Computerized Tomography Scanning
Despite great progress in structural neuroimaging, in most specialized epilepsy centers, the epileptogenic zone remains unlocalized by MRI scanning in approximately 20-50% of patients with medically intractable epilepsy. This problem has stimulated efforts to develop functional neuroimaging techniques that can demonstrate transient physiologic disturbances, not just static structural ones.
SPECT scanning, after the administration of technetium-99m hexamethylpropyleneamine oxime (99m Tc-HMPAO, Ceretec) or (99m Tc-ECD, Neurolite), is a readily available and relatively inexpensive method of measuring regional cerebral blood flow.
The radiotracers are taken up rapidly by the brain during the first pass and, after entering neural cells, are converted rapidly to hydrophilic compounds that are trapped intracellularly and are stable for several hours. Thus, SPECT scanning can provide a semiquantitative image of cerebral blood flow 30-60 seconds after intravenous injection.
SPECT scanning is performed during the ictal period to help delineate the epileptogenic zone. It is particularly helpful in patients with normal MRI findings, as well as in patients with abnormal MRI findings and a nonlocalizing EEG.
Because seizures are associated with increased glucose metabolism (metabolism is closely coupled to cerebral blood flow), ictal SPECT scans show increased perfusion in the region of seizure onset. However, obtaining a true ictal injection is important, particularly for extratemporal lobe seizures, because with late injections, the areas of increased perfusion may represent seizure spread rather than seizure onset.
Obtaining a snapshot of cerebral blood flow during the epileptic seizure (ictal SPECT) and comparing that to the results of an injection when the patient is free of seizures (interictal SPECT scanning) is relatively convenient. An area of increased blood flow during the seizure that demonstrates decreased blood flow during the interictal period is more likely to be the site of seizure onset and correlates highly (approximately 90% sensitivity) with MRI abnormalities.
In TLE, ictal SPECT scanning has 90% sensitivity in localizing seizures, with good interobserver reliability. Ictal increased perfusion is seen in the medial and the lateral temporal lobe (as demonstrated in the image below). In the immediate postictal period (60 seconds), hyperperfusion of the medial temporal lobe with hypoperfusion of the lateral temporal lobe are noted. In the late postictal period (up to 20 minutes postictally), perfusion in the medial and lateral temporal lobes may be decreased.
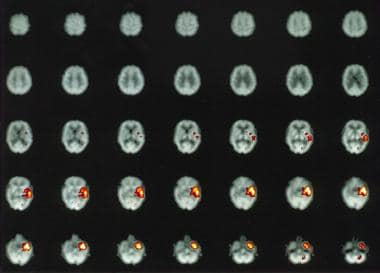 Subtraction ictal single-photon emission computed tomography (SPECT) of a left temporal lobe complex partial seizure showing increased perfusion in the left medial and lateral temporal cortex.
From a practical point of view, however, SPECT scanning adds little useful information with regard to patients who have lesions detected by MRI and localizing or lateralized EEG findings.
In addition, ictal SPECT scanning is not helpful in localizing seizures in patients with bilaterally independent temporal lobe seizures, since the procedure samples only 1 seizure at a time. Moreover, false lateralization with ictal SPECT may occur if the seizure ceases in the temporal lobe of origin while continuing in the contralateral temporal lobe at the time of tracer injection.
For extratemporal lobe seizure, such as frontal and parietal lobe seizures, ictal SPECT has sensitivity as high as 90% in localizing seizures if ictal injection occurs shortly after ictal onset (ie, within 20 s).
Subtraction ictal SPECT scanning coregistered to MRI
The sensitivity of ictal SPECT scanning is increased significantly when ictal and interictal images are subtracted. This subtracted image is then superimposed on high-resolution MRI, which further increases the sensitivity and specificity of the interpretation. Surgical outcomes in patients whose seizure focus is localized with this technique are under study.
In addition, postictal subtraction SPECT scanning coregistered to MRI has been studied as a method of localizing the epileptogenic zone.
Other imaging techniques include statistical parametric mapping in which a control database of interictal SPECT scans are subtracted from the patient's ictal SPECT scan and a z score is generated. This subtraction image is subsequently coregistered to MRI.
A study by Kazemi et al determined that statistical ictal SPECT scanning coregistered to MRI was superior to subtraction ictal SPECT scanning coregistered to MRI for seizure localization before TLE surgery, with greater interrater reliability. (See the image below.) [27]
Magnetic Source Imaging
Magnetoencephalography (MEG) detects the magnetic fields produced by the electrical currents of neuronal activity. Unlike the electrical currents of neuronal activity, which are extracellular, magnetic fields are produced by the intracellular currents of apical dendrites, which are recorded from the scalp by MEG. Unlike conventional EEG that detects radially oriented electrical activity that is attenuated in strength and spatially distorted by tissues between the brain and scalp surface, magnetic fields are minimally affected by intervening tissue layers. Furthermore, MEG measures a subset of neuronal activity that is tangential to the scalp.
These magnetic dipoles generated by MEG are then superimposed on structural MR images, creating magnetic source imaging (MSI). Numerous studies have shown that this technique is helpful in patients with neocortical epilepsies to map interictal epileptiform activity, which in conjunction with other noninvasive structural and imaging data, guide intracranial subdural grid placement to improve surgical outcome.
A large series of 455 patients showed that MSI identified the lobe to be treated in 89% of patients. In all extratemporal cases, MSI identified the correct lobe. One might argue that MSI provides redundant data. However, in this study, MSI provided additional information about the epileptogenic zone in 35% of patients, and it provided crucial information for surgical decision making in 11% of cases. [28]
Thus, MSI is a promising modality for seizure localization in that it can confirm the epileptogenic zone, along with other functional imaging data; aid in the identification of a subtle cortical abnormality on MRI; and provide localizing information not obtainable from other imaging modalities. In this regard, it can either obviate the need for invasive monitoring in cases with a structural lesion without localizing or lateralizing ictal EEG data or guide intracranial subdural electrode placement to improve localization of the epileptogenic zone and improve seizure-free outcome.
Knowlton and colleagues (2008) compared the positive predictive value of MSI with SPECT and PET scanning, using intracranial EEG (ICEEG) localization as the criterion standard. MSI demonstrated a high predictive value for seizures localized by ICEEG. Localization concordance improved with either MSI and PET scanning or MSI and SPECT scanning. [29]
In a second study, Knowlton and colleagues found that MSI conclusively localized epileptiform activity 55% of the time. The odds ratio for predicting a seizure-free surgical outcome was 4.4, but it increased to 9.1 when ictal SPECT scanning, PET scanning, and MSI were used together. [30]
The disadvantage in using MSI is that it is limited to a few centers; it is performed in the outpatient setting in the United States, where antiepileptic drugs cannot always be tapered or discontinued safely; and recording time is limited, which reduces the chance of obtaining sufficient interictal data, with the exception of patients who have frequent interictal activity.
Furthermore, although ictal MSI has been recorded and is highly localizing, the chance of capturing a seizure during a study is small and data can be affected by motion artifact. Some centers partially taper AEDs and/or give clonidine to enhance the yield of identifying interictal epileptiform activity.
MSI is most useful in patients with relatively frequent interictal epileptiform activity.
MRS, fMRI, and Novel Structural MRI Techniques
Proton magnetic resonance spectroscopic imaging
This technique is based on the principle that N -acetyl aspartate (NAA) is found primarily within neurons and precursor cells; a reduction in NAA is usually regarded as indicating loss or dysfunction of neurons.
Creatinine (CR) and choline (Cho) are present in much higher concentrations in glia than in neurons. Patients with TLE have reductions in the NAA/(Cho + CR) ratio. This reduction has been shown to correlate with the presence of hippocampal sclerosis and to correctly lateralize the side of seizure onset in 97% of patients. About 20-40% of patients have bilateral metabolic disturbances, and preliminary evidence suggests that this finding is associated with a higher probability of surgical failure.
Whether this technique is useful in patients with no lesions on MRI, particularly those with extratemporal epilepsy, is less clear. MRS also has been used to measure lactate levels postictally, although its clinical use has yet to be established.
Functional MRI
Functional MRI evaluates cerebral blood flow by looking at the difference between venous oxyhemoglobin and deoxyhemoglobin; this is called the blood oxygen level-dependent (BOLD) contrast technique. During cortical activation, cerebral blood flow to the eloquent cortex increases focally as a response to the stimulus, but oxygen extraction changes little. This results in a relatively increased concentration of oxyhemoglobin and a relatively decreased concentration of deoxyhemoglobin draining the activated cortex.
Deoxyhemoglobin is paramagnetic; it exerts magnetic susceptibility effects on local tissue, which are detected by T2-weighted imaging as decreased signal intensity. Oxyhemoglobin, on the other hand, is diamagnetic and has little effect on T2-weighted images.
Thus, cortical activation results in a relative decrease of the lowered signal intensity produced by the decreased concentration of deoxyhemoglobin, which leads to a relative increase in signal in the activated cortex relative to contiguous cortex.
Functional MRI has been used to map language, motor function, and interictal spikes. It also may be useful for seizure localization and has successfully been used to map simple partial seizures. However, capturing seizures with fMRI is difficult, because seizures are unpredictable and complex partial seizures are usually associated with movement that obscures the fMRI image.
A study by Moeller et al provided support that EEG-fMRI may help to delineate the epileptic focus in patients with nonlesional frontal lobe epilepsy. [31]
Novel structural MRI techniques
Surface-coil MRI and 3D surface rendering may increase the yield in identifying focal areas of cortical thickening. The use of multichannel phased array head coils is preferred over conventional quadrature coils.
Other techniques, such as T1- and T2-weighted inversion recovery, also may increase the sensitivity to identify subtle cortical malformations. Moreover, 3T-phased array (PA) MRI can further increase the signal-to-noise ratio 6-8 fold, as compared with nonphase array coil 1.5T MRI. A study found improved lesion detection with 3T PA MRI in patients with intractable epilepsy. [32]
Preliminary data suggest that 3D preoperative maps of hippocampi can help to predict surgical outcome. However, future studies are needed to determine whether this will be an independent predictor of surgical outcome.
In voxel-based morphometry (VBM), a whole-brain gray matter, voxel-based comparison is made between the patient and the control group. A z-score map is then generated for the patient. This method demonstrates enhanced sensitivity in identifying subtle gray-matter abnormalities and for identifying additional areas of gray-matter abnormalities in patients with focal cortical dysplasia.
Summary and Conclusions
The care of patients with epilepsy, as with that of most other patients with neurologic diseases, has been revolutionized by developments in neuroimaging since the late 20th century. This has led to a far more accurate diagnosis of the pathologic substrate of epilepsy, which is essential for accurate classification, determination of prognosis, and surgical candidacy.
Structural MRI has greatly reduced the need for invasive electroencephalographic evaluation of patients with intractable epilepsy and has therefore reduced morbidity.
Although general consensus exists among neurologists specializing in epilepsy as to when and what type of neuroimaging studies should be performed in patients with epilepsy, these views have not yet been accepted completely by general neurologic and medical practitioners, despite the recommendations of the ILAE (1997). [2]
-
Spoiled gradient recall MRI showing right hippocampal atrophy.
-
Fluid-attenuated inversion recovery (FLAIR) MRI showing increased signal within the left hippocampus.
-
Cortical dysplasia in the lingual gyrus extending anteriorly into the posterior parahippocampal gyrus. Note the thickened cortex and the loss of the gray-white matter interface as compared to the contralateral side.
-
Subtraction ictal single-photon emission computed tomography (SPECT) of a left temporal lobe complex partial seizure showing increased perfusion in the left medial and lateral temporal cortex.
-
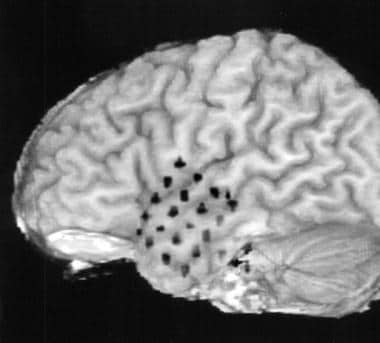
Co-registration of subdural grid electrodes to the preoperative MRI.
Tables

What would you like to print?
- Overview
- Epilepsy Protocol MRI
- Evaluation of a First Seizure
- MRI of the Temporal Lobe
- Classification of Malformations of Cortical Development
- MRI of Malformations of Cortical Development
- MRI of Neoplasms Associated With Epilepsy
- MRI of Vascular Malformations
- Diffusion Tensor Imaging
- Positron Emission Tomography Scanning
- Single-Photon Emission Computerized Tomography Scanning
- Magnetic Source Imaging
- MRS, fMRI, and Novel Structural MRI Techniques
- Summary and Conclusions
- Show All
- Media Gallery
- References