Spirometry
Description
Spirometry assesses the integrated mechanical function of the lung, chest wall, respiratory muscles, and airways by measuring the total volume of air exhaled from a full lung (total lung capacity [TLC]) to maximal expiration (residual volume [RV]). This volume, the forced vital capacity (FVC) and the forced expiratory volume in the first second of the forceful exhalation (FEV1), should be repeatable to within 0.15 L upon repeat efforts in the same measurement unless the largest value for either parameter is less than 1 L. In this case, the expected repeatability is to within 0.1 L of the largest value. The patient is instructed to inhale as much as possible and then exhale rapidly and forcefully for as long as flow can be maintained. The patient should exhale until one of the criteria defining the end of a forced exhalation has been reached. At the end of the forced exhalation, the patient should again inhale fully as rapidly as possible. The FVC should then be compared with that inhaled volume to verify that the forced expiratory maneuver did start from full inflation.
Reduction in FEV1 may reflect reduction in the maximum inflation of the lungs (TLC); obstruction of the airways; respiratory muscle weakness; or submaximal expiratory force due to poor coaching, poor understanding, or malingering. Airway obstruction is the most common cause of reduction in FEV1. Airway obstruction may be secondary to bronchospasm, airway inflammation, loss of lung elastic recoil, increased secretions in the airway, or any combination of these causes. Response of FEV1 to inhaled bronchodilators is used to assess the reversibility of airway obstruction, although it is now widely appreciated that a response showing a lack of a significant increase in FEV1 does not indicate the patient will not benefit clinically from bronchodilator therapy. A significant increase in the inspiratory capacity (IC) and/or vital capacity (VC) after bronchodilator therapy can occur even when the FEV1 fails to show a significant change. [1]
The standards used to describe the quality of spirometry measurements are from the Standardization of Spirometry 2019 Update. [2] This document provides examples of the most common technical problems associated with spirometry testing. See Standardization of Spirometry 2019 Update. An Official American Thoracic Society and European Respiratory Society Technical Statement for more information.
Indications
Spirometry is used to establish baseline lung function, evaluate dyspnea, detect pulmonary disease, monitor effects of therapies used to treat respiratory disease, evaluate respiratory impairment or disability, evaluate operative risk, and perform surveillance for occupational-related lung disease. It may also be used in research and clinical trials and epidemiological surveys.
Contraindications
Relative contraindications (no absolute contraindications) for spirometry are as follows:
-
Conditions that may be negatively impacted by the increases in myocardial demand or changes in blood pressure associated with spirometry: These include recent (< 1 week) myocardial infarction, systemic hypotension or severe hypertension, significant atrial/ventricular arrhythmia, noncompensated heart failure, uncontrolled pulmonary hypertension, acute cor pulmonale, clinically unstable pulmonary embolism, and a history of syncope associated with forced exhalation.
-
Conditions that may be negatively impacted by the increase in intracranial/intraocular pressure associated with spirometry: These include cerebral aneurysm, recent (< 4 weeks) brain surgery, recent concussion with continuing symptoms, and recent (within 1 week) eye surgery.
-
Conditions that may be negatively impacted by increased sinus and middle ear pressures: Examples include recent (< 1 week) sinus or middle ear surgery or infections.
-
Conditions that may be negatively impacted by increased intrathoracic and intraabdominal pressures: Examples include the presence of pneumothorax, recent (< 4 weeks) thoracic or abdominal surgery, and late-term pregnancy.
-
Infection control issues, including active or suspected transmissible respiratory or systemic infections including tuberculosis, or physical conditions predisposing to transmission of infections such as hemoptysis, significant secretions or oral lesions or bleeding
Patient care/preparations
Two choices are available with respect to bronchodilator and medication use prior to testing. Patients may withhold oral and inhaled bronchodilators to establish baseline lung function and evaluate maximum bronchodilator response, or they may continue taking medication as prescribed. If medications are withheld, a risk of exacerbation of bronchial spasm exists.
Interpretation
Interpretation of spirometry results should begin with an assessment of test quality. Failure to meet performance standards can result in unreliable test results (see the image below). The American Thoracic Society (ATS) defines acceptable spirometry as an expiratory effort that has the following characteristics:
Pulmonary function tests require patients to successfully perform respiratory maneuvers in a standardized manner in order to obtain clinically meaningful results. Spirometry is perhaps the most technically and physically demanding. The patient is required to inhale as fully as possible, exhale with as much force as possible, and continue their expiratory effort until they empty their lungs as completely as possible or are unable to continue.
The performance standards for acceptable spirometry are summarized below. The comments of the technologist administering the test can assist the interpreting physician in determining if results of a testing session that fail to meet some of the standards can still provide clinically useful data.
Table 1. Summary of Acceptability, Usability, and Repeatability Criteria for FEV1 and FVC (Open Table in a new window)
Acceptability and Usability |
Required for Acceptability |
Required for Usability |
||
Criterion |
FEV 1 |
FVC |
FEV 1 |
FVC |
Must have back extrapolated volume ≤5% of FVC or 0.100 L, whichever is greater |
+ |
+ |
+ |
+ |
Must have no evidence of a faulty zero-flow setting |
+ |
+ |
+ |
+ |
Must have no cough in the first second of expirationa |
+ |
- |
+ |
- |
Must have no glottis closure in the first second of expirationa |
+ |
+ |
+ |
+ |
Must have no glottis closure after 1 s of expiration |
- |
+ |
- |
- |
Must achieve one of these three end of forced expiration indicators:
|
- |
+ |
- |
- |
Must have no evidence of obstructed mouthpiece or spirometer |
+ |
+ |
- |
- |
Must have no evidence of a leak |
+ |
+ |
- |
- |
If the maximal inspiration following end of forced expiration is >FVC, then FIVC – FVC must be ≤ 0.100 L or 5% of FVC, whichever is greaterc |
+ |
+ |
- |
- |
Repeatability Criteria (applied to acceptable FVC and FEV1 values) |
||||
Age >6 y: Difference between two largest FVC values must be ≤0.150 L, and the difference between two largest FEV1 values must be ≤0.150 L |
||||
Age ≤6 y: Difference between two largest FVC values must be ≤0.100 L or 10% of the highest value, whichever is greater, and the difference between two largest FEV1 values must be ≤0.100 L or 10% of the highest value, whichever is greater |
||||
aFor children ≤6 y, must have at least 0.75 s of expiration without glottis closure or cough for acceptable or useable measurement of FEV0.75. bOccurs when the patient cannot expire long enough to achieve a plateau (eg, children with high elastic recoil or patients with restrictive lung disease) or the patient inspires or comes off the mouthpiece before a plateau. For within-maneuver acceptability, the FVC must be larger than or within the repeatability tolerance of the largest FVC observed before this maneuver within the current prebronchodilator or the current postbronchodilator testing set. cAlthough the performance of a maximal forced inspiration is strongly recommended, its absence does not preclude a maneuver from being judged acceptable, unless extrathoracic obstruction is specifically being investigated. |
||||
Table 2. Quality Categories for FVC or FEV1 in Adults and Children (Open Table in a new window)
Grade |
Criteria for Adults, Older Children, and Children Aged 2-6 Years |
A |
> 3 acceptable efforts with repeatability within 0.150 L for age 2-6 y, 0.100 L, or 10% of highest value, whichever is greater |
B |
2 acceptable efforts with repeatability within 0.150 L for age 2-6 y, 0.100 L, or 10% of highest value, whichever is greater |
C |
> 2 acceptable efforts with repeatability within 0.200 L for age 2-6 y, 0.150 L, or 10% of highest value, whichever is greater |
D |
> 2 acceptable efforts with repeatability within 0.250 L for age 2-6 y, 0.200 L, or 10% of highest value, whichever is greater |
E |
One acceptable effort |
F |
No acceptable efforts |
Note that FEV1 and FVC each are graded separately.
Characteristics of acceptable spirometry efforts are as follows:
-
The patient is vigorously coached to inspire rapidly to full inflation.
-
The patient shows minimal hesitation at the start of the forced expiration (extrapolated volume < 5% of FVC or 0.10 L, whichever is larger).
-
The patients shows an explosive start of the forced exhalation (rise time to peak flow no greater than 0.150 s). Rise time to peak flow is not available on all spirometers. If it not available, it is not part of the assessment of the acceptability of the start of the forced exhalation.
-
The patient shows no evidence of cough or artifact in the first second of forced exhalation.
-
The results meets one of three criteria that define a valid end-of-forced exhalation: (1) smooth curvilinear rise of the volume-time tracing to a plateau (plateau defined as < 0.025 L volume change in the last 1 s of expiration) of at least 1 second's duration; (2) if a forced test fails to exhibit an expiratory plateau, a forced expiratory time of 15 seconds; or (3) the FVC is within the repeatability tolerance of or is greater than the largest prior observed FVC.
-
Upon completing the forced exhalation, the patient is coached to rapidly (> 2 L/s flow) inhale to full inflation upon completing the forced exhalation providing a value for forced inspiratory vital capacity (FIVC). The maximum FIVC can be no more than 0.100 L or 5% of the FVC larger than the FVC (whichever is greater). If the maximum FIVC is more than 0.100 L or 5% of the FVC larger than the FVC, that effort is not acceptable and cannot be used for reporting of any parameters.
-
Repeatability of the largest FVC and FEV 1 within 0.150 L (within 0.100 L if age < 6 y) is demonstrated in at least two efforts.
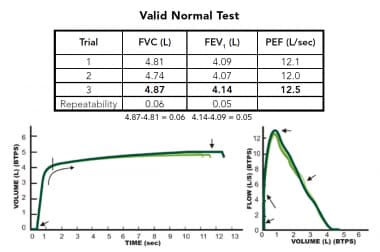 Example of an acceptable spirometry testing session showing evidence 3 efforts that show evidence of an explosive start of forced exhalation that continues until empty and good repeatability of forced vital capacity (FVC) and forced expiratory volume in the first second of the forceful exhalation (FEV1), which usually indicates all efforts started from full inflation.
Comprehensive treatment of technical acceptability of spirometry test results is beyond the scope of this review. Readers are directed to Spirometry Quality Assurance: Common Errors and Their Impact on Test Results. A booklet can also be obtained from the Department of Health and Human Services. It provides examples of common spirometry performance errors and their impact on test results.
In patients that have significant loss of lung elastic recoil (pulmonary emphysema, COPD), spirometry may show negative effort dependence of forced expiratory flow. The effort that has the highest peak expiratory effort may produce a lower FEV1 because of the dynamic compression of the airways that results from the loss of elastic recoil support of airways that is characteristic of emphysema. In this circumstance, reporting the highest FEV1 coming from an effort with submaximal expiratory effort can lead to confusing results, particularly if a setting of assessing spirometric response to bronchodilators. Although not yet a spirometry acceptability standard, it appears that when reporting the FEV1 considering only efforts that have a time to peak flow (TPEF) less than or equal to 0.12 seconds helps eliminate this effect. This parameter can be displayed on most laboratory-based spirometry testing systems.
Inspection of the volume-time tracing aids in identification of early termination of expiration by evaluating the presence of an expiratory plateau. In the absence of an expiratory plateau, a 15-second expiratory time ensures the quality of the FVC. Inspection of the start of the volume-time tracing can help identify a hesitant start, which can result in a falsely low FEV1. Repeatability of the FVC and the FEV1 helps ensure that the results truly represent the patient's lung function. Attention should be focused on the repeatability of two key parameters: FVC and FEV1. It should be noted that while repeatability of the FVC and FEV1 strengthens the confidence that the forced exhalations started from full inflation, it is possible to demonstrate repeatability of these parameters even when forced exhalations start from a lung volume below full inflation. Demonstration that the difference between the largest FIVC and the FVC is no more than the larger of 0.100 L or 5% of the largest FIVC is a key acceptability criterion.
The reference equations published in 2012 by the Global Lung Initiative (GLI), a Task Force of the European Respiratory Society, provide normative values for males and females from age 3 to 95 years across a wide range of ethnicities, [3] and these should be used as the default set of reference values for spirometry. The use of these predicted values for spirometry has been supported globally, including endorsements from the European Respiratory Society, the ATS, the American College of Chest Physicians, the Thoracic Society of Australia and New Zealand, the Australian and New Zealand Society of Respiratory Science, and the Asian Pacific Society for Respirology. The report is in accordance with the previously published recommendations of the ATS that called for the elimination of a fixed percent of predicted cut point to determine normality and a fixed lower limit of normal of the FEV1/FVC ratio to identify airway obstruction, both of which have been shown to result in significant misclassification of spirometry results. [2] Guidelines for a standardized report format have been published and should be the default report format. The use of Z scores to determine severity of spirometric abnormalities is encouraged.
Abnormalities can be classified by the physiologic patterns outlined below.
Obstructive defects
Disproportionate reduction in the FEV1 as compared with the FVC is reflected in the FEV1/FVC ratio and is the hallmark of obstructive lung diseases. This physiologic category of lung diseases includes but is not limited to asthma, acute and chronic bronchitis, emphysema, bronchiectasis, cystic fibrosis, and bronchiolitis. The forced expiratory flow at any given lung volume is reduced. The mechanism responsible for the reduction in airflow can be bronchial spasm, airway inflammation, increased intraluminal secretions, and/or reduction in parenchymal support of the airways due to loss of lung elastic recoil. Poor understanding and effort on the part of the patient is also a cause for reduced flows, and the diagnosis of airway obstruction should be limited to measurements composed of acceptable efforts demonstrating repeatability of FVC and FEV1.
The use of a fixed lower limit of normal for the FEV1/FVC ratio as proposed by the Global Initiative for Obstructive Lung Disease (GOLD) lacks a scientific basis and results in significant misclassification of patients at either end of the age spectrum. Young patients are classified as "normal" when airflow obstruction is present, and older patients are classified as showing obstruction when no airflow obstruction is present. The use of the GOLD threshold for identifying airway obstruction should be discouraged in clinical practice where or when computerized predicted values are available.
The recommended practice for identifying a spirometric abnormality is to use the predicted lower limit of normal for that individual based on the sex, age, height, and ethnicity. The GLI reference equations provide lower limits of normal for spirometric parameters.
Assessment of reversibility of airway obstruction
When airway obstruction is identified on spirometry, assessing response to inhaled bronchodilators is useful. The ATS has recommended that the threshold for significant response be demonstration of an increase of at least 12% and 0.2 L in either FVC (provided the expiratory time for both sessions agree within 10%) or FEV1 on a spirogram performed 10-15 minutes after inhalation of a therapeutic dose of a bronchodilating agent. New standards recommend the use of four inhalations (100 mcg each, 400 mcg total dose) of albuterol administered through a valved spacer device. When concern about tremor or heart rate exists, lower doses may be used. Response to an anticholinergic drug may be assessed 30 minutes after four inhalations (40 mcg each, 160 mcg total dose) of ipratropium bromide. Failure to respond to bronchodilator challenge does not preclude clinical benefit from bronchodilators. A positive response to the bronchodilators may correlate with response to steroid therapy.
Restrictive defects
Reduction in the FVC with a normal or elevated FEV1-to-FVC ratio should trigger further evaluation of total lung capacity (TLC) to rule out restrictive lung disease. Measuring the TLC and residual volume (RV) can confirm restriction suggested by spirometry (see Lung Volume Determination below). See the chart below.
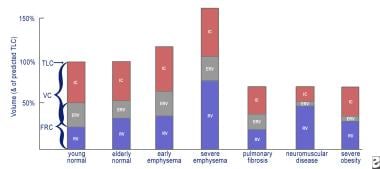 This is a graph of lung volumes in health and in disease, showing the various lung subdivisions. Normal aging results in an increase in functional reserve capacity (FRC) and residual volume (RV) and a normal total lung capacity (TLC) percentage. Obstructive lung diseases cause hyperinflation (increase in RV and FRC) with a relatively normal forced vital capacity (FVC). In severe emphysema, the TLC percentage can exceed 150%, with the RV impinging on the FVC. Restrictive lung diseases exhibit reduced TLC percentage with relative preservation of the RV/TLC percentage in fibrosis, a reduced inspiratory capacity and expiratory reserve volume (ERV) in neuromuscular disease, and severe reduction of the ERV in extreme obesity.
Quantification of impairment by spirometry
In normal spirometry, FVC, FEV1, and FEV1 -to-FVC ratio are above the lower limit of normal. The lower limit of normal is defined as the result of the mean predicted value (based on the patient's sex, age, and height) minus 1.64 times the standard error of the estimate from the population study on which the reference equation is based. If the lower limit of normal is not available, the FVC and FEV1 should be greater than or equal to 80% of predicted, and the FEV1 -to-FVC ratio should be no more than 8-9 absolute percentage points below the predicted ratio. The ATS has recommended the use of lower limits of normal instead of the 80% of predicted for setting the threshold that defines abnormal test results.
A reduced FVC on spirometry in the absence of a reduced FEV1/FVC ratio suggests a restrictive ventilatory problem. An inappropriately shortened exhalation during spirometry can (and often does) result in an artifactually reduced FVC. Causes of restriction on spirometry include obesity, cardiomegaly, ascites, pregnancy, pleural effusion, pleural tumors, kyphoscoliosis, pulmonary fibrosis, neuromuscular disease, diaphragm weakness or paralysis, space-occupying lesions, lung resection, congestive heart failure, inadequate inspiration or expiration secondary to pain, and severe obstructive lung disease. One scheme for describing the severity of reductions in the FVC and/or the FEV1 is shown below:
-
Mild - Greater than 70% of predicted
-
Moderate - 60-69% of predicted
-
Moderately severe - 50-59%
-
Severe - 35-49% of predicted
-
Very severe - Less than 35% of predicted
The lower limit of normal for the FEF25-75% can be less than 50% of the mean predicted value, making it important to use the lower limit of normal defined by the 95% confidence limit of the mean predicted value rather than a threshold defined by a fixed percentage of the predicted value. The FEF25-75% is also very dependent on expiratory time. If expiratory times of spirometry efforts vary by more than 10%, comparisons of the FEF25-75% before and after bronchodilator challenge are difficult to interpret. Early termination of expiration shifts the middle 50% of the exhaled volume toward the start of the exhalation, artifactually raising the FEF25-75%. For these reasons, the use of the FEF25-75% to assess airway function in adults is discouraged.
The FVC is a reliable means of assessing the clinical status in idiopathic pulmonary fibrosis (IPF). A minimum clinically important difference of the FVC, expressed as a percentage of the mean predicted normal value, of 2-6% of has been established. This obviates the need to obtain a total lung capacity (TLC) measurement to assess disease progression or the effects of medical therapy.
Special assessments
Sitting versus supine vital capacity
Evaluation of diaphragm strength can be accomplished by measuring the vital capacity in an upright or sitting position followed by a measurement made in the supine position. A reduction in the vital capacity to less than 90% of the upright vital capacity suggests diaphragm weakness or paralysis. Interpreting an increased reduction in vital capacity in the supine position as diaphragm dysfunction should be made cautiously if the patient's body mass index is greater than 45 kg/m2. [4] Studies reporting the normal reduction of the vital capacity of less than 10% from upright to supine were conducted with individuals who were not obese. Slightly greater reductions in obese individuals in a supine position may not indicate diaphragm dysfunction, but rather an increase in the resistive forces against which the diaphragm descends. Reductions in the supine vital capacity more than 20% of baseline indicate hemidiaphragm or diaphragm dysfunction or paralysis.
Identifying central airway obstructions
The configuration of the flow-volume curve of a properly performed spirometry test can be used to demonstrate various abnormalities of the larger central airways (larynx, trachea, right and left mainstem bronchi). Three patterns of flow-volume abnormalities can be detected: (1) variable intrathoracic obstructions, (2) variable extrathoracic obstructions, and (3) fixed upper airway obstructions. Reproducing these findings on every effort is important because spurious nonreproducible reductions in inspiratory flow are not uncommon after completion of forced expirations in subjects without upper airway obstruction. Examples of variable intrathoracic obstruction include localized tumors of the lower trachea or mainstem bronchus, tracheomalacia, and airway changes associated with polychondritis.
Variable upper airway obstructions demonstrate flow reductions that vary with the phase of forced respirations. Variable intrathoracic obstructions demonstrate reduction of airflow during forced expirations with preservation of a normal inspiratory flow configuration. This is observed as a plateau across a broad volume range on the expired flow limb of the flow-volume curve. The reduction in airflow results from a narrowing of the airway inside the thorax, in part because of a narrowing or collapse of the airway secondary to extraluminal pressures exceeding intraluminal pressures during expiration.
Variable extrathoracic obstructions demonstrate reduction of inspired flows during forced inspirations with preservation of expiratory flows. Again, the major cause of the reduced flow during inspiration is airway narrowing secondary to extraluminal pressures exceeding intraluminal pressures during inspiration. Causes of this type of upper airway obstruction include unilateral and bilateral vocal cord paralysis, vocal cord adhesions, vocal cord constriction, laryngeal edema, and upper airway narrowing associated with obstructive sleep apnea.
Fixed upper airway obstructions demonstrate plateaus of flow during both forced inspiration and forced expiration. Causes of fixed upper airway obstruction include goiters, endotracheal neoplasms, stenosis of both main bronchi, postintubation stenosis, and performance of the test through a tracheostomy tube or other fixed orifice device. (See the image below.)
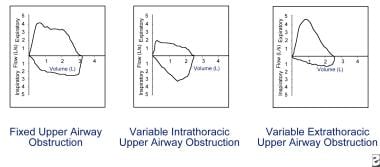 Flow reduction must be consistent on every effort to be considered actual flow limitation. Fixed upper airway obstruction may be caused by postintubation stenosis, goiter, endotracheal neoplasms, and bronchial stenosis. Variable intrathoracic obstruction may be caused by tracheomalacia, polychondritis, and tumors of the lower trachea or main bronchus. Variable extrathoracic obstruction may be caused by bilateral and unilateral vocal cord paralysis, vocal cord constriction, reduced pharyngeal cross-sectional area, and airway burns.
Assessment of operative risk
While no single test can effectively predict intraoperative and postoperative morbidity and mortality from pulmonary complications, the FEV1 obtained from good quality spirometry is a useful tool. When the FEV1 is greater than 2 L or 50% of predicted, major complications are rare.
Operative risk is heavily dependent on the surgical site, with chest surgery having the highest risk for postoperative complications, followed by upper and lower abdominal sites. Patient-related factors associated with increased operative risk for pulmonary complications include preexisting pulmonary disease, cardiovascular disease, pulmonary hypertension, dyspnea upon exertion, heavy smoking history, respiratory infection, cough (particularly productive cough), advanced age (>70 y), malnutrition, general debilitation, obesity, and prolonged surgery.
Assessment for lung surgery typically involves prediction of a postoperative FEV1 by using the preoperative FEV1. In a borderline case, consideration of the contribution of the remaining portions can be assessed by a perfusion scan. The relative percentage of perfusion (Q) of the remaining lung or lung segments usually is proportional to its contribution to ventilation and can be used to estimate postoperative function as shown in the following equation:
Postoperative FEV1 = Preoperative FEV1 × Q% of the remaining lung
For example, if the preoperative FEV1 is 1.6 L and the lung to be resected demonstrates 40% perfusion, the postoperative FEV1 would be 1.6 × 0.6 = 0.96 L. An estimated postoperative FEV1 of less than 0.8 L often is associated with chronic respiratory failure and may indicate an unacceptable degree of operative risk. Arterial blood gases (ABGs) and cardiopulmonary exercise testing may help evaluate operative risk in patients who have a preoperative FEV1 below 2 L or 50% of predicted.
The algorithm for clearance of candidates for lung resection proposed by Bolinger and Perruchoud [5] has been successfully evaluated in 137 consecutive patients who were referred for resection by Wyser et al [6] with an overall mortality of 1.5% and is detailed in Cardiopulmonary Stress Testing. Patients with a negative cardiac history and ECG that demonstrate an FEV1 and a diffusing capacity of lung for carbon monoxide (DLCO) that are greater than 80% of predicted are judged to be able to undergo pneumonectomy safely.
Technical considerations
The ATS has published guidelines for a standardized technique that includes spirometer performance standards. A reasonable end-point for the maneuver in the absence of true flow cessation (ie, airway obstruction is present) is 15 seconds. Patients often discontinue the forced exhalation prematurely because of the discomfort of prolonged forced exhalation. A modified technique in which the patient exhales with maximum force for four seconds followed by continued relaxed exhalation has been shown to enhance the patient's ability to sustain expiration, thereby yielding a larger FVC in patients with airflow obstruction. It should be noted that, strictly speaking, the FVC obtained from using this technique is not a true FVC because maximum expiratory effort was not sustained during the entire exhalation.
Lung Volume Determination
Synonyms
Functional reserve capacity (FRC), helium dilution lung volumes, nitrogen washout lung volumes, static lung volumes, lung subdivisions
Indications
Lung volume determinations are used in the evaluation of suspected restrictive lung disease and the evaluation of hyperinflation.
Contraindications
Inability to follow instructions is a contraindication. Patients with claustrophobia may not tolerate being closed into a confined space (body plethysmograph), but anxiety can often be overcome with good instruction and coaching.
Patient care/preparations
Use of supplemental oxygen just prior to a nitrogen washout test may cause underestimation of FRC unless the initial exhaled nitrogen is considered in the calculations. Supplemental oxygen should be discontinued for at least 10 minutes before starting a nitrogen washout test. Duplicate measurements of FRC by either gas dilution technique should be delayed until a posttest interval is equivalent to 1.5 times the equilibration time to eliminate the effects of residual oxygen or helium.
Test
Lung volumes provide useful information that confirms the presence of restrictive lung disease suggested by a low vital capacity on a spirometry test. Hyperinflation, elevation of the RV and TLC can be demonstrated by this test. The test is dependent first on an accurate measurement of the volume of gas in the lungs at a resting end-expiration, known as the FRC, which represents the balance of the elastic recoil properties of the lung and the chest wall.
FRC can be measured by one of three techniques, inert gas dilution, nitrogen washout, or whole-body plethysmography. Both gas dilution techniques are subject to error by leaks at the mouthpiece or nose clip or, occasionally, even small leaks from the eardrum. When measured by whole-body plethysmography, resting end-expiratory volume is known as the FRCpleth and will include the volume of gas contained in noncommunicating spaces such as blebs or bullae that the FRC measured by gas dilution techniques will not measure. In addition to this advantage, body plethysmography allows multiple determinations of lung volumes to be made rapidly.
When measured by inert gas dilution or nitrogen washout, premature termination of the procedure before adequate demonstration of equilibrium or washout results in underestimation of FRC, RV, and TLC. Repeat measurements should allow a recovery period of 1.5 times the wash-in or wash-out time to prevent residual helium or oxygen from affecting the new measurement. Body plethysmography is performed rapidly, allowing multiple determinations in minutes. Ideally, each measurement of lung subdivisions should be linked to each FRC or ITGV measurement (patient should remain on the mouthpiece).
Two types of errors are known to occur with body plethysmography techniques. One involves the underestimation of mouth pressure swings during respiratory efforts when the airway is occluded. The assumption that when no airflow is present the mouth pressures accurately reflect alveolar pressure has been shown to be not true when respiratory efforts occur at a frequency of greater than 1 Hz (respiratory rate of 60 breaths per minute). Thus, FRCpleth is overestimated if the frequency of the respiratory effort is not kept between 0.5 and 1.0 Hz (30-60 breaths/min) during shutter closure.
The second type of measurement error using body plethysmography involves trying to pace the patient's tidal breathing before shutter closure. The ideal respiratory rate during shutter closure is far in excess of the patient's resting respiratory rate and causes dynamic hyperinflation, increasing the lung volume above the resting lung volume. Patients should breathe at a relaxed spontaneous respiratory rate without coaching before shutter closure.
Results
All lung volumes are expressed in liters to the nearest hundredth of a liter. FRC is the volume of gas in the lungs at the end of an average resting expiration. It is comprised of the expiratory reserve volume (ERV), the volume of gas that can be voluntarily exhaled beyond the FRC or ITGV, and the RV. The TLC then can be calculated by adding the RV to the vital capacity (VC). RV also is expressed as a fraction of the TLC, the RV-to-TLC ratio (see the image below). The expected repeatability of three repeated same-session measurements of FRC is ± 5%. The standards for expected repeatability of other parameters (RV, IC, TLC) have not been set, but the expected repeatability of the VC is the same as FVC, ≤ 0.15 L difference between the two largest.
This is a graph of lung volumes in health and in disease, showing the various lung subdivisions. Normal aging results in an increase in functional reserve capacity (FRC) and residual volume (RV) and a normal total lung capacity (TLC) percentage. Obstructive lung diseases cause hyperinflation (increase in RV and FRC) with a relatively normal forced vital capacity (FVC). In severe emphysema, the TLC percentage can exceed 150%, with the RV impinging on the FVC. Restrictive lung diseases exhibit reduced TLC percentage with relative preservation of the RV/TLC percentage in fibrosis, a reduced inspiratory capacity and expiratory reserve volume (ERV) in neuromuscular disease, and severe reduction of the ERV in extreme obesity.
Interpretation
Obstructive lung diseases, particularly emphysema, result in an increase in the RV and RV-to-TLC ratio. In severe emphysema, particularly bullous emphysema, the TLC can show a marked increase. Bronchial spasm, airway inflammation, excessive secretions in the airway, and loss of lung elastic recoil increase airways resistance and result in an insidious progressive increase in the end-expiratory lung volume that results in chronic hyperinflation (elevated RV, TLC, and RV-to-TLC ratio). Other pulmonary causes of increased RV include pulmonary vascular congestion and mitral stenosis. Extrapulmonic causes of increased RV include expiratory muscle weakness as observed in spinal cord injuries and myopathies.
Increased body weight due to increased fat causes an increase in chest wall elastic recoil, which favors a lower end-expiratory lung volume, resulting in less hyperinflation for any degree of airflow obstruction.
Lung volumes can confirm the presence of restriction when a reduced vital capacity is seen on spirometry. A reduced TLC is the hallmark of restrictive lung disease. An isolated reduction of the residual volume may be an early sign of restrictive lung disease. Pulmonary processes that can reduce the TLC include interstitial lung disease, atelectasis, pneumothorax, pneumonectomy, consolidation, edema, and fibrosis. Extrapulmonary causes of restriction include obesity, respiratory muscle weakness, thoracic deformities, and disease of the pleura.
Diffusing Capacity of Lung for Carbon Monoxide
Synonyms
Transfer factor of the lung for carbon monoxide (TLCO, mmol/min/kilopascal, commonly used in Europe); DLCO, diffusing capacity of lung for carbon monoxide (DL, mL/min/mmHg); transfer coefficient of the lung for carbon monoxide (KCO); and alveolar volume (VA, L), which is the single-breath estimate of the TLC determined by the dilution of the tracer gas concentration. The term KCO should be used instead of the term DLCO/VA, which incorrectly implies that the DLCO is being corrected for lung volume.
Contraindications
Inability to follow instructions is a contraindication to a DLCO test (CPT code 94729). Patients should be alert, oriented, able to exhale completely and inhale to total lung capacity, able to maintain an airtight seal on a mouthpiece, and able to hold a large breath for 10 seconds.
Patient care/preparations
Refrain from smoking for several hours before the test. Alcohol vapors can affect the accuracy of some fuel cell types of CO analyzers, thus alcoholic beverages should be withheld for eight hours.
Test
DLCO, also known as the TLCO, is a measurement of the conductance or ease of transfer for CO molecules from alveolar gas to the hemoglobin of the red blood cells in the pulmonary circulation. It often is helpful for evaluating the presence of possible parenchymal lung disease when spirometry and/or lung volume determinations suggest a reduced vital capacity, RV, and/or TLC. It should be noted that different units of measure exist worldwide. In the United States, the test is known as the DLCO and the units of measure are mL/min/mm Hg (traditional unit of measure). In contrast, the test is also known as the TLCO and the units of measure are mmol/min/kPa (International System of Units or SI units). The conversion from SI units (mmol/min/kPa) to traditional (mL/min/mm Hg) can be done by multiplying the SI value by 2.987.
Recommendations for a standard technique for the test were first published by the American Thoracic Society (ATS) in 1995. A joint task force from the ATS and the European Respiratory Society (ERS) published updated standards in 2017. [7] The updated standards include some important changes in the criteria used to determine the technical acceptability and expected repeatability of measurements, as well as recommendations on the increased utility of the procedure when rapid-responding gas analyzer (RGA) technology is used. RGA technology has been available for over a decade and most commercial equipment currently sold uses the RGA technology. It is likely that most of the slower-responding analyzer technology will phased out by equipment replacement over the coming decade.
Most pulmonary laboratories perform this test by the single-breath technique (DLCO SB) because it is quicker to perform and more reproducible than other techniques. Other techniques, such as the rebreathing technique, are not commonly available and are not described here. In the single-breath technique, the subject exhales to RV and then inspires the test gas (tracer gas, [commonly either 10% helium or 0.3% methane], 0.3% CO, 21% oxygen, and balance nitrogen) briskly to TLC. This vital capacity–size breath is held for 10 seconds and then exhaled either into a sample bag (discrete sampling) or past a sampling port leading to rapid-response analyzers after an initial discard of 0.75-1 L of the exhalate to minimize the contribution of dead space gas (mouthpiece, filter, measuring equipment, and anatomical areas where no gas exchange is expected) to the gas sample that will be analyzed to estimate uptake of CO by the alveolar capillaries. The grab sample (0.75-1 L) then is analyzed for tracer gas and CO. The dilution of the tracer gas in the vital capacity–size breath of test gas by the patient's RV provides both a means to estimate the initial alveolar concentration of CO and to estimate the patient's lung volume at full inflation. The rate of diffusion of the CO can be estimated by the change from this initial alveolar concentration to that of the expired grab sample. This change in the CO concentration is then multiplied by the single-breath estimate of TLC to calculate the diffusing capacity. Abnormal hemoglobin (Hb) levels can affect the diffusing capacity and, if known, should be used to mathematically correct the measured diffusing capacity to what it would be if the patient’s hemoglobin was normal. Although it has been recommended that the predicted value be adjusted for hemoglobin, [7, 8] providing an estimate of what the patient’s expected DLCO should be given their hemoglobin level, equipment manufacturers have been slow to offer this accommodation in the testing software and the older practice of adjusting the patient’s measured DLCO to what it would be if their hemoglobin was normal is still quite common. Both methods are presented below. Both methods yield identical values when the measured values are compared with the predicted values and expressed as a percentage of the predicted value. Regardless of whether the measured or predicted values are adjusted, both adjusted and unadjusted values should be displayed on the final report, along with the measured hemoglobin (and date of hemoglobin determination).
Adjusting the patient’s measured DLCO value for the measured hemoglobin (not currently recommended but still commonly used) is as follows:
-
Adolescent males and men: Hb adjusted DLCO (DLCOc) = measured DLCO ([10.22 + Hb g/dL]/[1.7 Hb])
-
Children younger than 15 years and women: Hb adjusted DLCO (DLCOc) = measured DLCO ([9.38 + Hb g/dL]/[1.7 Hb])
Adjusting the predicted DLCO (and lower limit of normal) for the patient’s measured hemoglobin (currently recommended) is as follows:
-
Adolescent males and men: DLCO (predicted for Hb) = DLCO (predicted) x (1.7 Hb/(10.22 + Hb))
-
Children younger than 15 years and women: DLCO (predicted for Hb) = DLCO (predicted) x (1.7 Hb/(9.38 + Hb))
Other factors have been shown to impact the measured DLCO, such as elevated blood carboxyhemoglobin (COHb) and barometric pressure. The impact of an elevated carboxyhemoglobin is twofold: (1) it reduces the alveolar-capillary pressure gradient for CO and (2) acts as a virtual anemia by holding onto sites on the hemoglobin molecule that could be used for binding CO (or oxygen). The net effect is a 2% decrease in DLCO for each 1% increase in COHb. RGA systems can measure the CO in the patient’s exhaled breath just prior to inhalation of the DLCO test gas and compensate for elevated CO by subtracting the estimated CO back-pressure from both the initial and final alveolar carbon monoxide partial pressures. This compensates for the reduced alveolar-capillary pressure gradient but does not compensate for the anemia effect. The 2017 DLCO standards paper shows a formula that also adjusts for the anemia effect, but this is not currently in use on most PFT systems.
The current recommendation is to correct the measured DLCO for barometric pressure. As barometric pressure falls, so does the partial pressure of inspired oxygen (PIO2) and DLCO increases. The typical variation in DLCO expected from atmospheric pressure fluctuation at a given altitude is +1.5%. Laboratories at higher altitude can produce higher values; the expected change is approximately 0.5% for each 100-meter increase in altitude. This adjustment can only be made if the barometric pressure is made or updated in the measuring system on a daily basis.
Quality grading for DLCO maneuvers
The 2017 ATS/ERS DLCO standards paper specified changes to the acceptability and repeatability standards used to determine technical acceptability. [7] It also proposed a quality control grading system that acknowledges that test results from efforts that fail to meet all of the acceptability criteria may still provide clinically useful data.
The 2017 criteria for acceptability of DLCO efforts are as follows:
-
VI (inspired volume of test gas) greater than 90% of the largest VC measured by same-day slow or forced spirometry (2005 standard was >85%) or
-
VI greater than 85% of largest VC and alveolar volume (VA) within 0.2 L or 5% (whichever is greater) of the largest VA from other acceptable maneuvers
-
85% of test gas VI inhaled in less than 4 seconds (unchanged from 2005 standards)
-
Breathe hold time of 10 + 2 seconds without evidence of significant leaks, Valsalva maneuver, or Mueller maneuver (unchanged from 2005 standards)
-
Sample collection completed within 4 seconds of the start of exhalation (was 3 seconds in 2005 standards); for RGA systems, virtual sample collection should be initiated after dead-space washout is complete
The 2017 criterion for DLCO repeatability is as follows:
-
At least two acceptable DLCO measurements within 2 mL/min/mm Hg (0.67 mmol/min/kPa) of each other (2005 standard was 3 mL/min/mm Hg or 1 mmol/min/kPa)
Quality grading for DLCO measurements is as follows:
-
Score of A: (1) VI/VC 90% or VI/VC greater than 85% and VA within 0.2 L or 5% of largest VA from another acceptable maneuver; (2) breath hold time of 8-12 seconds; and (3) sample collection less than 4 seconds
-
Score of B: (1) VI/VC greater than 85%; (2) breath hold time of 8-12 seconds; and (3) sample collection less than 4 seconds
-
Score of C: (1) VI/VC greater than 80%; (2) breath hold time of 8-12 seconds; and (3) sample collection less than 5 seconds
-
Score of D: (1) VI/VC greater than 80%; (2) breath hold time of less than 8 seconds or greater than 12 seconds; and (3) sample collection less than 5 seconds
-
Score of F: (1) VI/VC less than 80%; (2) breath hold time of less than 8 seconds or greater than 12 seconds; and (3) sample collection greater than 5 seconds
Only grade A maneuvers meet all acceptability criteria. The average DLCO values from two or more grade A maneuvers that meet repeatability criterion should be reported. If only one grade A maneuver is obtained, the DLCO value from that maneuver should be reported. If no grade A maneuver is obtained, maneuvers of grades B to D might still have clinical utility, and the average of such maneuvers should be reported. However, these deviations from the acceptability criteria must be noted to caution the interpreter of the test. Maneuvers of grade F are not useable.
Results
The 2017 ATS recommendations for a standardized pulmonary function report details recommendations for reporting of DLCO. [8] A major change is the recommendation to express the measured DLCO on a z-score scale, which expresses the result as the number of multiples of a standard deviation above or below a population mean.
When hemoglobin is measured and available, it should be shown on the report with a note indicating whether the measured or predicted value has been adjusted for this.
Interpretation
Because the DLCO is directly proportional to VA (VA is the lung volume after inhalation of the DLCO test gas, based on the size of the breath of test gas and the dilution of the inspired tracer gas). Nonpulmonary processes that reduce the lung volume at full inflation cause reductions in the DLCO. If VA can be assessed accurately, these reductions produce a normal or elevated KCO. Examples of this include lung resection, thoracic cage abnormalities (eg, kyphoscoliosis), and small lungs. DLCO is reduced in pulmonary emphysema. However, because of the poor distribution of the inspired test gas, the VA may grossly underestimate the TLC, and the resultant KCO may be normal. A reduced DLCO and a reduced KCO suggest a true interstitial disease such as pulmonary fibrosis or pulmonary vascular disease. It has demonstrated that in healthy patients, the KCO is increased to above normal levels when the DLCO test is performed at volumes less than the TLC.
The pattern of a low DLCO and a normal KCO may not be sufficient to rule out the presence of parenchymal disease. The works of Johnson [9] and Chinn et al [10] advocate the volume correction of the predicted value for DLCO by using the measured VA to "correct" the predicted DLCO for low or high lung volumes. Further work is warranted, but studies demonstrating the nonlinearity of the relationship between lung volume and DLCO are sufficiently convincing that the practice of interpreting a low DLCO and a normal KCO (previously known as DLCO/VA) as ”normal” is discouraged. The degree of severity of reduction in the diffusing capacity can be assigned according to the following scheme: less than the predicted lower limit of normal but greater than 60% of predicted is mild, between 40% and 60% of predicted is moderate, and less than 40% is severe.
Nonperfusion of ventilated alveoli, such as in pulmonary vascular disease, produces reduction of both the DLCO and the KCO. Anemia produces a virtual reduction in pulmonary capillary blood volume that causes a reduction in DLCO that can be adjusted mathematically for the reduced hemoglobin. The DLCO may be reduced temporarily in a variety of disorders such as pneumonia, interstitial infiltrative disorders, and alveolar proteinosis. The importance of obtaining an inspiratory vital capacity (IVC) greater than 90% of the best measured VC from the day of the test cannot be overemphasized. Inability to achieve an IVC of greater than or equal to 90% of the largest VC measured that day must be noted on the report.
Assessment of Respiratory Muscle Strength
Synonyms
Maximum inspiratory pressures (MIP), maximum expiratory pressures (MEP), negative inspiratory force (NIF), respiratory pressures, maximum respiratory pressures
Indications
Assessing respiratory muscle strength allows for assessment ventilatory failure, restrictive lung disease, and respiratory muscle strength. [11]
Contraindications
No contraindications exist.
Patient care/preparations
Patients must be able to follow directions.
Test
Determinations of respiratory muscle pressures are a quick and noninvasive means of assessing respiratory muscle strength.
For determining MIP, patients breathe through a flanged mouthpiece with nose clips in place. They are instructed to exhale to RV. At RV, a valve or shutter is closed, and the patient is coached to inhale as forcefully as possible. Maximum pull should be maintained for 1-2 seconds. A standardized leak must be present in the measurement system to eliminate significant overstatement of MIP by allowing the cheek muscles to contribute to the measured pressures. Initial maximum negative pressures that cannot be maintained for one full second are ignored.
MEP: Patients breathe through a flanged mouthpiece with nose clips in place. Patients are instructed to inhale to TLC. At TLC, a valve or shutter is closed and the patient is coached to exhale as forcefully as possible. Maximum push should be maintained for 1-2 seconds. Initial maximum positive pressures that cannot be maintained for a full 1 second are ignored.
The measurement of sniff nasal-inspiratory force (SNIF) shows promising utility in predicting mortality in patients with amyotrophic lateral sclerosis (ALS). [12] A standardized device is not commercially available. A polyethylene catheter ending in a plug is attached to a pressure transducer, and the plug end is inserted into a nostril. The contralateral nostril is occluded, and the patient is instructed to exhale to FRC, then close the mouth and take a deep sniff or a maximal inspiratory effort. Both nostrils are tested, and the highest of six recorded pressures sustained for at least 1 second is reported.
Results
Maximal inspiratory mouth pressure (PImax), maximal expiratory mouth pressure (PEmax), and SNIF are reported in centimeters of water pressure.
Interpretation [13]
As many as 10 efforts are needed before consistency (two measurements within 10% of the highest measured pressure) is achieved in some patients. When respiratory muscle fatigue or neuromuscular disease is present, fatigue may set in before consistency is achieved. Adequate rest between efforts is important.
The range of normal values is broad, suggesting wide variations in respiratory muscle strength among normal values. This makes interpretation of low values difficult. Initial values should be compared to the lower limit of normal values for the patient's age.
In general, a PImax more negative than -80 cm water pressure and a PEmax more positive than +80 cm water pressure excludes important weakness of the respiratory muscles. Patients with a PEmax less than 50 cm water pressure may have difficulty generating sufficient cough to clear respiratory secretions.
In patients with ALS, a SNIF pressure less than 40 cm water was associated with a hazard risk for death of 9.1 (confidence interval [CI], 4-20.8) and the median mortality was 6 ± 0.3 months (95% CI, 2.5-8.5 mo).
Technical considerations
All tests are dependent on effort and technique. Good instruction, vigorous coaching, and adequate rest between efforts are essential. Maximum values should be reproducible within the greater of 10% or 5 cm water pressure. A controlled leak (1 mm diameter, 15 mm length) must be part of the system to prevent erroneously high MIP readings resulting from the use of cheek muscles. This leak is not needed for MEP or SNIF pressure measurements.
Pulse Oximetry
Synonyms
Oximetry, oxygen saturation check, oxygen sat check, exercise oximetry, oxygen titration by oximetry, oxygen saturation measured using pulse oximetry (SpO2), oxygen desaturation test
Contraindications
No contraindications exist.
Patient care/preparations
Standard pulse oximeter probes may be placed on fingers or earlobes of ambulatory patients. Some oximeters use reflectance probes that can be placed on the forehead. Fingernail polish should be removed and peripheral circulation should be maximized by warming or by applying vasodilating cream, if necessary.
Test
Although widely used, the practice of assessing oxygen desaturation by pulse oximetry is poorly standardized. The principle of oximetry measurement by spectrophotometry, although improving, is not as reliable as many practitioners believe. One side of the oximeter probe acts as a light-emitting source, and the other side acts as a photodetector. The probe is placed on a finger or earlobe. A forehead reflectance probe may also be used. The relative absorption of red (absorbed by oxygenated blood) and infrared (absorbed by deoxygenated blood) light of the pulsatile (systolic) component of the absorption waveform correlates to arterial blood oxygen saturation.
Resting readings should be made for at least 5 minutes and the stability of the reading should be characterized on the report. If a finger probe is used when standing, the hand should be placed on the chest at the level of the heart to minimize venous pulsation which can falsely lower the reading. Correlation of the heart rate displayed on the oximeter with an ECG rate or a manually palpated pulse can help characterize the quality of the signal. Agreement within five or more beats per minute generally rules out significant motion artifact. Ideally, correlation of pulse oximetry saturation should be made with a measured oxygen saturation by multiple wavelength spectrophotometry on a simultaneously obtained arterial blood gas sample.
Results
Documentation of the type of pulse oximeter used, probe type, and probe site should be included on each report. The heart rate and SpO2 readings at rest should be reported.
When obtaining pulse oximetry readings during exercise, the type and intensity of exercise (eg, walking speed, duration of activity) along with the heart rate and SpO2 at the end of the activity should be reported. When desaturation is detected, the activity should be repeated with supplemental oxygen in place to demonstrate improvement in SpO2 values.
Pulse oximetry is often performed (though optional) in the setting of the 6-minute walk test, a standardized measure of functional exercise capacity. [14] This test is a measure of the maximum distance the patient is able to walk in a hallway with a minimum of 100 feet marked in 5-foot increments. The patient is permitted to slow down or even stop, if required. However, the elapsed time counter continues during rest periods. This test should be performed while exercise oxygen needs are being adequately met with portable oxygen delivery. Borg dyspnea and fatigue scores are collected immediately after completion of the walk.
Interpretation
Interpretation of oximetry studies, while seemingly simple, generally is not possible without characterizing oximeter accuracy by correlating SpO2 with at least one simultaneously obtained arterial oxygen saturation (SaO2). Laboratories should characterize the average oximeter bias (SpO2 – SaO2) through pooled data to better understand the limitations of using the oximeter but this does not eliminate the possibility that oximeter readings on individual patients may exhibit larger biases. While SpO2 readings greater than 95% make the probability of clinically significant hypoxemia unlikely, clinical suspicion of hypoxemia should initiate the examination of ABGs. The goal of titration of supplemental oxygen should be a stable SpO2 reading of 93% or higher. Arterial desaturation can be considered present when the pulse oximeter saturation falls more than 4% below the baseline reading.
The role of pulse oximetry in the Medicare guidelines for reimbursement for continuous supplemental oxygen therapy are demonstration of one of the following while at rest and breathing room air: PaO2 less than or equal to 55 mm Hg, SaO2 less than or equal to 88%, or SpO2 less than or equal to 88%.
If supplemental oxygen is prescribed at a flow rate of greater than 4 L/min, the results of a PaO2 or oxygen saturation (SaO2 or SpO2) taken on 4 L/min supplemental oxygen must be provided.
Patients may qualify for supplemental oxygen therapy reimbursement even if the PaO2 is greater than 55 mm Hg and the SaO2 or SpO2 is greater than 88% if one of the following conditions is met: (1) dependent edema due to congestive heart failure; (2) cor pulmonale documented by P pulmonale on an ECG or by an echocardiogram, gated blood pool scan, or direct pulmonary artery pressure measurement, and (3) hematocrit greater than 56%.
Technical considerations
Carboxyhemoglobin (CoHb) and methemoglobin (metHb) absorb light at the same wavelength as deoxyhemoglobin, causing a very significant overestimation of SaO2 when these are elevated. Pulse oximetry has other shortcomings. It does not provide information about the oxygen content of the arterial blood. Tissue hypoxia can exist when SpO2 is normal when anemia is present. Elevated levels of dysfunctional hemoglobins (CoHb, metHb) can cause significant overestimation of the actual SaO2.
Additionally, pulse oximetry does not address the adequacy of ventilation, which can be assessed only by evaluation of the partial pressure of carbon dioxide in arterial gas (PaCO2). Motion of the finger within the probe can cause a motion artifact secondary to equal rhythmic absorption of red and infrared light that most oximeters interpret as an SpO2 reading of 85%. Disposable finger probes fixed to the probe site with adhesive and fixed positioning of the probe site during walking can minimize this.
Pulse oximetry tends to overestimate SaO2. One reason for this is the fact that pulse oximetry expresses the percentage of oxyhemoglobin, typically without consideration for CoHb or metHb (see below). One pulse oximetry manufacturer now offers options that allow reporting of total hemoglobin, oxygen content, CoHb and metHb, but these are not yet in widespread use. See below.
SpO2 = oxyhemoglobin/(oxyhemoglobin + reduced hemoglobin [rHb])
In contrast, spectrophotometrically determined oxygen saturation from an ABG sample expresses oxygen saturation as the percentage of the sum of reduced hemoglobin, oxyhemoglobin, CoHb, and MetHb. See below.
SaO2 = oxyhemoglobin/(oxyhemoglobin + rHb + CoHb + metHb)
This significant difference generally results in pulse oximeters reporting an oxyhemoglobin value that is 2-3% higher than the spectrophotometrically determined oxygen saturation, even when the pulse oximeter is functioning perfectly.
While the accuracy of pulse oximetry generally is good in population studies (SaO2 – SpO2< 2%), SpO2 values in individual patients may show a much greater bias, even when dysfunctional Hb levels are normal. Anemia and polycythemia can cause greater oximeter overestimation. SaO2 from simultaneously obtained ABG determinations should be used to characterize oximeter bias in individual patients, although this is not commonly performed.
ABG determinations should be considered whenever the clinical suspicion of hypoxemia exists, even when the oximeter displays a value over the threshold of 88%. Finally, the shape of the oxygen dissociation curve causes the pulse oximeter to be inherently insensitive to mild hypoxemia because relatively large changes in PaO2 in the flat upper portion of the curve cause very small changes in blood SaO2.
Advantages of pulse oximetry include that it is noninvasive, simple, and can be used to evaluate trends (evaluation of oxygenation during exercise, sleep, during procedures).
Disadvantages of pulse oximetry include that it cannot be used to assess oxygen delivery (anemia) or adequacy of ventilation (PaCO2) and that accuracy is lessened in the presence of elevated dysfunctional hemoglobin levels (CoHb, metHb), with a tendency to overestimate SaO2 by an average of 2-3%.
Factors that influence the accuracy of pulse oximetry readings
Overestimation of SaO2 is possible with bright sunlight on the probe, fluorescent lights, operating room lights, infrared heat lamps, elevated CoHb, elevated metHb, anemia, and motion artifact if the actual SaO2 is less than 85%.
Underestimation of SaO2 is possible because intravascular dyes, such as methylene blue and indocyanine green, produce transient reductions in SpO2. Fingernail polish, increased venous pressures, and motion artifact if the actual SaO2 is greater than 85% also can cause underestimation of the SaO2.
Methacholine Challenge Testing
Synonyms
Mecholyl challenge, bronchial provocation test
Indications
It is used diagnose asthma, confirm a diagnosis of asthma, document the severity of hyperresponsiveness, and follow changes in hyperresponsiveness. [15]
Contraindications
Absolute contraindications include FEV1 less than 1.5 L in adults, less than 1 L in children, recent severe acute asthma, myocardial infarction or cerebral vascular accident within 3 months, and arterial aneurysm.
Relative contraindications include moderate baseline airway obstruction, spirometry-induced bronchoconstriction, recent upper respiratory tract infection (URI), exacerbation of asthma, hypertension, pregnancy, and epilepsy.
Patient care/preparations
The following medications are withdrawn before a methacholine challenge test for the specified period:
-
Short-acting beta agonists (6 h)
-
Long-acting beta agonists (36 h)
-
Oral beta agonists (24 h)
-
Short-acting methylxanthines (12 h)
-
Long-acting methylxanthines (48 h)
-
Anticholinergics (6 h)
-
Cromolyn sodium (24 h)
-
Antihistamines (72 h)
-
The withholding of oral or inhaled steroids before methacholine has not been shown to be necessary but may have an impact. The appropriateness of the methacholine challenge test in a patient who requires oral steroids should be considered (see Contraindications).
Test
The following list shows the most common schedule of methacholine dosing in use in the United States today. Some labs begin with the lowest strength methacholine solution immediately after baseline. Others experts advocate the use of a diluent stage between baseline and methacholine. This allows identification of a small percentage of individuals who exhibit significant bronchoconstriction in response to the diluent itself, suggestion, or repeated spirometry efforts. Abbreviated protocols that start with higher concentrations of methacholine should be used cautiously, if at all.
Methacholine challenge schedule: After establishing baseline spirometry measurements, the patient inhales five breaths of saline or diluent aerosol and then five breaths of each of the following strengths of aerosolized methacholine in solution: 0.0625 mg/mL, 0.25 mg/mL, 1 mg/mL, 4 mg/mL, and 16 mg/mL.
An alternative longer (10-stage) dosing schedule that may yield a more precise assessment of airway hyperreactivity calls for the patient to inhale five breaths of methacholine aerosol in the following strengths: 0.031 mg/mL, 0.0625 mg/mL, 0.125 mg/mL, 0.25 mg/mL, 0.5 mg/mL, 1 mg/mL, 2 mg/mL, 4 mg/mL, 8 mg/mL, and 16 mg/mL.
The following dosing schedule is approved by the US Food and Drug Administration and also may be used, although the ATS guidelines for methacholine challenge testing recommend one of the two schedules outlined above because the dosing steps are more even: 0.025 mg/mL, 0.25 mg/mL, 2.5 mg/mL, 10 mg/mL, and 25 mg/mL. [15]
Methacholine aerosol is delivered in a standardized fashion by using a dosimeter, a device that applies a 0.6-second burst of compressed air to the nebulizer at the start of the inhalation from FRC to TLC. Subjects should hold their breath for 5 seconds. Spirometry is performed 30-90 seconds after the end of the last breath of each stage of the challenge. Symptoms volunteered by the subject are recorded. The challenge is discontinued when a fall in FEV1 of greater than 20% is observed upon repeat efforts or a final cumulative dose of 188.64 cumulative dose units is received. Administration of a bronchodilator should immediately follow the final postmethacholine assessment.
Results
Results are presented as both a table of spirometry parameters for each stage of the challenge and as a dose-response curve plotting the fall in FEV1 against the methacholine concentration or the cumulative dose delivered during the challenge. The reporting of the PC20 or PD20 (provocative concentration or dose in mg/mL or milligrams, respectively, causing a 20% fall in FEV1 from baseline) is the usual method of expressing the outcome of the challenge test.
Interpretation
A 20% fall in FEV1 generally is considered a positive test. The American Thoracic Society recommends the use of a 35% fall specific airway conductance (SGaw) to denote the presence of airway hyperreactivity when technically good spirometry cannot be obtained. It has been suggested that a significant subset of patients will exhibit a 35% fall in SGaw when the FEV1 remains greater than 80% of its baseline value. This may represent a subset of patients that has widespread small airway changes.
One scheme for using the PC20 FEV1 to characterize the severity of clinical hyperreactivity has been used by Hargreave et al. PC20 FEV1 severity is assessed as follows: 0.03-0.124 is considered severe, 0.125-1.99 is considered moderate, 2.00-7.99 is considered mild, and 8-25 is considered an increased hyperresponsive reaction (however, clinically significant disease is not common).
Technical considerations
Spurious nonreproducible decrements of expiratory airflow should not be considered valid. Continuation of the challenge beyond 25 mg/mL has little clinical value because responses of some healthy patients who are nonasthmatic begin at this level.
Failure to demonstrate bronchial hyperreactivity does not totally exclude asthma, particularly asthma triggered by specific exposure to chemicals (eg, methylene diisocyanate, toluene diisocyanate).
A positive methacholine challenge test does not by itself indicate the presence of asthma. Nonspecific bronchial hyperreactivity is characteristic of asthma but occurs after a viral respiratory illness, with resolution taking up to several months.
Nonspecific bronchial hyperreactivity also can be found in chronic obstructive pulmonary disease, cystic fibrosis, and bronchiectasis.
Six-Minute Walk Test
Background
The six-minute walk test (6mwt) is a test that can aid in assessing the functional capacity of patients with cardiopulmonary disease. The patient is instructed to walk as far as possible on a straight track, ideally 100 feet in length. Patients are advised that they can set their own pace and can pause to rest, if needed, but should resume walking as soon as they are able. If the patient does pause to rest, the elapsed timer for the test continues. Obtaining the total distance walked (six-minute walk distance [6mwd]) is the primary objective of the test, although the estimation of arterial oxygen saturation by pulse oximetry and the patient’s assessment of dyspnea and fatigue during the walk are typically collected. The test is increasingly used as a clinical tool, with reference equations now available for predicting a normal 6mwd and lower limit of normal. The minimum clinically important difference (MCID) for the 6mwd is 30 m in patients with IPF, PAH, or COPD. [16, 17, 18, 19]
Indications
It is used as an assessment of exercise tolerance (functional capacity) in patients with disease.
Preintervention and postintervention comparisons (medication changes, surgery, transplant) can be made.
Absolute and relative contraindications for a 6mwt
Absolute contraindications include the following:
-
Acute myocardial infarction
-
Unstable angina
-
Uncontrolled arrhythmias causing symptoms or hemodynamic compromise
-
Active endocarditis
-
Acute myocarditis or pericarditis
-
Symptomatic severe aortic stenosis
-
Uncontrolled heart failure
-
Acute pulmonary embolus or pulmonary infarction
-
Thrombosis of lower extremities
-
Suspected dissecting aneurysm
-
Uncontrolled asthma
-
Pulmonary edema
-
Room air SpO2 at rest less than 85%
-
Acute respiratory failure
-
Acute noncardiopulmonary disorder that may affect exercise performance or be aggravated by exercise (ie, infection, renal failure, thyrotoxicosis)
-
Mental impairment leading to inability to cooperate
Relative contraindications are as follows:
-
Left main coronary stenosis or its equivalent
-
Moderate stenotic valvular heart disease
-
Severe untreated arterial hypertension at rest (200 mm Hg systolic, 120 mm Hg diastolic)
-
Tachyarrhythmias or bradyarrhythmias
-
High-degree atrioventricular block
-
Hypertrophic cardiomyopathy
-
Significant pulmonary hypertension
-
Advanced or complicated pregnancy
-
Electrolyte abnormalities
-
Orthopedic impairment that prevents walking
Patient preparation
Wear comfortable clothing and shoes for walking.
Use usual walking aids.
No vigorous exercise should be performed within 2 hours.
Repeat testing should occur at the same time of the day to reduce intraday variability.
When possible, perform PFTs prior to the 6mwt.
Oxygen should be administered as prescribed by the physician or protocol; oxygen flow should remain constant throughout the test. Oxygen is not to be titrated during the test; if titration is needed, this should be done as a separate test before the 6mwt and adequate rest (at least 15 min) should be allowed after exercise titration before the 6mwt.
Medications should be taken as prescribed.
Pretest assessment should include resting SpO2, heart rate, blood pressure, and baseline dyspnea and fatigue (modified Borg scale).
The following standardized instructions should be read to the patient:
The aim of this test is to walk as far as possible for 6 minutes. You will walk along this hallway between the markers, as many times as you can in 6 minutes.
I will let you know as each minute goes past, and then at 6 minutes I will ask you to stop where you are.
Six minutes is a long time to walk, so you will be exerting yourself. You are permitted to slow down, to stop, and to rest as necessary, but please resume walking as soon as you are able.
Remember that the objective is to walk as far as possible for 6 minutes, but don’t run or jog.
Do you have any questions?
Terminating the 6mwt
Prior to the 2014 ATS/ERS Technical Standard for Field Walking tests, monitoring the patient with pulse oximetry was optional. This document established SpO2 falling below 80% as an indication for the operator to terminate the procedure, making the monitoring of pulse oximetry mandatory. This new standard was adopted to be consistent with guidelines for incremental exercise testing. In severely debilitated patients, a 6mwt does result in patients exerting themselves maximally, and stopping the 6mwt when the SpO2 falls below 80% is prudent for ensuring patient safety. The guidelines allow for the subject to resume the 6mwt if the SpO2 rises above 85% after stopping (the elapsed timer continues while the patient rests).
Other reasons for test cessation include chest pain, intolerable dyspnea, leg cramps, staggering, diaphoresis, and a pale or ashen appearance. If the test is stopped for any of these reasons, the patient should sit or lie supine as appropriate, and the operator should obtain blood pressure, pulse rate, SpO2 and a physician evaluation as deemed appropriate. Oxygen should be administered, if necessary.
Test repetition
It is recommended that the initial 6mwt be repeated after an interval of at least 30 minutes with a return of the heartrate and SpO2 to baseline values prior to the second test in an effort to establish a stable baseline from which subsequent tests can be evaluated.
Standard phrases of encouragement
The 6mwd is sensitive to the influence of the operator administering the test. It is recommended that the following standard phrases of encouragement be delivered in an even tone of voice at 1-minute intervals in order to minimize the influence of the operator:
-
1 minute: You are doing well. You have 5 minutes to go.
-
2 minutes: Keep up the good work. You have 4 minutes to go.
-
3 minutes: You are doing well. You are halfway.
-
4 minutes: Keep up the good work. You have only 2 minutes left.
-
5 minutes: You are doing well. You have only 1 minute to go.
-
6 minutes: Please stop where you are.
-
If the patient stops during the test, every 30 seconds once the SpO2 is greater than 85%: Please resume walking whenever you feel able.
The total distance walked in 6 minutes is the primary outcome of the test. The lowest, stable SpO2 and the heart rate at the end of the walk should be recorded. The postwalk blood pressure should be measured as soon as possible after ending the walk, and the modified Borg scale should be shown to the patient to assess his or her perception of dyspnea and fatigue during the walk.
Interpretation
The 6mwd should be compared with a mean predicted normal 6mwd and the lower limit of normal from reference equations that have been verified by the local population. The 6mwd should be compared with a previously obtained baseline 6mwd, if available.
Cardiopulmonary Stress Testing
Synonyms
Cardiopulmonary exercise (CPX) test
Indications
CPX test is used for evaluation of dyspnea that is out of proportion to findings on static pulmonary function tests, preoperative evaluation of operative risk when lung function is compromised or removal of lung segments is contemplated, evaluation of disability, identification of exercise-induced asthma, and evaluation of therapy.
Contraindications
Absolute contraindications include unstable angina, aortic stenosis, uncontrolled hypertension, uncontrolled asthma, hypoxemia (SaO2< 85% at rest), and febrile illness.
Relative contraindications include hypertension, cardiac disease, epilepsy, and locomotor disorder (inability to exercise).
Patient care/preparations
Perform calibration of the volume-measuring device and gas analyzers. Patients should avoid eating a heavy meal 1-2 hours before the test. Patients should wear loose comfortable clothing and athletic shoes. If exercise-induced bronchoconstriction is considered, withhold medications as with the methacholine challenge. ECG electrodes/leads are applied. Adjustment of the seat height on a bicycle ergometer is made to permit near-full leg extension when one pedal is at its lowest position (slight bend at knee). Airtight fitting of a low dead-space mask or mouthpiece/nose clips is applied. Apply and correctly position a blood pressure cuff. A pulse oximeter probe is applied securely. Insertion of an indwelling arterial canula for arterial blood sampling is optional.
Test
The cardiopulmonary exercise test is a means of measuring the integrated response of the pulmonary, cardiovascular, and muscular systems to a steadily increasing workload. The test may be performed on a bicycle ergometer or treadmill. Resting measurements are made for 3-5 minutes. Three minutes of unloaded cycling is performed as a warmup period. The workload is incremented at a rate designed to allow reaching maximum work capacity in 8-12 minutes. The test continues to a point of symptom limitation (severe dyspnea, chest pain, faintness, pallor, inability to continue pedaling or walking) or discontinuation by medical staff for one of the following conditions: significant ECG abnormalities, fall in systolic or diastolic blood pressure (BP) greater than 20 mm Hg below resting value, rise in systolic BP to greater than 250 mm Hg, rise in diastolic BP to greater than 120 mm Hg, severe oxygen desaturation (< 80%), or achievement of maximum predicted heart rate.
Determining the proper rate of workload incrementation: The workload incrementation rate should be chosen to produce a test of 8-12 minutes in length. If the workload incrementation is too high, the test will be too brief. In this circumstance, the patient should be allowed to recover and should be retested. If the workload incrementation is too small, fatigue may prevent a valid second test. Below is Wasserman's method for estimating the workload increment size for cycle ergometry:
-
Estimate the unloaded oxygen consumption per minute (VO2): Unloaded VO2 (mL/min) = 150 + (6 × weight [kg])
-
Estimate the peak VO2: Peak VO2 (mL/min) = (height [cm] – age [y]) × 20 for sedentary men or peak VO2 (mL/min) = (height [cm] – age [y]) × 14 for sedentary women
-
Estimate the work rate increment: Work rate increment (watts/min) = (peak VO2 (mL/min) – unloaded VO2 (mL/min)/100
Patients with significant reductions in the predicted VEmax (FEV1 below 50% of predicted) should use an increment of 10 watts/min or less. Patients with severe obstruction resulting in a preexercise maximum voluntary ventilation (MVV) of less than 40 L/min should use an incrementation rate of 5 watts/min.
Results
The following parameters are measured or calculated on a breath-by-breath basis: minute ventilation (VE, L/min), tidal volume (VT, mL/breath), respiratory rate (RR, mL/breath), oxygen uptake (VO2, mL/min and mL/min/kg), carbon dioxide production (VCO2, mL/min), respiratory exchange ratio (RER, VCO2 -to-VO2), SpO2, heart rate (HR, beats/min), oxygen pulse (mL VO2/min/heartbeat), and BP (mm Hg). If ABG determinations are obtained, discrete values for the ratio of dead space to tidal volume (VD-to-VT) and alveolar to arterial oxygen gradient (A-a-to-O2) can be calculated for that interval of exercise.
Interpretation
The assessment of a normal work capacity is made by evaluation of the peak oxygen uptake (VO2 peak). The normal value for oxygen uptake is based on sex, age, and weight.
The predicted peak VO2 is determined by the patient's age and sex. This value can be further refined for sedentary individuals by a three-step process (see below) that adjusts the predicted value up or down based on a comparison of the patient's weight and their ideal body weight. The predicted normal values for sedentary men and women from Wasserman et al are described below.
For sedentary men, calculate the cycle factor, ie, cycle factor = 50.72 – (0.372 × age), as follows:
-
Step 1: Measure the man's weight (W [kg]) and height (H [cm]) in light clothes and without shoes, and record his age (A [y]).
-
Step 2: Calculate his normal (predicted) W in kg, ie, normal (predicted) W = (0.79 × H) – 60.7.
-
Step 3A: If his actual W equals his normal W, the formula is predicted peak VO2 (mL/min) = actual W × cycle factor.
-
Step 3B: If his actual W is less than his normal W, the formula is predicted peak VO2 (mL/min) = [(normal W + actual W)/2] × cycle factor.
-
Step 3C: If his actual W exceeds his normal W, the formula is predicted peak VO2 (mL/min) = (normal W × cycle factor) + [6 × (actual W – normal W)].
-
Step 4: If a treadmill is used rather than cycle, multiply predicted VO2 by 1.11.
For sedentary women, calculate the cycle factor, ie, cycle factor = 22.78 – (0.17 × age), as follows:
-
Step 1: Measure her weight (W [kg]) and height (H [cm]) in light clothes and without shoes, and record age (A [y]).
-
Step 2: Calculate her normal (predicted) W in kg, ie, normal (predicted) W = (0.65 × H) – 42.8.
-
Step 3A: If her actual W equals her normal W, the formula is predicted peak VO2 (mL/min) = (actual W + 43) × cycle factor.
-
Step 3B: If her actual W is less than her normal W, the formula is predicted peak VO2 (mL/min) = [(normal W + actual W + 86)/2] × cycle factor.
-
Step 3C: If her actual W exceeds her normal W, the formula is predicted peak VO2 (mL/min) = [(normal W + 43) X cycle factor] + [6 × (actual W – normal W)].
-
Step 4: If a treadmill is used rather than a cycle, multiply her predicted VO2 by 1.11.
A normal CPX test demonstrates a normal peak VO2, the peak HR at or below the predicted maximum HR, and demonstration of ventilatory reserve (peak ventilation/predicted maximum ventilation < 65-70%). When the VO2 peak is low, the peak HR is compared to the predicted maximum HR to determine cardiovascular reserve. A ratio of HRpeak to HRpredicted maximum that approaches or exceeds one indicates a clear cardiovascular limitation to exercise.
Likewise, the peak expired volume (minute ventilation, VE) is compared to the larger of a pretest MVV or FEV1 multiplied by 40 to determine the pulmonary reserve. A ratio of VE peak to VE predicted maximum that approaches or exceeds one is a clear indication of pulmonary limitation. A VO2 peak below 15 mL/min/kg often is used as an indication of disability. Pulmonary limitation also may cause significant oxygen desaturation due to the reduction of the transit time of the pulmonary capillary blood to a point where diffusion limitation can occur. In the absence of cardiovascular or pulmonary limitation, peripheral circulatory or skeletal muscle limitation may exist. This must be distinguished from poor effort or malingering.
The anaerobic threshold is defined as the workload (expressed as VO2) in which blood lactate levels rise significantly (>4mmol/L), indicating that a significant fraction of the work is being accomplished by anaerobic metabolic sources. The establishment of the anaerobic threshold may have clinical importance, particularly when the evaluation seeks to determine the presence of an occupational disability.
Identifying the anaerobic threshold noninvasively: The noninvasive determination of the anaerobic threshold can be accomplished by analyzing time averaged (20- to 30-s intervals) plots of parameters measured or calculated during the CPX test. Two methods can be used, the V-slope method and the ventilatory equivalent method. Both methods allow determination of the same physiologic event, the increased production of carbon dioxide by isocapnic buffering of lactic acid produced by anaerobic metabolism and yield comparable estimations.
V-slope method: The V-slope method of determining the anaerobic threshold makes use of the fact that carbon dioxide production (VCO2) plotted against oxygen consumption (VO2) shows a slope of slightly less than 1 for work below the anaerobic threshold. A line of best fit for points obtained from the start of exercise is drawn through this plot to obtain the initial slope (S1). When this slope changes to a steeper slope (S2), it indicates an increase in carbon dioxide production from the isocapnic buffering of lactic acid. The intersection of S1 and S2 mark the anaerobic threshold, typically reported as either the absolute value of the oxygen uptake (VO2, mL/min) at that point or as the percentage of the predicted peak VO2.
Ventilatory equivalent method: The ventilatory equivalent method of determining the anaerobic threshold makes use of the derived values known as the ventilatory equivalents for oxygen and carbon dioxide. Carbon dioxide production (VCO2) and oxygen consumption (VO2) divided into the minute ventilation (VE, L/min) are known as the ventilatory equivalents for carbon dioxide (VE/VCO2) and oxygen (VE/VO2). When time averaged (20- to 30-s intervals) plots of VE/VO2 and VE/VCO2 are plotted against time, the point at which the VE/VO2 is seen to increase without a simultaneous increase in the VE/VCO2 marks the anaerobic threshold.
Case examples
Normal male: This 46-year-old man who previously smoked (smoking history of 30 pack-years) is evaluated as a biological control in the authors' laboratory. He has no health complaints.
Table 3A. Lung Function (Open Table in a new window)
Parameter |
Predicted |
Measured |
Age |
|
46 |
Sex |
|
Male |
Height (cm) |
|
188 |
Weight (kg) |
|
104 |
Hemoglobin |
|
15.4 |
VC (L) |
5.65 |
6.5 |
TLC (L) |
7.76 |
9.02 |
RV (L) |
2.17 |
2 |
FEV1 (L) |
4.47 |
5.01 |
FEV1/FEV (%) |
79 |
76 |
MVV (L/min) |
170 |
212 |
DLCO (mL/min/mm Hg) |
31.6 |
32.4 |
Table 3B. Exercise (Open Table in a new window)
Parameter |
Predicted |
Measured |
Peak VO2 (L/min) |
3.05 |
3.03 |
Maximum HR (beats/min) |
174 |
182 |
Maximum O2 pulse (mL/beat) |
17.5 |
16.6 |
AT (L/min) |
>1.34 |
1.5 |
BP (mm Hg) (rest, maximum) |
|
120/68, 188/85 |
Maximum VE (L/min) |
|
129 |
Ventilatory reserve (L/min) |
>15 |
83 |
SpO2 (%) (rest, maximum) |
|
98, 98 |
The patient stopped the exercise test citing leg fatigue and dyspnea as the reasons for terminating the test. The results reveal a normal oxygen uptake with a normal cardiovascular limitation to exercise (predicted maximum HR was exceeded). Significant ventilatory reserve existed at the end of exercise.
Ventilatory limitation: A 55-year-old man with a smoking history of 35 pack-years and a diagnosis of emphysema was referred for cardiopulmonary exercise testing to evaluate the complaint of dyspnea upon exertion. The patient uses an inhaled beta-agonist as needed.
Table 4A. Lung Function (Open Table in a new window)
Parameter |
Predicted |
Measured |
Age |
|
55 |
Sex |
|
Male |
Height (cm) |
|
173 |
Weight (kg) |
|
80 |
Hemoglobin |
|
15.6 |
VC (L) |
4.55 |
4.32 |
TLC (L) |
6.6 |
7.31 |
RV (L) |
2.04 |
3.56 |
FEV1 (L) |
3.63 |
2.68 |
FEV1/FEV (%) |
80 |
62 |
MVV (L/min) |
134 |
99 |
DLCO (mL/min/mm Hg) |
23.8 |
16.7 |
Table 4B. Exercise (Open Table in a new window)
Parameter |
Predicted |
Measured |
Peak VO2 (L/min) |
2.32 |
1.39 |
Maximum HR (beats/min) |
165 |
122 |
Maximum O2 pulse (mL/beat) |
14.1 |
11.4 |
AT (L/min) |
>1.04 |
1 |
BP (mm Hg) (rest, maximum) |
|
117/85, 170/102 |
Maximum VE (L/min) |
|
93 |
Ventilatory reserve (L/min) |
>15 |
6 |
SpO2 (%) (rest, maximum) |
|
95/91 |
The patient terminated the procedure citing dyspnea as the sole reason for stopping the test. The results show moderate impairment of the peak oxygen consumption with a clear ventilatory limitation to exercise. Significant cardiovascular reserve existed at the end of exercise, and the ventilatory reserve was below normal. Pulse oximetry readings are suggestive of exercise desaturation.
Cardiac limitation: This 48-year-old woman was referred for a cardiopulmonary exercise testing to evaluate her shortness of breath upon exertion over the last 6 months. Pulmonary function tests reveal a mild restrictive ventilatory defect with a normal DLCO, suggesting no active parenchymal disease.
Table 5A. Lung Function (Open Table in a new window)
Parameter |
Parameter Predicted |
Measured |
Age |
|
48 |
Sex |
|
Female |
Height (cm) |
|
158 |
Weight (kg) |
|
55 |
Hemoglobin |
|
13.4 |
VC (L) |
3.13 |
2.1 |
TLC (L) |
4.79 |
3.57 |
RV (L) |
2.04 |
3.56 |
FEV1 (L) |
2.6 |
1.79 |
FEV1/FEV (%) |
83 |
85 |
MVV (L/min) |
98 |
85 |
DLCO (mL/min/mm Hg) |
18.9 |
20.6 |
Table 5B. Exercise (Open Table in a new window)
Parameter |
Predicted |
Measured |
Peak VO2 (L/min) |
1.47 |
0.79 |
Maximum HR (beats/min) |
172 |
184 |
Maximum O2 pulse (mL/beat) |
8.5 |
4.3 |
AT (L/min) |
>0.69 |
0.62 |
BP (mm Hg) (rest, maximum) |
|
115/89, 165/88 |
Maximum VE (L/min) |
|
49 |
Ventilatory reserve (L/min) |
>15 |
26 |
SpO2 (%) (rest, maximum) |
|
96, 94 |
The patient terminated the exercise test citing shortness of breath. The results reveal a moderately reduced oxygen consumption with a cardiovascular limitation (HR maximum exceeded the predicted maximum HR) and adequate ventilatory reserve. The oxygen pulse did not increase normally during the study, with near-peak values observed during unloaded cycling and very little increase during the work phase of the study. Cardiac function studies demonstrated left ventricular failure secondary to mitral insufficiency.
Preoperative evaluation for pneumonectomy
VO2 maximum values greater than 20/mL/kg/min or 75% of predicted indicate the ability to withstand pneumonectomy when the cardiac history is negative.
A VO2 maximum between 10 and 20 mL/kg/min and 40-75% of predicted require prediction of postoperative FEV1, DLCO, and VO2. Prediction of postoperative function is calculated by multiplying the preoperative value by the fraction of total perfusion ascribed to the remaining lung, as follows:
Predicted postoperative (PPO) (FEV1, DLCO, or VO2) = preoperative (FEV1, DLCO, or VO2) × Q% of the remaining lung
When the FEV1 PPO and DLCO PPO are greater than 40% and the VO2 PPO is greater than 10 mL/kg/min and 35% of predicted, resection up to the calculated extent is feasible.
A VO2 maximum of less than 40% or 10 mL/kg/min or VO2 maximum PPO of less than 35% or 10 mL/kg/min strongly suggest inoperability for lung resection candidates.
Technical considerations
Because motion artifact typically causes an estimation of SpO2 of 85%, care should be taken to differentiate oxygen desaturation from motion artifact, particularly if circulation to the oximeter probe site is compromised by pressure on a treadmill handrail or ergometer handgrip. If arterial blood is sampled at peak exercise, it should be obtained while exercising because PaO2 values can recover in as little as 15-30 seconds after cessation of exercise.
Arterial Blood Gases
Synonyms
ABGs
Indications
ABGs are used in the evaluation of ventilation, oxygenation, and acid-base status.
Contraindications
No contraindications exist, although some sampling sites may be deemed unsuitable for use secondary to peripheral circulatory disorders.
Patient care/preparations
Assess collateral circulation. If a baseline room air oxygen level is desired, patients should discontinue use of supplemental oxygen for 20 minutes. If the patient is receiving anticoagulant therapy, extra care must be taken to continue pressure on the sampling site until bleeding has stopped. Personnel obtaining and/or analyzing the sample should don rubber gloves and take appropriate infection control measures.
Test
The sampling site of choice is the radial artery, unless tests of collateral circulation indicate otherwise. Samples also may be obtained from the brachial and femoral arteries.
Results
See the list below:
-
Measured: pH, PaCO2 (mm Hg or kPa), PaO2 (mm Hg or kPa), and, if hemoximetry is performed, total hemoglobin (tHb, g/dL), oxyhemoglobin (O2 Hb [%]), and metHb (%)
-
Calculated: Total bicarbonate (HCO3 [mEq/L]), base excess or deficit (mEq/L), oxygen content (CO2 [mL] O2/dL or volume%)
Interpretation
ABGs provide three assessments of the function of the respiratory system: evaluation of oxygenation (PaO2 [mm Hg] and A-a oxygen gradient PO2), evaluation of the adequacy of ventilation (PaCO2 [mm Hg]), and evaluation of the lung's role in acid-base balance of the arterial blood (pH, PaCO2).
Oxygenation
In healthy subjects breathing room air at sea level, the normal PaO2 (mm Hg) is affected by age, body mass index (BMI), PaCO2 (mm Hg), and posture (upright vs supine). [4] An average decline in PaO2 of 10 mm Hg occurs for each decade of life up to approximately 75 years.
Normal PaO2 can be predicted by the following equation:
Normal resting, room air PaO2 = 104 – (0.27 × age) + 7 mm Hg
Low levels of arterial oxygen can be attributed to one or more of five categories, as follows: (1) ventilation/perfusion (V/Q) mismatching, (2) alveolar-capillary diffusion limitation, (3) hypoventilation, (4) anatomic right-to-left shunts, and (5) low inspired oxygen partial pressures (eg, altitude).
Evaluation of hypoventilation as a cause for a reduced PaO2 can be made using the ideal alveolar air equation, which allows computation of an alveolar oxygen tension and calculation of an A-a oxygen gradient.
The simplified ideal alveolar gas equation is as follows:
PaO2 = PIO2 – (PaCO2/R)
PaO2 is the ideal alveolar oxygen tension, PIO2 is partial pressure of inspired oxygen, PaCO2 is partial pressure of arterial carbon dioxide, and R is the ratio of carbon dioxide production to oxygen consumption (generally assumed to be 0.8 at rest).
The measured partial pressure of oxygen in the arterial blood is subtracted from the ideal alveolar oxygen tension to calculate the A-a PO2 gradient. This gradient can be compared to a normal age-adjusted gradient (normal resting, room air A-a oxygen gradient = (age + 4)/4) to determine the effects of hypoventilation and hyperventilation. Reduced arterial oxygen tension secondary to pure hypoventilation exhibits a normal A-a PO2 gradient.
Determination of right-to-left shunt by blood gases: The fraction of the cardiac output that bypasses normal circulatory pathways can be estimated by obtaining an ABG sample after 20 minutes of breathing 100% oxygen from a large reservoir bag. This period of oxygen breathing should wash out all of the nitrogen from all ventilated alveoli. This makes the measured oxygen gradient (A-a PO2) independent of V/Q inequalities. While the true shunt requires a measurement of a mixed venous oxygen level, this often is not practical, and an estimated arterial-to-mixed venous oxygen content difference of 5 volume% often is assumed, as shown.
Qs/Qt = (0.0031 X [A-a]PO2)/(0.0031 X [A-a]PO2 + 5)
Qs/Qt is the calculated right-to-left shunt fraction, 0.0031 is the solubility coefficient of oxygen in blood, (A-a) PO2 is the gradient of alveolar to arterial oxygen partial pressure after 20 minutes of breathing 100% oxygen, and 5 is the assumed difference in resting arterial-to-mixed venous oxygen content. States of low and high cardiac output may invalidate the assumed arteriovenous oxygen (A-VO2) difference and cause significant error in the calculated shunt fraction.
Causes of increased right-to-left shunting may be intrapulmonary, such as pulmonary arteriovenous malformations, dilated capillaries in hepatopulmonary syndrome, lobar collapse or consolidation, or extrapulmonary conditions (eg, right-to-left intracardiac shunts, bronchial artery-to-pulmonary vein connections.
Technical considerations
Samples must be mixed with an anticoagulant, preferably heparin (if liquid, dead space volume of syringe and needle should be filled before sampling with 1000 U/mL heparin), to avoid clotting before or during analysis. Samples should be analyzed immediately. Recommendations have been to store samples in ice water if analysis is delayed to reduce the drop in PO2 secondary to the metabolism of blood cells. However, one study demonstrated a significant increase in PO2 of arterial blood gas samples obtained in a plastic syringe and stored in ice water for 30 minutes. [20]
Exhaled Nitric Oxide
Background
Measurement of fractional exhaled nitric oxide (FENO) is a noninvasive, safe, and simple method of quantifying airway inflammation. FENO in asthma may have the utility of helping make the diagnosis, monitoring the patient's compliance with prescribed medications, and predicting pending exacerbations.
It is important to recognize that asthma is a clinical diagnosis and FENO is not diagnostic for asthma, nor does a normal FENO measurement not exclude the diagnosis of asthma. FENO may be low in asthma not due to airway eosinophilia. FENO does have utility in predicting steroid responsiveness, even in the absence of induced sputum eosinophils.
Indications
Common reasons for obtaining a FENO test include the following [21, 22] :
-
Assessment of cough, wheezing, and dyspnea
-
Identifying eosinophilic asthma phenotype
-
Assessing the potential response to anti-inflammatory agents, notably inhaled corticosteroids (ICS)
-
Establish a baseline FENO during a period of clinical stability for subsequent monitoring of chronic persistent asthma
-
To guide changes in anti-inflammatory medications in a step-wise manner
-
To assist in the evaluation of adherence to anti-inflammatory medications
-
To assess whether airway inflammation is contributing to poor asthma control, particularly in the presence of other contributors (eg, rhinosinusitis, anxiety, gastroesophageal reflux, obesity, continued allergen exposure)
Measurement procedure
FENO measurements have been shown to be increased by nitrate-containing foods such as lettuce and may be transiently lowered by drinking coffee or water and smoking cigarettes. Patients should refrain from smoking and the ingestion of food or beverages for 1 hour before FENO measurement. Upper and lower respiratory tract viral infections may lead to increased levels of FENO, and measurement should be deferred until recovery, if possible.
Clinical instruments for the measurement of exhaled nitric oxide typically require that the patient inhale fully through the device so that ambient nitric oxide can be scrubbed. The patient then exhales into the device, which affords greater than 5 cm water resistance to assist with velum closure, thereby preventing or minimizing nasal contribution to the exhaled gas sample (nasal nitric oxide is much higher than lower airway nitric oxide). The measuring device provides auditory and visual feedback to assist with maintaining a constant exhaled flow. A single sample deemed acceptable by the measuring device is sufficient.
Interpretation
Table 6.Use of FENO in Evaluation of Cough and/or Wheeze and/or Dyspnea [23] (Open Table in a new window)
FENO < 25 ppb (< 20 ppb in children) |
FENO 25-50 ppb (20-35 in children) |
FENO >50 ppb (>35 ppb in children) |
|
Symptoms present in the past 6 weeks or longer |
- Eosinophilic airway inflammation unlikely - Consider alternative diagnoses - Unlikely to benefit from ICS |
- Interpret with caution - Consider clinical context - Monitor change in FENO over time - Consider variables like atopy and smoking |
- Eosinophilic airway inflammation present - Likely to benefit from ICS |
Table 7. Use of FENO for Monitoring (in Patients with Diagnosed Asthma) [23] (Open Table in a new window)
FENO < 25 ppb (< 20 ppb in children) |
FENO 25-50 ppb (20-35 in children) |
FENO >50 ppb (>35 ppb in children) |
|
Symptoms present |
- Consider alternative diagnoses - Unlikely to benefit from increase in ICS |
- Persistent allergen exposure - Inadequate ICS dose - Poor compliance - Steroid resistance |
- Persistent allergen exposure - Poor compliance or inhaler technique - Inadequate ICS dose - Risk for exacerbation - Steroid resistance |
Symptoms absent |
- Adequate ICS dose - Good compliance - Consider ICS taper |
- Adequate ICS dosing - Good compliance - Monitor change in FENO |
- ICS withdrawal or dose reduction may result in relapse - Poor compliance or inhaler technique |
Questions & Answers
Overview
What is the role of spirometry in pulmonary function testing?
What are contraindications to spirometry in pulmonary function testing?
What is the preparation for spirometry in pulmonary function testing?
How should spirometry results be interpreted in pulmonary function testing?
What are considered acceptable spirometry results in pulmonary function testing?
Which spirometry test findings are characteristic of significant loss of lung elastic recoil?
What is recommended regarding interpretation of spirometry results in pulmonary function testing?
What is the hallmark of obstructive defects in spirometry for pulmonary function testing?
What is indicated to rule out restrictive defects in spirometry for pulmonary function testing?
What are the normal spirometry ratios in pulmonary function testing?
How is severity of impairment quantified in spirometry testing?
How is diaphragm strength assessed by spirometry testing?
How is central airway obstructions assessed by spirometry testing?
What is the role of spirometry in predicting risk for surgical pulmonary complications?
What is included in pulmonary function testing for lung surgery assessment?
What the American Thoracic Society (ATS) spirometry performance standards?
What are synonyms for lung volume determination in pulmonary function testing?
What are the indications for lung volume determination in pulmonary function testing?
What are contraindications to lung volume determination in pulmonary function testing?
What is the patient preparation for lung volume determination in pulmonary function testing?
What is the role of lung volume determination in pulmonary function testing?
How are the results of a lung volume determination expressed in pulmonary function testing?
How are lung volume determination results interpreted in pulmonary function testing?
What are contraindications to a diffusing capacity of lung for carbon monoxide (DLCO) test?
What are the patient preparations for a diffusing capacity of lung for carbon monoxide (DLCO) test?
What is diffusing capacity of lung for carbon monoxide (DLCO) testing?
How is a diffusing capacity of lung for carbon monoxide (DLCO) test performed?
How does barometric pressure affect diffusing capacity of lung for carbon monoxide (DLCO) testing?
How is quality graded in diffusing capacity of lung for carbon monoxide (DLCO) testing?
How are diffusing capacity of lung for carbon monoxide (DLCO) results expressed?
How are diffusing capacity of lung for carbon monoxide (DLCO) test results interpreted?
What are synonyms for the assessment of respiratory muscle strength test?
What are indications for assessing respiratory muscle strength testing?
What are contraindications for assessing respiratory muscle strength testing?
What are patient requirements for assessing respiratory muscle strength testing?
How is respiratory muscle strength assessed in pulmonary function testing?
How is maximum inspiratory pressures (MIP) measured in pulmonary function testing?
How are maximum expiratory pressures (MEP) measured in pulmonary function testing?
How is sniff nasal-inspiratory force (SNIF) measured in pulmonary function testing?
How is the assessment of respiratory muscle strength expressed in pulmonary function testing?
How are results of respiratory muscle strength assessment interpreted in pulmonary function testing?
What are the synonyms for pulse oximetry in pulmonary function testing?
What are contraindications for pulse oximetry in pulmonary function testing?
What patient preparations are needed for pulse oximetry in pulmonary function testing?
How reliable are pulse oximetry findings?
How is pulse oximetry performed in pulmonary function testing?
How are pulse oximetry results expressed in pulmonary function testing?
How are pulse oximetry results interpreted in pulmonary function testing?
What are technical considerations for conducting pulse testing?
What is the accuracy of pulse oximetry?
What pulmonary function testing should be considered for suspected hypoxemia?
What are the advantages and disadvantages of pulse oximetry in pulmonary function testing?
Which factors influence the accuracy of pulse oximetry readings?
What are synonyms of methacholine challenge testing?
What are indications for methacholine challenge testing?
What are contraindications for methacholine challenge testing?
Which medications should be withdrawn prior to methacholine challenge testing?
What is the schedule for dosing in a methacholine challenge test?
How are results of methacholine challenge testing expressed?
How are results of methacholine challenge testing interpreted?
What are technical considerations for the performance of methacholine challenge testing?
What is the six-minute walk test (6mwt) in pulmonary function testing?
What are the indications for the six-minute walk test (6mwt) in pulmonary function testing?
What instructions should be given to the patient in a six-minute walk test (6mwt)?
What are the ATS/ERS technical standards for terminating a six-minute walk test (6mwt)?
When is repetition of a six-minute walk test (6mwt) indicated?
What are standard phrases of encouragement during a six-minute walk test (6mwt)?
How are results of the six-minute walk test (6mwt) interpreted?
What are synonyms for pulmonary function cardiopulmonary stress testing?
What are the indications for cardiopulmonary stress testing?
What are the contraindications for cardiopulmonary stress testing?
How are patient prepared for cardiopulmonary stress testing?
What is the role of cardiopulmonary stress testing in pulmonary function assessment?
How is the rate of workload incrementation determined in cardiopulmonary stress testing?
How are cardiopulmonary stress testing results expressed?
How are results of cardiopulmonary stress testing interpreted?
How is the cycle factor calculated for cardiopulmonary stress testing of sedentary men?
How is the cycle factor calculated for cardiopulmonary stress testing of sedentary women?
What are normal findings on a cardiopulmonary stress test?
How is the anaerobic threshold defined in a cardiopulmonary stress test?
How is the anaerobic threshold determined noninvasively in a cardiopulmonary stress test?
What are case examples of cardiopulmonary stress testing?
How is cardiopulmonary stress testing used in the preoperative evaluation for pneumonectomy?
What are technical considerations for the performance of cardiopulmonary stress testing?
What is a synonym for arterial blood gases?
When is arterial blood gases (ABGs) testing indicated?
What are the contraindication for arterial blood gases (ABGs) in pulmonary function testing?
What is the patient preparation for arterial blood gases (ABGs)?
What is the sampling site of choice for arterial blood gases (ABGs)?
How are results of arterial blood gases (ABGs) expressed?
How are arterial blood gases (ABGs) results interpreted?
What are normal arterial blood gases (ABGs) results?
What are possible causes of low levels of arterial oxygen in arterial blood gases (ABGs)?
How is hypoventilation assessed in pulmonary function testing?
How is right-to-left shunt determined by blood gases in pulmonary function testing?
What are technical considerations in the performance of arterial blood gases (ABGs)?
What is fractional exhaled nitric oxide (FENO) in pulmonary function testing?
What are indications for fractional exhaled nitric oxide (FENO) measurement?
How are fractional exhaled nitric oxide (FENO) measurements interpreted?
-
Flow-volume characteristics of technically correct and technically deficient spirometry.
-
This is a graph of lung volumes in health and in disease, showing the various lung subdivisions. Normal aging results in an increase in functional reserve capacity (FRC) and residual volume (RV) and a normal total lung capacity (TLC) percentage. Obstructive lung diseases cause hyperinflation (increase in RV and FRC) with a relatively normal forced vital capacity (FVC). In severe emphysema, the TLC percentage can exceed 150%, with the RV impinging on the FVC. Restrictive lung diseases exhibit reduced TLC percentage with relative preservation of the RV/TLC percentage in fibrosis, a reduced inspiratory capacity and expiratory reserve volume (ERV) in neuromuscular disease, and severe reduction of the ERV in extreme obesity.
-
Flow reduction must be consistent on every effort to be considered actual flow limitation. Fixed upper airway obstruction may be caused by postintubation stenosis, goiter, endotracheal neoplasms, and bronchial stenosis. Variable intrathoracic obstruction may be caused by tracheomalacia, polychondritis, and tumors of the lower trachea or main bronchus. Variable extrathoracic obstruction may be caused by bilateral and unilateral vocal cord paralysis, vocal cord constriction, reduced pharyngeal cross-sectional area, and airway burns.
-
Example of an acceptable spirometry testing session showing evidence 3 efforts that show evidence of an explosive start of forced exhalation that continues until empty and good repeatability of forced vital capacity (FVC) and forced expiratory volume in the first second of the forceful exhalation (FEV1), which usually indicates all efforts started from full inflation.
Tables
- Table 1. Summary of Acceptability, Usability, and Repeatability Criteria for FEV1 and FVC
- Table 2. Quality Categories for FVC or FEV1 in Adults and Children
- Table 3A. Lung Function
- Table 3B. Exercise
- Table 4A. Lung Function
- Table 4B. Exercise
- Table 5A. Lung Function
- Table 5B. Exercise
- Table 6.Use of FENO in Evaluation of Cough and/or Wheeze and/or Dyspnea [23]
- Table 7. Use of FENO for Monitoring (in Patients with Diagnosed Asthma) [23]
Acceptability and Usability |
Required for Acceptability |
Required for Usability |
||
Criterion |
FEV 1 |
FVC |
FEV 1 |
FVC |
Must have back extrapolated volume ≤5% of FVC or 0.100 L, whichever is greater |
+ |
+ |
+ |
+ |
Must have no evidence of a faulty zero-flow setting |
+ |
+ |
+ |
+ |
Must have no cough in the first second of expirationa |
+ |
- |
+ |
- |
Must have no glottis closure in the first second of expirationa |
+ |
+ |
+ |
+ |
Must have no glottis closure after 1 s of expiration |
- |
+ |
- |
- |
Must achieve one of these three end of forced expiration indicators:
|
- |
+ |
- |
- |
Must have no evidence of obstructed mouthpiece or spirometer |
+ |
+ |
- |
- |
Must have no evidence of a leak |
+ |
+ |
- |
- |
If the maximal inspiration following end of forced expiration is >FVC, then FIVC – FVC must be ≤ 0.100 L or 5% of FVC, whichever is greaterc |
+ |
+ |
- |
- |
Repeatability Criteria (applied to acceptable FVC and FEV1 values) |
||||
Age >6 y: Difference between two largest FVC values must be ≤0.150 L, and the difference between two largest FEV1 values must be ≤0.150 L |
||||
Age ≤6 y: Difference between two largest FVC values must be ≤0.100 L or 10% of the highest value, whichever is greater, and the difference between two largest FEV1 values must be ≤0.100 L or 10% of the highest value, whichever is greater |
||||
aFor children ≤6 y, must have at least 0.75 s of expiration without glottis closure or cough for acceptable or useable measurement of FEV0.75. bOccurs when the patient cannot expire long enough to achieve a plateau (eg, children with high elastic recoil or patients with restrictive lung disease) or the patient inspires or comes off the mouthpiece before a plateau. For within-maneuver acceptability, the FVC must be larger than or within the repeatability tolerance of the largest FVC observed before this maneuver within the current prebronchodilator or the current postbronchodilator testing set. cAlthough the performance of a maximal forced inspiration is strongly recommended, its absence does not preclude a maneuver from being judged acceptable, unless extrathoracic obstruction is specifically being investigated. |
||||
Grade |
Criteria for Adults, Older Children, and Children Aged 2-6 Years |
A |
> 3 acceptable efforts with repeatability within 0.150 L for age 2-6 y, 0.100 L, or 10% of highest value, whichever is greater |
B |
2 acceptable efforts with repeatability within 0.150 L for age 2-6 y, 0.100 L, or 10% of highest value, whichever is greater |
C |
> 2 acceptable efforts with repeatability within 0.200 L for age 2-6 y, 0.150 L, or 10% of highest value, whichever is greater |
D |
> 2 acceptable efforts with repeatability within 0.250 L for age 2-6 y, 0.200 L, or 10% of highest value, whichever is greater |
E |
One acceptable effort |
F |
No acceptable efforts |
Parameter |
Predicted |
Measured |
Age |
|
46 |
Sex |
|
Male |
Height (cm) |
|
188 |
Weight (kg) |
|
104 |
Hemoglobin |
|
15.4 |
VC (L) |
5.65 |
6.5 |
TLC (L) |
7.76 |
9.02 |
RV (L) |
2.17 |
2 |
FEV1 (L) |
4.47 |
5.01 |
FEV1/FEV (%) |
79 |
76 |
MVV (L/min) |
170 |
212 |
DLCO (mL/min/mm Hg) |
31.6 |
32.4 |
Parameter |
Predicted |
Measured |
Peak VO2 (L/min) |
3.05 |
3.03 |
Maximum HR (beats/min) |
174 |
182 |
Maximum O2 pulse (mL/beat) |
17.5 |
16.6 |
AT (L/min) |
>1.34 |
1.5 |
BP (mm Hg) (rest, maximum) |
|
120/68, 188/85 |
Maximum VE (L/min) |
|
129 |
Ventilatory reserve (L/min) |
>15 |
83 |
SpO2 (%) (rest, maximum) |
|
98, 98 |
Parameter |
Predicted |
Measured |
Age |
|
55 |
Sex |
|
Male |
Height (cm) |
|
173 |
Weight (kg) |
|
80 |
Hemoglobin |
|
15.6 |
VC (L) |
4.55 |
4.32 |
TLC (L) |
6.6 |
7.31 |
RV (L) |
2.04 |
3.56 |
FEV1 (L) |
3.63 |
2.68 |
FEV1/FEV (%) |
80 |
62 |
MVV (L/min) |
134 |
99 |
DLCO (mL/min/mm Hg) |
23.8 |
16.7 |
Parameter |
Predicted |
Measured |
Peak VO2 (L/min) |
2.32 |
1.39 |
Maximum HR (beats/min) |
165 |
122 |
Maximum O2 pulse (mL/beat) |
14.1 |
11.4 |
AT (L/min) |
>1.04 |
1 |
BP (mm Hg) (rest, maximum) |
|
117/85, 170/102 |
Maximum VE (L/min) |
|
93 |
Ventilatory reserve (L/min) |
>15 |
6 |
SpO2 (%) (rest, maximum) |
|
95/91 |
Parameter |
Parameter Predicted |
Measured |
Age |
|
48 |
Sex |
|
Female |
Height (cm) |
|
158 |
Weight (kg) |
|
55 |
Hemoglobin |
|
13.4 |
VC (L) |
3.13 |
2.1 |
TLC (L) |
4.79 |
3.57 |
RV (L) |
2.04 |
3.56 |
FEV1 (L) |
2.6 |
1.79 |
FEV1/FEV (%) |
83 |
85 |
MVV (L/min) |
98 |
85 |
DLCO (mL/min/mm Hg) |
18.9 |
20.6 |
Parameter |
Predicted |
Measured |
Peak VO2 (L/min) |
1.47 |
0.79 |
Maximum HR (beats/min) |
172 |
184 |
Maximum O2 pulse (mL/beat) |
8.5 |
4.3 |
AT (L/min) |
>0.69 |
0.62 |
BP (mm Hg) (rest, maximum) |
|
115/89, 165/88 |
Maximum VE (L/min) |
|
49 |
Ventilatory reserve (L/min) |
>15 |
26 |
SpO2 (%) (rest, maximum) |
|
96, 94 |
FENO < 25 ppb (< 20 ppb in children) |
FENO 25-50 ppb (20-35 in children) |
FENO >50 ppb (>35 ppb in children) |
|
Symptoms present in the past 6 weeks or longer |
- Eosinophilic airway inflammation unlikely - Consider alternative diagnoses - Unlikely to benefit from ICS |
- Interpret with caution - Consider clinical context - Monitor change in FENO over time - Consider variables like atopy and smoking |
- Eosinophilic airway inflammation present - Likely to benefit from ICS |
FENO < 25 ppb (< 20 ppb in children) |
FENO 25-50 ppb (20-35 in children) |
FENO >50 ppb (>35 ppb in children) |
|
Symptoms present |
- Consider alternative diagnoses - Unlikely to benefit from increase in ICS |
- Persistent allergen exposure - Inadequate ICS dose - Poor compliance - Steroid resistance |
- Persistent allergen exposure - Poor compliance or inhaler technique - Inadequate ICS dose - Risk for exacerbation - Steroid resistance |
Symptoms absent |
- Adequate ICS dose - Good compliance - Consider ICS taper |
- Adequate ICS dosing - Good compliance - Monitor change in FENO |
- ICS withdrawal or dose reduction may result in relapse - Poor compliance or inhaler technique |

What would you like to print?
- Spirometry
- Lung Volume Determination
- Diffusing Capacity of Lung for Carbon Monoxide
- Assessment of Respiratory Muscle Strength
- Pulse Oximetry
- Methacholine Challenge Testing
- Six-Minute Walk Test
- Cardiopulmonary Stress Testing
- Arterial Blood Gases
- Exhaled Nitric Oxide
- Questions & Answers
- Show All
- Media Gallery
- Tables
- References