Practice Essentials
It is essential to obtain an accurate assessment of antenatal fetal weight owing to potential complications that can arise from low and excessive fetal birth weight during labor and the puerperium.
Low and excessive fetal birth weight
Perinatal complications associated with low birth weight are primarily associated with fetal prematurity or intrauterine growth restriction. A common classification for underweight newborns is based on birth weight alone:
-
Low birth weight: 1501-2500 g
-
Very low birth weight: 1001-1500 g
-
Extremely low birth weight: 500-1000 g
Although excessive birth weight has had varied definitions, in general, a birth weight over 4000 g is considered fetal macrosomia. Perinatal complications associated with excessive birth weight include the following:
-
Shoulder dystocia
-
Brachial plexus palsy
-
Bone injuries/fracture
-
Prolonged labor
-
Birth asphyxia/low Apgar scores
-
Forceps/vacuum extraction
-
Birth canal/perineal lacerations
-
Postpartum hemorrhage
-
Cephalopelvic disproportion
-
Cesarean delivery
Birth weights vary
Mean birth weight can be described as a function of gestational age. Standard fetal-growth curves are used to estimate the range of expected fetal weight for populations of women at any particular gestational age, but they are not applicable to specific individual women because of variations in fetal weight and in birth weights in neonates among different racial groups.
Perhaps the best methods for establishing the reference range of term birth weight are to examine fetal weights at the 2 extremes of the range (ie, below the 5th percentile) and to define the point at which newborns begin to substantially vary from the mean with respect to their prevalence of perinatal complications and perinatal death.
Factors that influence birth weight
Endogenous and extrinsic factors such as the following can affect fetal birth weight:
-
Gestational age at delivery, fetal sex
-
Maternal race, height, weight, parity, pregnancy weight gain and physical activity, hemoglobin concentration, tobacco use, uncontrolled diabetes, hypertension, preeclampsia
-
Paternal height
-
Ambient altitude
Techniques to estimate fetal weight
The accuracy of different methods for predicting fetal weight depends on the gestational age and the range of birth weights under study. However, currently available methods for assessing fetal weight in utero are subject to substantial predictive errors, particularly at the 2 extremes of fetal weight (eg, < 2500 g, likely the product of premature deliveries, and >4000 g, at risk for the complications associated with fetal macrosomia). These methods include the following:
-
Tactile assessment
-
Clinical risk factor assessment
-
Maternal self-estimation
-
Obstetric ultrasonography
Importance of Antenatal Fetal Weight Estimation
Both low birth weight and excessive fetal weight at delivery are associated with an increased risk of newborn complications during labor and the puerperium. [1, 2, 3, 4, 5, 6, 7, 8, 9, 10, 11, 12, 13, 14, 15, 16, 17]
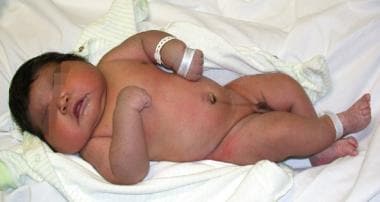
The perinatal complications associated with low birth weight are most often attributable to fetal prematurity, but may sometimes also arise as the result of intrauterine growth restriction. [2, 3, 5, 18] For macrosomic fetuses (see the image below), potential complications associated with delivery include shoulder dystocia, brachial plexus injuries, bony injuries, and intrapartum asphyxia, as well as maternal risks that include birth canal injuries, pelvic floor injuries damage, and postpartum hemorrhage (see Table 1). [1, 6, 7, 8, 9, 10, 11, 12, 13, 14, 15, 16, 17]
The occurrence of cephalopelvic disproportion is more prevalent with increasing fetal size and contributes to an increased rate of both operative vaginal delivery and cesarean delivery for macrosomic fetuses compared with fetuses of normal weight. [1, 11, 12, 13, 14, 15, 16, 17, 19]
In a study comparing the prevalence of perinatal complications for fetuses weighing >4,000 g at birth (n = 36,462) to those who weighed 2,500-4,000 g (n = 293,822) in the northwest Thames region of England (1988-1998), there was a statistically significantly increased rate for macrosomic newborns of prolonged labor (OR = 1.57 for the first stage >10 hours and OR = 2.03 for the second stage >2 hours), perineal trauma (OR = 1.44 for a second degree laceration and OR = 2.73 for a third degree laceration), instrumented vaginal delivery (OR = 1.76), emergency Cesarean section (OR = 1.84), postpartum hemorrhage (OR = 2.01), Apgar score < 4 (OR = 1.35), and neonatal special care nursery admission (OR = 1.51). [1]
In another study that examined the relationship between increasing birth weight and perinatal mortality among 5,049,104 liveborns in the United States between 1995-2000, a nadir was observed at approximately 3,900 g and a sharp rise occurred for newborns with higher weights (see the image below). [20] Thus, depending on many factors, the optimal birth-weight range to minimize the risk of fetal and maternal morbidity and mortality is between 3000-4000 g. [3, 5, 18, 20]
A study by Lee et al estimated the prevalence of small for gestational age birth and attributable neonatal mortality in low and middle income countries with the INTERGROWTH-21st birth weight standard. The study reported that in low and middle income countries, approximately one in five infants are born small for gestational age, which is attributable for 21.9% of neonatal deaths. [21]
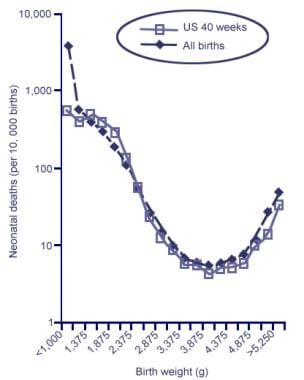 Neonatal Mortality by Birth Weight among Singleton Livebirths in the United States from 1995-2000 (n = 5,049,104, analyzed in 250-g categories). A nadir occurs at approximately 3,900 g and rises sharply thereafter. Data for all livebirths [dotted line] and livebirths at 40 weeks of gestation [solid line]). Adapted from Basso O, Wilcox AJ, Weinberg CR. Birth Weight and Mortality: Causality or Confounding? Am J Epidemiol 2006;164(4):303-11.
Table 1. Newborn and Maternal Complications Associated With a Birth Weight Greater Than 4000 g [6, 7, 8, 9, 10, 11, 12, 13, 14, 15, 22, 23, 24] (Open Table in a new window)
Complication |
Relative Risk |
Attributable Risk, % |
Shoulder dystocia |
2-38 |
2-18 |
Brachial plexus palsy |
16-216 |
0.2-8 |
Bony injuries/fracture |
1.4-97 |
0.2-6 |
Prolonged labor |
2.2-3.2 |
2-7 |
Birth asphyxia/low Apgar scores |
1.7-5.6 |
0.6-6 |
Forceps/vacuum extraction |
1.5-3.6 |
8-14 |
Birth canal/perineal lacerations |
1.6-5.1 |
3-7 |
Postpartum hemorrhage |
1.6-5.2 |
2-5 |
Cephalopelvic disproportion |
1.9-2.2 |
4-5 |
Cesarean delivery |
1.2-2.9 |
4-14 |
Note: Data compiled from 13 studies of the relative and attributable risk of complications associated with the birth of macrosomic fetuses. Reported ranges reflect the differences among studies in the patient populations and differences in the criteria used for the diagnosis of each complication. Relative and attributable risks are for fetuses weighing 4000 g or more at delivery compared with control subjects weighing less than 4000 g. P values associated with each relative risk are less than .001 in all cases, except for birth canal/perineal lacerations, for which P is less than .05. |
||
In a study that examined shoulder dystocia-related permanent fetal injury as a function of birth weight, the absolute risk of fetal damage increased suddenly and dramatically at a threshold of 4,000 g from 1 in 1,368 deliveries to 1 in 275 deliveries (5-fold increase in risk) (see Table 2) [25]
Table 2. Adjusted Risk of Shoulder Dystocia-Related Permanent Fetal Injury as a Function of Increasing Birth Weight (Open Table in a new window)
Birth Weight, g |
Total Births in the US in 1998, % |
Cases with Permanent Fetal Injuries, % |
Absolute Risk of Fetal Damage |
95% CI for Fetal Damage (Upper Bound) |
< 3000 |
24 |
2 |
1: 12,000 |
1: 6,000 |
3000-3249 |
17 |
2 |
1: 8,500 |
1: 4,150 |
3250-3499 |
20 |
4.5 |
1: 4,444 |
1: 2,740 |
3500-3749 |
16 |
12 |
1: 1,333 |
1: 994 |
3750-3999 |
13 |
9.5 |
1: 1,368 |
1: 977 |
4000-4249 |
5.5 |
20 |
1: 275 |
1: 222 |
4250-4499 |
3 |
14 |
1: 214 |
1: 165 |
4500-4749 |
0.8 |
14 |
1: 57 |
1: 43 |
4750-4999 |
0.3 |
8 |
1: 37 |
1: 25 |
5000-5249 |
0.2 |
8 |
1: 25 |
1: 18 |
=5250 |
0.2 |
6 |
1: 33 |
1: 23 |
Adapted from Iffy, 2008 [25] |
||||
Limiting the potential complications associated with the birth of both small and excessively large fetuses requires an accurate estimation of fetal weight before delivery. This article reviews the factors that influence fetal growth and the methods that can be used to accurately estimate fetal weight.
Standard Fetal Growth Curves
Mean birth weight can be described as a function of gestational age. [2, 3, 4, 5, 18, 26, 27, 28, 29, 30, 31, 32, 33, 34, 35, 36, 37, 38, 39, 40] Several reports subdivide such results into those that apply to women of different races, [4, 26, 27, 28, 29, 30] to male versus female fetuses, [4, 26, 27, 28, 29, 30, 31, 33, 35, 38, 41] and to primiparous versus multiparous status. [27, 28, 41] Some have further stratified the data, creating specific curves and tables for women of different heights and weights.
Standard fetal growth curves are useful for estimating the range of expected fetal weight for populations of women at any particular gestational age. However, these curves are applicable only to populations of gravidas and not to individuals. Although population estimates of fetal weight as a function of gestational age can be made for groups of individuals that are demographically similar to the reference population from which the original data was obtained (eg, the median weight as a function of gestational age, as well as the standard deviation and 95% confidence interval for each gestational age-dependent point estimate), this information cannot be applied successfully to any particular gravida. In addition, all such tables presuppose that the gestational age of the fetus is adequately established; without proper gestational dating, fetal growth curves cannot be appropriately applied even to groups of gravidas.
The principal limitations of standard fetal-growth curves that are derived from population-based studies are the following:
They apply only to fetuses of normal size for their gestational age and not to those with clinically significant (and potentially pathologic) growth abnormalities.
The data from which they are derived are highly population dependent.
The standard deviation (SD) associated with the estimated mean birth weight for any particular gestational age is wide, typically exceeding 450-500 g. [4, 26, 30, 32, 33]
The 95% confidence interval (CI) for fetal-weight estimates are >1600 g at term (ie, ±800 g [±1 lb 12 oz], or ±23%). [29, 31, 32, 38]
The gestational age of the fetus must be known with a high degree of accuracy to reliably use the growth curves.
In general, standard fetal-growth curves can be expected to apply to large populations of pregnant women who have well-dated pregnancies, but the limits of their predictive accuracy make them less-than-ideal tools for estimating fetal weight in individual patients. In addition, fetal-growth curves are the most inaccurate at the extremes of fetal weight, which are the most clinically relevant situations in which they are used (eg, in fetuses that are either growth restricted or macrosomic). The accurate estimation of fetal weight is most necessary for fetuses with suspected significant deviations of intrauterine growth. Unfortunately, standard fetal growth curves are of little value in assessing major deviations in fetal weight for these women in advance of delivery.
To complement the World Health Organization’s (WHO’s) international growth standards for children younger than 5 years, Villar et al developed international standards for fetuses and newborns as well as for preterm infants in the postnatal growth period by using data from 20,486 gravidas, a subset of pregnant women in the Newborn Cross-Sectional Study (NCSS) from the multinational population-based INTERGROWTH-21st Project. [42] The investigators calculated sex-specific observed and smoothed centiles for the parameters of birth weight, length, and head circumference for gestational age at birth (the observed and smoothed centiles were nearly identical) and created 3rd, 10th, 50th, 90th, and 97th centile curves for the same parameters on the basis of gestational age and sex. The investigators used strict eligibility criteria for the fetuses and infants to develop the newborn standards, including (1) excluding fetuses with congenital abnormalities or at high risk of fetal growth impairment and unhealthy gravidas or those with inadequate prenatal care or clinical complications that could affect fetal growth; (2) ensuring population-based, multiethnic, multicountry, and sex-specific standards were consistently similar and could be pooled; (3) applying as uniform and standardized research and equipment processes, techniques, systems, and monitoring as possible across all study sites; (4) following the analytic approach constructed by the WHO’s Multicenter Growth Reference Study (MGRS); and (5) presenting the centiles for sex and gestational age parameters with corresponding fetal growth standards. [42]
A study by Mikolajczyk et al created a generic reference for fetal weight and birthweight percentiles. The study used the fetal weight reference developed by Hadlock and colleagues and the notion of proportionality proposed by Gardosi and colleagues. It also made the weight reference easily adjustable according to the mean birthweight at 40 weeks’ gestation for any local population. The generic reference created showed better ability to predict adverse perinatal outcomes than noncustomized fetal weight references. [43]
What is the Normal Range for Human Birth Weight?
Deviations in fetal weight
The diagnosis of clinically significant deviations in fetal weight is based on the presupposition that the reference range for fetal weight at each gestational age is established. Before a reference range for a human birth weight can be properly determined, the gestational age of the pregnancy must first be defined because fetal weight increases rapidly after the second trimester of pregnancy. [28]
Variations in fetal weight
The normal gestational age for the spontaneous delivery of human pregnancies is well accepted as 280 days (40 wk) from the first day of the last normal menstrual period (266 d after ovulation). [44] Because fewer than 3% of births occur at precisely 40 weeks' gestation and because the SD for term pregnancies is 1 week, the normal range of term birth weight is typically referenced to the mean birth weight for pregnancies delivered at 38-42 weeks' gestation (ie, mean term gestational age ±2 SDs).
During this 4-week interval, the typical fetus gains approximately 12.7 ±1.4 g/day, with a difference of ±0.3 g/day depending on the sex of the fetus (male fetuses gain weight more rapidly than female fetuses.) [45] The average birth weight during this period varies substantially and depends on many factors, including maternal race, size, parity, pregnancy weight gain, glucose tolerance, hematocrit, and ambient elevation. [4, 26, 27, 28, 29, 30, 46, 47, 48, 49, 50, 51, 52, 53, 54, 55, 56, 57, 58, 59]
In the United States, a study of 56,728 singleton births from 1975-1992 showed that the mean birth weight at 38-42 completed weeks' gestation was 3060-3520 g (range, 460 g [1 lb]). [30] In Great Britain, a similar study of 41,718 newborns showed that the average was 3201-3753 g (range, 551 g [1 lb 3 oz]). [4] In Singapore, a study of 11,026 neonates showed that the average was 2880-3290 g (range, 410 g [14 oz]). [36]
Because birth-weight data from population studies are often non-normally distributed, the median birth weight at each gestational age is reported. In Canada, for live births recorded in 1986-1988, the median term birth weight at 38-42 weeks' gestation for 557,359 male singleton births was 3290-3800 g (range, 510 g [1 lb 2 oz]). [31] In the United States, for 38,818 term male births in 1984-1991, the median birth weight was 3020-3572 g (range, 552 g [1 lb 3 oz]). [26] In Sweden, for 32,087 term male births in 1956-1957, the median birth weight was 3300-3790 g (range, 490 g [1 lb 1 oz]). [38]
Birth weights of women from different racial groups
Median term birth weights of neonates born to women from different racial groups differ substantially. Median birth weights were compared in 17,347 newborns of Caucasian and African American women of low socioeconomic status in the United States from 1959-1966. At 40 weeks' gestation, live-born Caucasian male singleton fetuses had a median weight of 3350 g compared with 3210 g for African American male neonates (difference of 140 g). A similar difference in median birth weight was also evident among female offspring. Caucasian female newborns at 40 weeks' gestation had a median birth weight of 3210 g, and African American female neonates had a median birth weight of 3100 g
(difference of 110 g). [29]
Best method to determine the reference range for term birth weight
Perhaps the best method for defining the reference range of term birth weight is to examine fetal weights at the 2 extremes of the range (ie, below the 5th -10th percentile and above the 90th -95th percentile). In the United States, a comprehensive study of 3,134,879 live births in 1991 showed that, at 38-42 weeks' gestation, the 5th percentile of birth weight was 2543-2764 g, the 10th percentile was 2714-2935 g, the 90th percentile was 3867-4098 g, and the 95th percentile was 4027-4213 g. [34]
Several studies from the last half of the 20th century demonstrated consistent results, showing that the 10th percentile of birth weight over the range of gestational ages listed above was 2430-3152 g, whereas the 90th percentile was 3600-4360 g. [4, 26, 28, 30, 32] The most consistent feature of all these studies was the wide range of birth weights in the 5th -95th percentile. This range is equivalent to defining the empirical 90% CI for normal birth weight and, in the case of the most recent large-scale American study from 1991, this range is >1400 g (3 lb 1 oz). [34] By using an 80% CI as an alternate measure, this range narrows to approximately 1100 g (2 lb 7 oz). These findings suggest that the reference range of birth weight at term might be defined as 3450 ±700 g (2750-4150 g, or 6 lb 1 oz to 9 lb 2 oz).
Table 3 shows specific birth weights associated with the different percentile ranks from 11 large studies.
Table 3. Term Birth-Weight Percentiles for Singleton Live Births at 40 Weeks' Gestation (Open Table in a new window)
Author |
Location |
No. of Newborns |
10th Percentile |
50th Percentile |
90th Percentile |
Maternal Race |
|
Alexander et al, 1996 |
United States |
3,134,879 |
2929 |
3495 |
4060 |
NA |
|
Amini et al, 1994 |
Ohio |
56,728 |
2785 |
3320 |
3910 |
53% White, 44% Black, 3% Other |
|
Wilcox et al, 1993* |
Great Britain |
41,718 |
3000 |
3520 |
4100 |
93% White, 3% Black, 4% Other |
|
Ott et al, 1993* |
St Louis, Mo |
5757 |
2988 |
3638 |
4216 |
NA |
|
Dombrowski et al, 1992 |
Detroit, Mich |
33,073 |
2820 |
3345 |
3935 |
19% White, 81% Black |
|
David et al, 1983 |
North Carolina |
190,830 |
2830 |
3380 |
3960 |
76% White, 23% Black, 1% Other |
|
Brenner et al, 1976 |
Ohio |
30,772 |
2750 |
3280 |
3870 |
53% White, 46% Black, 1% Other |
|
Cheng et al, 1972 |
Singapore |
26,000 |
2660 |
3180 |
3710 |
100% Chinese |
|
Babson et al, 1970 |
Portland, Or |
39,895 |
2880 |
3448 |
4045 |
95% White, 5% Other |
|
Gruenwald et al, 1966 |
Baltimore, Md |
13,327 |
2720 |
3260 |
3850 |
NA |
|
Lubchenco et al, 1963 |
Denver, Co |
5635 |
2630 |
3230 |
3815 |
100% White |
|
NA = not applicable *Ultrasonographically dated |
|||||||
Perhaps the best method for establishing the reference range of term birth weight is to define the point at which newborns begin to substantially vary from the mean with respect to their prevalence of perinatal complications and perinatal death. Even within neonatal groupings that are well matched for gestational age, poor perinatal outcomes occur most frequently in fetuses who are born with weights at the extreme ends of the range (ie, < 10th percentile and >90th percentile for each gestational age). [2, 3, 18] By using this approach to establish a criterion, the reference range of term birth weight can be defined somewhat narrowly as about 3250-4250, or 3750 ± 500 g (7 lb 3 oz to 9 lb 6 oz). [3, 5, 18]
Data from a British cohort study of 3599 neonates born in 1946 suggested that increasing term birth weight is positively correlated with cognitive ability in later life. [60] This result persisted even after neonates of low birth weight (< 2500 g) were excluded from analysis, so that all of the remaining neonates weighed 2500-5000 g.
Definitions of Deviations in Fetal Growth
Categories of fetal weight
Fetal weight may be characterized as falling into 1 of 3 categories: (1) reference range (generally defined as the 10th -90th percentile for gestational age), (2) small for gestational age (< 10th percentile), or (3) large for gestational age (>90th percentile).
Until a fetus is delivered, only methods that help in evaluating fetal size in utero are of any value in assigning the fetus to these categories. Depending on the patient population that was evaluated to establish the percentiles, the standards may be misleading if they are applied to other sets of pregnant women. For instance, if standard birth-weight curves for Caucasian women are inappropriately applied to African American women, the proportion of newborns who appear to have birth weights below the 10th percentile is higher for African American neonates than for an appropriately matched group of Caucasian neonates.
Complications
Various authors in different eras have used the term low birth weight to refer to different ranges of fetal weight. Although excessive neonatal morbidity and mortality was once associated with newborns weighing 2000-2500 g, [5] advances in neonatal care during the last quarter century have improved adverse neonatal outcomes attributable to low birth weight.
One modern classification scheme for underweight newborns is based on fetal weight alone. By using this schema, newborns can be categorized by weight to assess their risk for neonatal complications, as follows: (1) low birth weight (1501-2500 g), (2) very low birth weight (1001-1500 g), or (3) extremely low birth weight (500-1000 g).
Subclassifications in these weight groups are possible according to the incidence of neonatal morbidity and mortality in each group and the gestational age of the newborns (especially those with very low or extremely low birth weight). [3] Successfully and accurately classifying fetuses in each of these three broad categories before delivery can help in predicting and possibly avoiding neonatal complications in underweight newborns.
Fetal macrosomia
The term fetal macrosomia denotes a fetus that is too large (see the image below).
In ideal usage, this designation should be referenced to the mean fetal and maternal dimensions in a given population; however, it has been arbitrarily and variously defined as a birth weight >4000 g (8 lb 13 oz), >4100 g (9 lb), >4500 g, or >4536 g (10 lb) for all pregnant women, depending on the author and era. [9, 11, 12, 13, 14, 15, 16, 17, 61] When fetal macrosomia is considered a birth weight of >4000 g, it affects 2-15% of all pregnant women, depending on the racial, ethnic, and socioeconomic composition of the population under study. [9, 11, 12, 13, 14]
What we would like to know before delivery
Two issues concerning the size of a fetus before delivery are of interest to clinicians: the absolute size and relative size of the fetus.
The first issue is absolute fetal size (ie, actual fetal dimensions and/or fetal weight). This information is important in estimating the risk of perinatal morbidity and mortality, but it is difficult to assess accurately before delivery.
The second is the relative size of the fetus (relative fetal dimensions and/or fetal weight) compared with data from some reference group. This is important for determining whether there is either intrauterine growth restriction or fetal macrosomia relative to a standard that has previously been established for a particular group of women (both of which are also predictors of perinatal morbidity and mortality). These determinations are difficult to establish accurately before delivery because they depend not only on the accurate estimation of absolute fetal size and/or weight, but also on the choice of an appropriate reference group for comparison. Thus, the accurate determination of relative fetal size and/or weight is a particularly challenging but necessary prerequisite for allowing the absolute fetal size and/or weight to be interpreted within the context of a clinically meaningful framework.
Factors Contributing to Differences in Fetal Weight
Many factors, both endogenous and extrinsic, can influence fetal weight. These encompass maternal factors (eg, race, stature, genetics), [4, 26, 27, 28, 29, 30, 36, 37, 41, 46, 48, 62, 63] paternal factors (eg, paternal height), [64, 65, 66, 67, 68, 69, 70, 71, 72] environmental influences (eg, altitude, availability of adequate nutrition, degree of physical activity), [46, 47, 49, 50, 51, 52, 53, 54, 73, 74] physiologic factors (eg, altered glucose metabolism, hemoglobin concentration, microvascular integrity), [75, 76, 77, 78, 79] pathologic factors (eg, hypertension, uterine malformations), [80, 81, 82] and complications of pregnancy (eg, gestational diabetes mellitus, preeclampsia). [11, 79, 82, 83, 84, 85, 86]
In a systematic review of 36 studies, Shah found that, in addition to paternal height, characteristics associated with low birth weight include extreme paternal age and paternal lower birth weight. Possible associations with low birth weight were paternal occupational exposure and low levels of education. [87]
Gestational age at delivery
Gestational age at delivery is the most significant determinant of newborn weight. [59, 62] Preterm delivery is the leading cause of low birth weight newborns in the United States. Other potential causes for low birth weight can collectively be attributed to IUGR (previously termed intrauterine growth retardation). Causes of IUGR include intrauterine infections, congenital syndromes, genetic abnormalities, and chronic uteroplacental insufficiency. [88]
In the case of postdate gestations, the rate of fetal macrosomia is 17-29%, as compared with 2-15% for the general population delivering term pregnancies. The rate of fetal macrosomia increases steadily with advancing gestational age beyond 37 weeks of pregnancy (see Table 4). Consistent with this observation, 99% of fetuses that weigh >4000 g are delivered at >37 weeks' gestation.
Table 4. Rates of Fetal Macrosomia (>4000 g) as a Function of Gestational Age (Open Table in a new window)
Completed Gestational Week |
Fetal Macrosomia, % |
37 |
2.1 |
38 |
4.8 |
39 |
8.2 |
40 |
12.3 |
41 |
15.8 |
42 |
21 |
Adapted from Boyd, 1983 [12] |
|
Maternal race
A systematic difference is observed in the mean birth weight of babies born to mothers of different races and ethnicities. Depending on the mother's race, mean birth weights differ by as much as 141-395 g at term. Although some of this difference may be attributed to systematic differences in the mean gestational age of fetuses at delivery, systematic racial differences in maternal characteristics (eg, maternal height, weight, glucose tolerance, etc) [89] , and differences in the prevalence of various diseases and complications of pregnancy that occur in different populations, an additional disparity in birth weight is attributable to racial differences per se.
The precise cause of this effect is unknown, but it may be related to genetic or metabolic differences in fetal-growth potential for women of different races. Because of this effect, properly characterizing the race of mothers is important to accurately predict birth weights.
As an example, African American and Asian women have fetuses that are smaller than those of Caucasian women when appropriately matched for gestational age. [4, 26, 29, 36, 37, 46, 48, 90, 91] If a single birth-weight standard is used, Caucasian women have a significantly higher prevalence of fetal macrosomia compared with that of African American and Asian women, [13, 14, 37, 48] and women from these latter groups have a significantly higher prevalence of small-for-gestational-age newborns compared with that of Caucasian women.
Other parental, environmental, and pregnancy-specific determinants
After gestational age and maternal race, several other major parental, environmental, and pregnancy-specific determinants of birth weight are relevant for mothers with otherwise uncomplicated pregnancies (see Table 5). These include the following: (1) maternal height, (2) maternal obesity, (3) maternal pregnancy weight gain, (4) parity, (5) fetal sex, (6) ambient altitude, (7) maternal hemoglobin concentration, (8) paternal height, (9) cigarette smoking, and (10) glucose tolerance. [12, 13, 14, 15, 45, 46, 48, 49, 54, 55, 56, 57, 58, 59, 72]
Taken together, these measurable factors can explain more than two fifths of the variance in term birth weight. [59, 92] In addition, several other major environmental factors can adversely affect fetal weight. Malnutrition is chief among these. In third-world countries where poverty among reproductive-aged women is prevalent, malnutrition is a common factor that can substantially affect the size of neonates at all gestational ages.
Table 5. Routinely Measurable Parental and Pregnancy-Specific Demographic Factors That Influence Fetal Weight [54, 55, 56, 59, 72] (Open Table in a new window)
Parental or Pregnancy-Specific Factor |
First-Order Correlation With Birth Weight* |
Gestational age at delivery |
0.27-0.41 |
Maternal weight at 26 weeks |
0.30-0.39 |
Maternal weight at term |
0.36-0.37 |
Maternal prepregnancy weight |
0.23-0.27 |
Maternal pregnancy weight gain |
0.15-0.31 |
Maternal height |
0.22-0.26 |
Maternal body mass index (BMI) |
0.16-0.27 |
Maternal age |
0.01-0.14 |
Parity |
0.01-0.19 |
Maternal hemoglobin concentration |
-0.15 to -0.17 |
Paternal height |
0.14-0.23 |
Fetal sex |
0.13-0.19 |
1-h 50-g glucose screening result |
0.04-0.09 |
* Ranges represent findings from 5 peer-reviewed studies. All first-order correlations with term birth weight were statistically significant at the P less than .05 level, except for the 1-h 50-g glucose result. Patients with diabetes mellitus were excluded from all analyses. |
|
Maternal height
Maternal height is an easily measurable physical characteristic that is positively correlated with term fetal weight. [45, 55, 56, 57, 58, 59, 93] Although lifestyle choices can potentially modify other maternal physical features (eg, maternal weight and BMI), maternal height is arguably the single best measure of native human-size potential.
Barring special circumstances (eg, malnutrition in childhood, scoliosis, intrinsic bone disease) adult height is a trait that has genetic underpinnings that are generationally transmissible. Family pedigree studies have shown that, on average, "big people have big babies and small people have small ones." One would be intuitively challenged to argue with this line of reasoning, and data from numerous studies have independently confirmed the direct relationship of maternal height to the birth weight of offspring.
Maternal obesity
The level of maternal obesity independently influences fetal weight such that the more a mother weighs, the larger her fetus is likely to be. This occurs because maternal weight and fetal weight are directly related, and women with high BMIs are at increased risk for developing diabetes during pregnancy (see Diabetes mellitus below). [93]
Maternal pregnancy weight gain
Maternal pregnancy weight gain is important with regard to fetal growth, such that the greater the weight gain is, the larger the fetus is likely to be. Weight gain during pregnancy is generally proportional to the caloric intake of a mother and, the greater the number of calories consumed, the more is available for incorporation into the developing tissues of the fetus. In addition, increased pregnancy weight gain is associated with an increased risk of developing gestational diabetes (see Diabetes Mellitus below).
Parity
Parity is directly and independently associated with fetal size. The greater the maternal parity, the larger the fetus is likely to be. Maternal parity is closely linked to maternal age, but once maternal parity is specified, maternal age is not an independent predictor of fetal weight. At term, a fetus typically gains 0.2-0.5 g/day for each increase of 1 in maternal parity.
Fetal sex
Female fetuses are systematically smaller than males when appropriately matched for gestational age and other factors, although the precise cause for this difference is unknown. [12, 13, 14, 15, 16, 19, 48, 49, 75, 78, 79, 83, 94] Fetal sex is associated significantly with birth weight and independently accounts for approximately 2% of the variance. [59] Female fetuses are smaller than male fetuses when matched for gestational age and for all other known factors that influence fetal weight. On average, male fetuses weigh more than females by 136 g (5 oz) at term.
Ambient altitude
Ambient altitude predictably influences fetal weight such that, when controlled for all other variables, an increase in altitude of 1000 m accounts for a reduction in term birth weight of 102-145 g. [49, 50, 51, 52, 54] In addition, adult hemoglobin concentrations increase by 1.52 g/dL for every 1000-m increase in ambient altitude. [54] The dependence of fetal weight on ambient altitude is independent of all other factors that can influence fetal weight. The magnitude of the effect of altitude on fetal weight is -30 to -43 g per 1000 feet above sea level at term.
Several potential explanations have been proposed for the inverse relationship between increasing altitude and fetal weight; they include (1) the decrease in oxygen tension with increasing altitude, (2) the increase in maternal hemoglobin concentration with increasing altitude, and/or (3) the decrease in maternal plasma volume with increasing altitude.
Maternal hemoglobin concentration
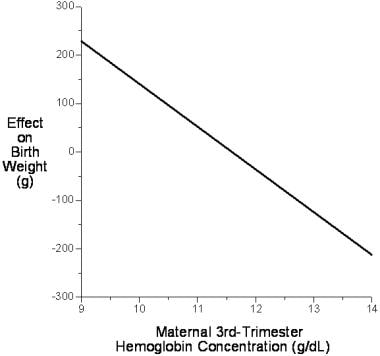
Maternal hemoglobin concentration at constant altitude independently explains 2.6% of the variance in birth weight, apart from all other known predictive variables. The relationship between birth weight and circulating maternal hemoglobin concentration is inverse, such that for each 1.0-g/dL increase in maternal hemoglobin concentration, term birth weight is reduced by 89 g (see the image below). [54]
This effect may be as the result of changes in blood viscosity. Blood is a highly non-Newtonian fluid that has a rapid nonlinear rise in viscosity with increasing hematocrit. Increasing viscosity tends to retard the rate of blood flow through small vessels, including those in the placental bed, raising extraction ratios and lowering solute gradients. This effect may partly explain why increasing altitude (which increases circulating hematocrit and hemoglobin concentrations) results in progressively lower mean birth weights.
Paternal height
Paternal height is the only routinely measured paternal demographic variable that has significant influence on fetal weight, [64, 65] but it accounts independently for less than 2% of the variance (10 g/cm of fetal weight at term). [72] Offspring of fathers with heights 2 SDs above or below the mean have a term birth weight that is increased or decreased by 125 g, respectively. Normal variability in paternal height explains an independent portion of the variance in term birth weight of up to 250 g that other maternal, environmental, or pregnancy-specific factors do not account for. [72] Paternal weight and BMI, which are acquired traits and which depend on lifestyle choices and behaviors, do not independently influence fetal weight. Paternal age also has no effect on birth weight up to at least the age of 60 years.
Cigarette smoking
Cigarette smoking during pregnancy both increases maternal hemoglobin concentrations and systematically lowers term birth weight by 12-18 g per cigarette smoked per day. [4, 49, 63, 95, 96, 97, 98] That is, a mother who smokes 1 pack per day will likely have a baby with a mean birth weight reduction of 240-360 g at term.
Physical activity during pregnancy
The effect of aerobic physical activity during pregnancy on term birth weight was recently assessed in 51 healthy, nonsmoking women who completed uncomplicated pregnancies (mean gestational age at delivery 39.4±1.21 weeks [range 36-42 wk], mean birth weight 3,695±517 g [range 2,743-4,943 g]). [74] The degree of aerobic physical activity (as assessed by accelerometry at 20 and 32 wk) was strongly and inversely correlated with fetal growth (r - 0.42; P< .002).
Infants born to women in the highest quartile of physical activity weighed a mean of 608 g less than infants born to women in the lowest physical activity quartile. Maternal weight gain did not modify the association of physical activity with fetal growth. Based on this, the study's authors concluded that "aerobic physical activity during mid-to-late pregnancy accounted for 18% of the variance in fetal growth." However, the independence of this effect from other factors that can influence fetal growth was not established.
Diabetes mellitus
Uncontrolled maternal diabetes mellitus is commonly associated with excessive fetal weight. [11, 85, 86] Glucose is the primary substrate fetuses require for growth. [85] When maternal glucose levels are excessive, abnormally high rates of fetal growth can be expected. Compared with the baseline rate of fetal macrosomia of 2-15% in the general population (depending on the group studied), the rate among mothers with poorly controlled gestational diabetes is elevated (20-33%). Because of routine glucose screening during pregnancy and the stringent glucose criteria now used to monitor and treat women who have diabetes during pregnancy, undiagnosed and poorly controlled gestational diabetes mellitus are now unusual, and the rate of macrosomia among women with frank gestational diabetes has recently diminished. [64, 79]
Even in women without diabetes mellitus, elevated glucose levels in pregnancy predispose their fetuses to increased birth weight. [76, 77, 78] The subgroups of women at highest risk for fetal macrosomia are those who are unmonitored and untreated, those who have an abnormal 1-hour glucose result during pregnancy and a subsequent normal 3-hour glucose tolerance test, and those who have a single abnormal value indicative of only mild glucose intolerance. [77, 78]
Other maternal illnesses and complications of pregnancy
Several maternal illnesses and complications of pregnancy are associated with decreased birth weight. The most common are chronic maternal hypertension and preeclampsia. [81, 82, 83, 84] Chronic maternal hypertension is associated with a mean decrement in birth weight of 161 g at term. For mild preeclampsia, the mean reduction is at least 105 g. When severe preeclampsia or HELLP syndrome is a complication, an additional and generally less predictable downward adjustment in fetal weight must be made.
Some maternal connective-tissue diseases, intrauterine infections (eg, viral, parasitic, bacterial), chromosomal abnormalities, and congenital syndromes are also associated with small-for-gestational-age fetuses. [88]
Certain genetic and congenital disorders are associated with an increased risk of macrosomia, including Beckwith-Weidemann syndrome, Sotos syndrome, fragile X syndrome, and Weaver syndrome. [99]
Diagnosis of Deviations in Fetal Weight
Techniques for estimating fetal weight
All of the currently available methods for assessing fetal weight in utero are subject to substantial predictive errors. These errors are most clinically relevant at the 2 extremes of fetal weight (eg, < 2500 g, likely the product of premature deliveries, and >4000 g, at risk for the complications associated with fetal macrosomia).
Tactile assessment of fetal size
Tactile assessment of fetal size is the oldest technique for assessing fetal weight and is also referred to as clinical palpation or Leopold maneuvers. It involves manual assessment of fetal size by the obstetrical practitioner. Worldwide, this method is used extensively because it is both convenient and virtually costless; however, it is a subjective method associated with notable predictive errors. [96, 98, 100, 101, 102, 103]
Clinical risk factor assessment
Quantitative assessment of clinical risk factors can be valuable in predicting deviations in fetal weight. [12] Table 6 shows the odds ratio (ORs) for fetal macrosomia associated with 11 clinical risk factors.
Table 6. Clinical Risk Factors and Odds Ratios for Fetal Weight Greater Than 4000 g [7, 8, 11, 12, 13, 14, 22, 23, 75, 76, 77, 78, 104, 105] (Open Table in a new window)
Risk Factor |
Patients With Macrosomic Fetuses With Presence of Risk Factors, % |
Presence of Risk Factor Compared With Controls Greater Than 4000 g, Odds Ratio |
Maternal diabetes mellitus* |
2-30 |
1.6-3 |
Abnormal 1-h 50-g oral glucose-screening result without gestational diabetes mellitus |
15-27 |
1.8-2.1 |
Abnormal single 3-h 100-g oral glucose-tolerance result |
8-34 |
1.9-2.4 |
Prolonged gestation, >41 wk |
19-35 |
5.5-5.9 |
Maternal obesity |
16-37 |
1.7-4.4 |
Pregnancy weight gain >35 lb |
21-56 |
1.5-2.2 |
Maternal height >5 ft 3 in |
20-24 |
1.5-2 |
Maternal age >35 y |
12-21 |
1.3-2.3 |
Multiparity |
64-93 |
1.2-1.3 |
Male fetal sex |
62-69 |
1.2-1.4 |
Caucasian maternal race |
45-94 |
1.1-2.5 |
Note: Data compiled from 14 studies of the prevalence of risk factors for fetal macrosomia among women delivering fetuses weighing 4000 g or more and control subjects with birth weights of less than 4000 g. * All classes, including gestational diabetes mellitus. The wide range of values reflects differences among studies in criteria for screening and diagnosis, prevalence of disease in the populations under study, and the generally good (but variable) success of glucose control during pregnancy. |
||
Maternal self-estimation
A third method for estimating fetal weight is maternal self-estimation. Perhaps a surprise, in some studies, self-estimates of fetal weight in multiparous women were comparably accurate to findings on clinical palpation in predicting fetal weight and abnormally large fetuses at term (see Table 7). [106, 107, 108, 109]
Table 7. Comparison of the Accuracy of Birth-Weight Prediction for Pregnancies at More Than 37 Weeks' Gestation* (Open Table in a new window)
Author |
Clinical Palpation |
Sonographic Fetal Biometry* |
Self-Estimates |
|
|
Mean Absolute Error, %; Predictions Within 10% of Actual Weight, % |
Mean Absolute Error, %; Predictions Within 10% of Actual Weight, % |
Mean Absolute Error, %; Predictions Within 10% of Actual Weight, % |
|
Watson et al, 1988 |
7.9; 67 |
8.2; 66 |
NA; NA |
|
Chauhan et al, 1992 |
9.0; 66 |
15.6; 42 |
8.7; 70 |
|
Chauhan et al, 1993 |
9.1; 65 |
10.7; 56 |
NA; NA |
|
Chauhan et al, 1994 |
9.1; 70 |
12.1; 48 |
NA; NA |
|
Chauhan et al, 1995 |
7.5; 65 |
NA; NA |
9.2; 67 |
|
Chauhan et al, 1995 |
9.9; 54 |
11.4; 51 |
NA; NA |
|
Sherman et al, 1998 |
7.2; 73 |
8.1; 69 |
NA; NA |
|
Chauhan et al, 1998 |
10.3; 61 |
10; 60 |
NA; NA |
|
Herrero et al, 1999 |
9.5; 61 |
NA; NA |
9.5; 62 |
|
Hendrix et al, 2000 |
10.6; 58 |
16.5; 32 |
NA; NA |
|
Dar et al, 2000 |
8.5; 61 |
5.9; 83 |
NA; NA |
|
Nahum et al, 2002 |
9.9; 51 |
8.3; 71 |
11.5; 55 |
|
Total |
7.2-10.6; 51-73 |
5.9-16.5; 32-83 |
8.7-11.5; 55-70 |
|
* Sonographic prediction algorithms used to estimate fetal weight were those of Shepard, [110] Hadlock, [111, 112] Sabbagha, [113] and Warsof, [114, 115] in addition to the best of 8 algorithms based on various combinations of abdominal circumference (AC), femoral length (FL), biparietal diameter (BPD), and head circumference (HC), both singly and in combination. |
||||
Obstetric ultrasonography
The most modern method for assessing fetal weight in utero involves the use of fetal measurements obtained during obstetrical ultrasonography. The advantage of this technique is that it relies on linear and/or planar measurements of in utero fetal dimensions that are objectively definable and generally reproducible. Findings from multiple studies have shown that ultrasonographic estimates of fetal weight are no better than clinical palpation in predicting fetal weight [63, 102, 106, 109, 116, 117, 118, 119, 120, 121, 122, 123, 124, 125, 126, 127] ; these observations have undermined early expectations that this method might provide an objective standard for identifying fetuses of abnormal size for gestational age (see Table 7). Additionally, Atlass et al found that maternal obesity and small-for-gestational-age birth were both associated with an increased risk of excess ultrasound error (≥20%) in estimating fetal weight. [128]
Taken together, these findings suggest that the prediction of fetal weight is not an exact science and that it requires additional refinement.
Accuracy of Fetal Weight Prediction by Using Different Methods
A standard against which to measure all methods of fetal weight prediction: The accuracy of birth weight prediction by simply applying the gestation-specific mean value
For any particular set of newborns, the single best-fitting estimate of birth weight for each individual fetus is the average weight for that particular cohort. Consequently, the simplest approach to birth weight prediction is to apply the mean gestational-age specific birth weight as the prediction criterion for any particular population of women in each case. This involves merely identifying the mean birth weight associated with each gestational age for the given population.
Not surprisingly, this method results in fairly accurate estimations of mean fetal weight for new and demographically well-matched populations of patients, but it is a much poorer tool for estimating the actual birth weight for any particular fetus. However, the accuracy of this method can be used as a benchmark against which other techniques can be assessed for their intrinsic value beyond merely knowing the average birth weight for a particular class of patients. Any other method of prediction that purports to predict birth weight more accurately in individual cases must be able to improve upon the application of such "mean value" estimates in order to have added value. If growth curves can be found that are specific to a particular population of pregnant women (eg, specific for the maternal race, parity, fetal gender, altitude of residence, etc. of a particular class of patients), then the accuracy of this "mean-birth-weight" prediction method can be improved significantly.
To assess the accuracy of this method, the population-specific mean birth weight for a group of Caucasian women with uncomplicated singleton term pregnancies was calculated and applied back to the same group. The mean absolute prediction error for estimating birth weight by simply "guessing" the population-specific mean value in each case was ±449 g and the mean absolute percentage prediction error was ±13.6%. [129]
Given that in this study, the mean birth weight was derived from the same group to which it was applied, these results would seem to be the optimal that can be obtained using this approach for normal singleton liveborns that are delivered to healthy mothers without major complications of pregnancy (eg, without gestational diabetes mellitus, hypertension, or preeclampsia). Although the accuracy of these results is far from optimal, they rival the accuracy of other more traditional methods of term birth weight prediction (such as clinical palpation).
Accuracy of clinical palpation for estimating fetal weight
Several investigations have shown that the accuracy of clinical palpation for estimating fetal weight is ±278-599 g (±7.5-19.8%), depending on fetal weight and gestational age. [102, 103, 106, 107, 108, 117, 118, 120, 122, 121] The technique is best for estimating fetal weight in the reference range of 2500-4000 g.
Several studies demonstrate that the accuracy of clinical palpation for estimating fetal weight < 2500 g deteriorates markedly, with a mean absolute percentage error of ±13.7-19.8%. Only 40-49% of birth weights below the 2500-g threshold are properly estimated by means of clinical palpation to within ± 10% of the actual birth weight. When fetuses weigh < 1800 g, the accuracy of such clinical estimates is reduced even further, with more than half of these predictions in error by >450 g (± 25%).
One study showed that the sensitivity of clinical palpation for identifying a birth weight of < 2500 g was only 17%, with an associated positive predictive value of 37%. At the upper limit of term fetal weights, 2 studies have shown that the positive predictive value of clinical palpation for predicting birth weight >4000 g was 60-63%, with an associated sensitivity of 34-54%.
Furthermore, findings from 2 studies have suggested that the accuracy of clinical palpation for predicting fetal weight does not depend on the level of training of the operator, whereas data from another study suggests that resident physicians in obstetrics and gynecology are systematically better than medical students at estimating term birth weight by using this technique (see Table 8). [109, 130]
In a study by Noumi et al that assessed the accuracy of clinical and sonographic estimations of fetal weight performed during the active phase of labor by resident physicians, the correlation between the clinical and sonographic estimates and actual birth weight was 0.59 (P < .0001) and 0.65 (P < .0001), respectively. Clinical estimates were correct to within ±10% in 72% of cases, with sonographic estimates correct in 74%. However, the sensitivity of predicting birth weight of 4,000 g or more was only 50% for both methods, with 95% and 97% specificity, respectively. The authors concluded that both clinical and sonographic estimates of fetal weight by resident physicians had poor sensitivity for detecting macrosomic fetuses, and that the sonographic estimates offered no advantage over clinical ones. [116]
The mean absolute percentage error in birth weight prediction by using clinical palpation for term fetuses at >37 weeks' gestation is 7.2-10.6% (see Table 7). For a fetus predicted to weigh >4000 g, the average error in birth-weight estimation routinely exceeds 300-400 g. In 1 study, >6% of fetal weights were wrongly assessed by >1370 g (3 lb). [16]
Table 8. Accuracy of Clinical Palpation for Predicting Term Birth Weight by Type of Clinician (Open Table in a new window)
Healthcare Professional |
Mean Absolute Error, g (P Value .06); % (P Value .05) |
Within 10% of Actual Weight, % (P Value .05) |
Obstetric-Gynecologic Residents |
261; 7.5 |
71 |
Medical Students |
388; 11.5 |
38 |
Source: Nahum, 2002 [55] |
||
Accuracy of obstetric ultrasonography for estimating fetal weight
Obstetric sonographic assessment for the purpose of obtaining fetal biometric measurements to predict fetal weight has been integrated into the mainstream of obstetric practice in the past quarter century. From its inception, this method has been presumed to be more accurate than clinical methods for estimating fetal weight. The reasons for this assumption vary, but the fundamental underlying presumption is that sonographic measurements of multiple linear and planar dimensions of the fetus provide sufficient parametric information to allow for accurate algorithmic reconstruction of the 3-dimensional fetal volume of varying tissue density. Consistent with these beliefs, much effort has generated best-fit fetal biometric algorithms to make birth weight predictions based on obstetric ultrasonographic measurements. As such, the ultrasonographic technique represents the newest and most technologically sophisticated method of estimating fetal weight.
Modern algorithms that incorporate standardly defined fetal measurements (eg, some combination of fetal AC, FL, BPD, and HC) are generally comparable in their overall accuracy in predicting fetal weight. A large number of ultrasonographic algorithms are available, providing various types of fetal biometric information. [129]
The formulas can be arranged into 8 groups according to the type of fetal biometric information that they rely on to make their fetal weight predictions, as follows:
FL [115]
While most clinicians use the formulas provided by their ultrasound machine or reporting program, it is important to know which formula is in use and its limitations.
The value of each of the 4 standard ultrasonographic fetal biometric parameters for predicting fetal weight has been evaluated to determine whether their correlation with fetal weight increases with increasing order. Table 9 shows these results.
Table 9. Correlations of Ultrasonographic Fetal Measurements With Term Fetal Weight (Open Table in a new window)
Correlation With Birth Weight |
BPD |
HC |
AC |
FL |
First order |
0.64 |
0.67 |
0.75 |
0.56 |
Second order |
0.64 |
0.67 |
0.75 |
0.55 |
Third order |
0.64 |
0.67 |
0.74 |
0.55 |
Adapted from Nahum 2003. [129] |
||||
The predictive value of the standard ultrasonographic fetal biometric measurements for estimating fetal weight did not increase with increasing order for any of the 4 parameters. Consistent with these findings, data evaluated from an unrelated set of patients found that the correlations of these 4 ultrasonographic measurements at first-order with fetal weight were as follows: BPD = 0.58, HC = 0.65, AC = 0.78, and FL = 0.52. [140] Again, the correlation did not increase with increasing order for any of the 4 parameters.
These results suggest that the fetal AC is the single best ultrasonographic predictor of fetal weight and that the predictive value of none of the measurements increase with increasing order. [141] The additional implication is that the incorporation of higher-order terms into ultrasonographic prediction algorithms is not theoretically or empirically justified.
When other sonographic fetal measurements are used to estimate fetal weight (eg, humeral soft-tissue thickness, ratio of subcutaneous tissue to FL, cheek-to-cheek diameter), these non-standard measurements do not significantly improve the usefulness of obstetric ultrasonography in predicting fetal weight, except in special patient groups (eg, mothers with diabetes). [142, 143, 144]
Limiting factors associated with the ultrasonographic prediction of fetal weight are (1) imprecise imaging of fetal structures (due to limitations such as patient obesity, placentation, oligohydramnios, and/or fetal position), (2) the limited number of linear and/or planar measurements that can be taken of the complex 3-dimensional fetal conformation, (3) fetal tissues of similar dimensions with varying densities (eg, bone > muscle > adipose tissue density), (4) unavoidable operator- and equipment-related measurement errors and approximations [121] , and (5) inappropriate algorithmic compounding of measurement errors and approximations by the incorporation of high-order terms.
In a recent study by Anderson et al, the contributions of different types of errors in attaining ultrasonographic fetal weight estimates for 12 published formulae were evaluated in 1991 and 2000. [145] Their findings were as follows: (1) ultrasound is a relatively inaccurate method for the purpose of estimating fetal weight (95% agreement limits between predicted and actual fetal weights is approximately ±21%), (2) errors are due to the ultrasound-based equations and not image resolution, (3) observer inaccuracies are only a minor component of prediction errors (agreement between and within observers range from -4% to +3%), (4) most prediction errors are due to equation bias, lack of precision, and inconsistencies among the different published ultrasonographic formulae, and (5) fetal weight predictions using ultrasound-alone equations did not improve from 1991-2000. [146]
This study concluded that 95% limits of agreement ranged from -4.4% to +3.3% for interobserver and intraobserver fetal biometric measurement estimates, but that the limits were -18.0% to +24.0% for the correspondence between equation-estimated and actual birth weights. Furthermore, in 2000, out of the 12 published formulas, only 6 had an overall bias within 7% and precision within 15% and this was not an improvement in accuracy from 1991. Finally, the authors concluded that ultrasonographic prediction equation error in estimating fetal weight is the largest source of the inaccuracy, whereas observer error is relatively minor. Therefore, it is not surprising that fetal weight estimates are no more accurate following improvements in ultrasonographic technology.
In a study of 1034 patients, the mean absolute percentage error associated with the calculation of estimated fetal weights based on BPD, AC, and FL (according to a widely used Hadlock equation) was up to 11.3%, depending on the gestational age of the fetus (ie, after crude stratification of fetal size). [122] When the mean absolute percentage error of the method is assessed for the 3 clinically significant ranges of fetal weight (< 2500, 2500-4000, >4000 g), the mean absolute percentage error of the technique is typically lowest (±7.1-10.5%) for the mid and high ranges and slightly greater for the lowest range (±8-11%).
When another commonly used measure of accuracy is used (percentage of fetuses with weight accurately estimated to within ±10% of actual birth weight), weight was accurately predicted to within these limits for 56% of fetuses weighing < 2500 g, for 58% of fetuses weighing 2500-4000 g, and for 62% of fetuses weighing >4000 g.
When the accuracy of detecting clinically relevant deviations in term birth weight (< 2500, >4000, and >4500 g) is determined for the sonographic technique of fetal weight estimation, the positive predictive value ranges from 44-55%, with corresponding sensitivities of 58-71%. As expected, for preterm fetuses delivered at < 37 weeks' gestation that have a decreased mean birth weight, the 1-way accuracy of sonographic fetal biometric classifications of clinically significant deviations (ie, low birth weight) improved. The positive predictive value of a sonographic estimate of fetal weight of < 2500 g is 87% for preterm fetuses, with a sensitivity of 90%, and the positive predictive value for a sonographic estimate of fetal weight < 1500 g is 86%, with a sensitivity of 93%.
Two studies have investigated the relative accuracy of the different classes of ultrasonographic fetal-biometric algorithms for predicting fetal weight. In the first study, 74 patients with normal, term, singleton pregnancies underwent complete sonographic examinations within 1.4 weeks of delivery. The mean absolute predictive accuracy of 27 algorithms ranged from ±295 g for the Warsof equation (based on fetal AC alone) to ±520 g for the Woo equation (based on both AC and BPD) (see Table 10). The accuracy of the algorithms to within ±15% of actual birth weight ranged from 54% for the Higginbottom equation (based on AC alone) to 85% for the modified Shinozuka equation (based on AC, BPD, and FL).
With regard to the prediction of fetal weight within ±10% of actual birth weight, accuracy ranged from 31% for the Woo equation (based on AC and BPD) to 70% for the Hadlock equation (based on AC, BPD, HC, and FL). [129]
Thirteen (48%) of the 27 equations did not predict fetal weight to within ±15% of actual weight better than guessing the mean birth weight. For fetal-weight predictions to within ±10% of actual weight, 20 (74%) of the ultrasonographic algorithms performed better than guessing.
Seventeen (63%) of the 27 ultrasonic algorithms generated substantially lower mean absolute prediction errors and mean absolute percentage errors than guessing. For these equations, the improvement in the mean absolute prediction error and the absolute percentage prediction error was 96-154 g (3.2-5.0%) depending on the algorithm used. The 10 remaining equations resulted in estimates no better than simple guesses of 3455 g for each newborn.
Overall, the 3 algorithms that were most accurate were those of Ott et al (based on AC, HC, and FL), Shinozuka et al (based on AC, BPD, and FL, as Combs et al modified it), and Warsof et al (based on AC alone). Results in any category of analysis for these equations were not significantly different.
Table 10. Accuracy of Ultrasonographic Algorithms for Predicting Fetal Weight at 37 Weeks’ Gestation or Later (n = 74) (Open Table in a new window)
Method |
Correlation With Actual Birth Weight* |
Mean Absolute Error, g; % |
Birth Weight Estimates Within ± 10% of Birth Weight, % |
Birth Weight Estimates Within ± 15% of Birth Weight, % |
AC |
0.73-0.75 |
295-498; 8.8-14.7† |
38-69† |
54-82† |
FL |
0.52 |
390; 11.1 |
49 |
70 |
AC and FL |
0.73-0.75 |
355-427; 9.8-12.3† |
54-65† |
73-80† |
AC and BPD |
0.75-0.77 |
324-520; 9.5-15.0† |
31-65† |
57-82† |
AC and HC |
0.71-0.79 |
323-327; 9.4-9.5† |
66 |
77 |
AC, BPD, and FL |
0.76-0.77 |
312-363; 9.0-10.6† |
58-68† |
77-85† |
AC, HC and FL |
0.78 |
297-333; 8.6-9.7† |
64-66† |
78-84† |
AC, BPD, HC, and FL |
0.75-0.77 |
334-364; 9.7-10.5† |
59*-70† |
77-80† |
Simply guessing |
NA |
449; 13.6 |
42 |
64 |
Source: Nahum 2003. [129] * All comparisons with actual birth weight were calculated by adding to the predicted ultrasonographic birth-weight rate of 12.4 g/d (for females) or 13.0 g/d (for males) for the time elapsed between the date of ultrasonographic fetal biometric assessment and the actual date of delivery. [45] † Results for the ultrasonographic prediction equation were statistically superior to those obtained by guessing the mean term birth weight at P < .05. Comparisons were made by using the Student t test for mean absolute errors and mean absolute percentage errors and by means of x2 analysis for the percentage of birth weight predictions within ±10% and ±15% of actual birth weight. ‡ The Shinozuka equation has been modified from its original published form by substituting the fetal AC measurement for the abdominal transverse and anteroposterior diameters in the original equation; Combs et al have recalculated its coefficients. [137, 139] |
||||
When used to make predictions concerning the occurrence of fetal macrosomia, the 13 best-performing ultrasonographic equations had 25-75% sensitivity for fetal macrosomia >4000 g with a positive predictive value of 41-63% (see Table 11). The 4 most accurate algorithms that possessed superior combinations of a sensitivity of >40%, a positive predictive value of >50%, and a likelihood ratio of >5.0 for the prediction of fetal macrosomia were the equations of Ott et al, Shinozuka et al (as Combs et al modified it), Jordaan (based on AC and BPD), and Warsof et al (based on AC alone).
Table 11. Comparison of the Most Accurate Ultrasonographic Algorithms That Incorporate Different Ultrasonographic Parameters to Predict Term Fetal Weight (n = 74) (Open Table in a new window)
Parameters in Equation |
Mean Absolute Error, g; % |
Estimates Within ± 10% of Birth Weight, % |
Estimates Within ± 15% of Birth Weight, % |
Sensitivity for Fetal Weight >4000 g, %* |
Positive Predictive Value for Fetal Weight >4000 g, %* |
|
AC |
295-337; 8.8-9.8 |
62-69 |
82 |
25-67 |
53-60 |
|
AC, FL |
339; 9.8 |
65 |
80 |
58 |
41 |
|
AC, BPD |
324-338; 9.5-9.8 |
62-65 |
78-82 |
42-75 |
43-55 |
|
AC, BPD, FL |
312-353; 9.0-10.3 |
58-68 |
80-85 |
42 |
50-56 |
|
AC, HC, FL |
298-333; 8.6-9.7 |
64-66 |
78-84 |
25-42 |
60-63 |
|
AC, BPD, HC, FL |
334; 9.7 |
70 |
80 |
42 |
50 |
|
Source: Nahum 2003. [140] *Calculations were made by adding to the predicted ultrasonographic birth weight 12.4 g/d (for females) or 13.0 g/d (for males) for the time elapsed between the date of ultrasonographic fetal biometric assessment and the actual date of delivery. [45] † The Shinozuka equation has been modified from its original published form by substituting the fetal AC measurement for the abdominal transverse and anteroposterior diameters in the original equation; Combs et al have recalculated its coefficients. [137, 139] |
||||||
In a second study of 82 unrelated patients who had normal term pregnancies and who underwent complete ultrasonography within 1.2 weeks of delivery, the predictive accuracy of 25 ultrasonographic prediction equations was evaluated. [140] Table 12 shows the results.
Table 12. Comparison of the Accuracy of Methods for Predicting Term Birth Weight (n = 82) (Open Table in a new window)
Correlation With Birth Weight |
Mean Absolute Error ±95% CI, g |
Mean Absolute Error ±95% CI, % |
Predictions Within ±10%, % |
Predictions Within ±15%, % |
|
Ultrasonographic Algorithms Based on Only AC |
|||||
0.76-0.77 |
263-375 ± 53-67 |
7.5-10.6 ± 1.5-1.9 |
54-74 |
79-88 |
|
Ultrasonographic Algorithms Based on Only FL |
|||||
0.44 |
419 ± 75 |
11.7 ± 2.0 |
55 |
71 |
|
Ultrasonographic Algorithms Based on AC and FL |
|||||
0.76-0.78 |
299-646 ± 56-87 |
8.6-18.8 ± 1.6-2.6 |
23-70 |
44-88 |
|
Ultrasonographic Algorithms Based on AC and BPD |
|||||
0.77-0.79 |
284-437 ± 50-74 |
7.9-12.8 ± 1.4-2.1 |
50-71 |
70-89 |
|
Ultrasonographic Algorithms Based on AC, BPD, and FL |
|||||
0.76-0.78 |
278-300 ± 51-54 |
7.9-8.6 ± 1.5-1.6 |
67-74 |
85-88 |
|
Ultrasonographic Algorithms That Use AC, HC, and FL† |
|||||
0.79 |
276-284 ± 58-65 |
7.5-7.8 ± 1.4-1.5 |
70-78 |
88-90 |
|
Ultrasonographic Algorithms Based on AC, BPD, and HC, With or Without FL+ |
|||||
0.78-0.79 |
283-322 ± 59-67 |
7.7-8.8 ± 1.5-1.8 |
68-78 |
82-85 |
|
Nonultrasonographic Method Based on Maternal Characteristics Alone |
|||||
0.60 |
353 ± 62 |
10.4 ± 1.9 |
57 |
79 |
|
Source: Nahum 2003. [140] *The Shinozuka equation has been modified from its original published form by substituting the fetal AC measurement for the abdominal transverse and anteroposterior diameters in the original equation; Combs et al have recalculated its coefficients. [137, 139] † n = 60 for ultrasonographic equations that incorporate fetal HC as a predictive variable |
|||||
When these ultrasonographic prediction results are compared with an approach that relies on only quantitative assessment of maternal and pregnancy-specific characteristics (see Predicting fetal weight by using algorithms derived from parental and pregnancy-specific characteristics), the accuracies of the algorithms are comparable (see the image below). Table 13 shows results for the different ultrasonographic equations compared with each other and with the maternal-characteristics approach to birth-weight prediction.
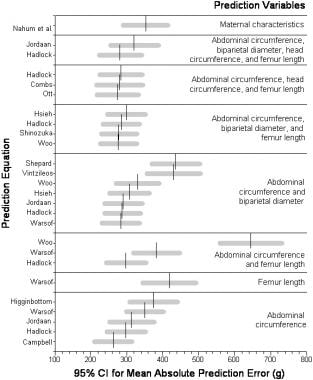 Direct comparison of the predictive accuracy of 25 ultrasonographic fetal biometric equations for predicting birth weight, with a single maternal-characteristics prediction equation.
After fetal AC is incorporated into the prediction algorithm, all types of ultrasonographic equations perform essentially equivalently in estimating fetal weight, and the addition of other standard ultrasonographic parameters generally does not increase the accuracy. Furthermore, the results demonstrate that no ultrasonographic algorithm for birth-weight prediction is superior to the maternal-characteristics approach.
Table 13. Comparison of the Absolute Accuracy of Equations and Methods for Predicting Term Birth Weight (n = 82) (Open Table in a new window)
Method |
AC |
AC, BPD, and FL |
AC and BPD |
AC and FL |
Maternal Characteristics |
AC, BPD, and FL |
NS |
NS |
NS |
NS |
NS |
AC and BPD |
NS |
NS |
NS |
NS |
NS |
AC and FL |
NS |
NS |
NS |
NS |
NS |
Maternal characteristics |
NS |
NS |
NS |
NS |
NS |
FL |
P = .01 |
P = .01 |
P = .02 |
NS |
NS |
Source: Nahum 2003. [140] Note: P values are listed when the mean absolute error for the method in the column is significantly smaller (after the Bonferroni correction) than the mean absolute error for the method in the row. NS = No significant difference. All comparisons were made by using 2-tailed t tests. |
|||||
Additional Comparisons of Fetal Weight Prediction Methods
With regard to predicting the occurrence of fetal macrosomia >4000 g, Table 14 shows the results for 17 of the best-performing ultrasonographic birth-weight prediction equations in 7 categories. The overall classification accuracy of the equations was 60-80% with likelihood ratios of 1.1-4.1. By comparison, the single maternal-characteristics equation to which they were compared in head-to-head fashion had an overall classification accuracy of 83%, with a likelihood ratio of 5.4.
Table 14. Direct Comparison of the Accuracy of Methods for Predicting Fetal Weight >4000 g (n = 60) (Open Table in a new window)
Sensitivity, % |
Specificity, % |
Positive Predictive Value, % |
Negative Predictive Value, % |
Overall Classification Accuracy, % |
Likelihood Ratio* |
|
Best Ultrasonographic Algorithms Based on Only AC |
||||||
82-100 |
51-65 |
31-35 |
94-100 |
60-68 |
2.0-2.4 |
|
Ultrasonographic Algorithm Based on Only FL |
||||||
18 |
84 |
20 |
82 |
72 |
1.1 |
|
Best Ultrasonographic Algorithms Based on AC and FL |
||||||
0.91 |
61 |
34 |
97 |
67 |
2.3 |
|
Best Ultrasonographic Algorithms Based on AC and BPD |
||||||
91 |
59-78 |
33-48 |
97 |
65-80 |
2.2-4.1 |
|
Best Ultrasonographic Algorithms Based on AC, BPD, and FL |
||||||
91-100 |
63-69 |
37-40 |
97-100 |
70-73 |
2.6-3.0 |
|
Ultrasonographic Algorithms Based on AC, HC, and FL |
||||||
64-91 |
73-82 |
38-44 |
72-92 |
73-78 |
2.7-3.5 |
|
Ultrasonographic Algorithms Based on AC, BPD, and HC, With or Without FL |
||||||
100 |
67-71 |
41-44 |
100 |
73-77 |
3.1-3.5 |
|
Nonultrasonographic Method Based on Maternal Characteristics Alone |
||||||
55 |
90 |
55 |
90 |
83 |
5.4 |
|
Source: Nahum, 2003. [140] Note: Values calculated by using an optimal ultrasonographic prediction cutoff of 3711 g. [140] *The likelihood ratio was used to compare the probability of having a positive result (ie, prediction of >4000 g) in a woman carrying a truly macrosomic fetus with the probability of having a positive result in a woman carrying a fetus with a true weight of < 4000 g. The utility of the test for assisting in clinical decision making can be categorized as follows: >10, very useful; 5-10, often useful; 2-5, sometimes useful; and 1-2, not generally useful. [147] † The Shinozuka equation has been modified from its original published form by substituting the fetal AC measurement for the abdominal transverse and anteroposterior diameters in the original equation; Combs et al have recalculated its coefficients. [137, 139] |
||||||
Table 15 shows the sensitivities, specificities, positive predictive values, and negative predictive values of the sonographic technique for predicting clinically significant variations in fetal weight as a function of both fetal weight and gestational age.
Table 15. Accuracy of Sonographic Fetal Biometry for Detecting Clinically Relevant Deviations in Fetal Weight (Open Table in a new window)
Actual Birth Weight |
Sensitivity, % |
Specificity, % |
Positive Predictive Value, % |
Negative Predictive Value, % |
Deliveries >37 wk |
||||
≥4500 g (prevalence, 2.9%) |
58 |
98 |
44 |
99 |
≥4000 g (prevalence, 11.6%) |
71 |
92 |
55 |
96 |
< 2500 g (prevalence, 5.1%) |
62 |
96 |
47 |
98 |
Deliveries < 37 wk |
||||
< 2500 g (prevalence, 70%) |
90 |
69 |
87 |
74 |
< 1500 g (prevalence, 26%) |
93 |
95 |
86 |
97 |
Adapted from Chauhan et al. |
||||
For any set of standard ultrasonographic input parameters (any subset of AC, FL, BPD, and/or HC), Using Ultrasound to Predict Fetal Weight is available as a free online tool to estimate fetal weight using 26 ultrasonographic fetal biometric equations; the mean, median, and range of fetal weight results is automatically provided.
Table 16 shows the results of 5 studies of the accuracy of the ultrasonographic technique for predicting fetal macrosomia of >4000 g at term. On meta-analysis of data from these 5 studies of 2367 term pregnancies of >37 weeks' gestation, the positive predictive value for detecting fetal weight >4000 g with ultrasonographic fetal biometry was 59% with a sensitivity of 59%. The average predictive error in birth-weight estimates for fetuses of >4000 g with this method was routinely >300-400 g.
Table 16. Accuracy of Obstetric Ultrasonography for Predicting Fetal Macrosomia of More Than 4000 g at More Than 37 Weeks’ Gestation (Open Table in a new window)
Accuracy |
Chervenak et al (1989) |
Pollack et al (1992) |
Wikstrom et al (1993) |
O’Reilly-Green and Divon (1997) |
Chauhan et al (1998) |
No. of subjects |
317 |
519 |
425 |
445 |
661 |
Sensitivity, % |
60 |
56 |
59 |
85 |
71 |
Specificity, % |
91 |
91 |
82 |
72 |
92 |
Positive predicted value, % |
69 |
64 |
52 |
49 |
55 |
Negative predicted value, % |
87 |
87 |
86 |
94 |
96 |
Gestational ages, wk |
41-43 |
>41 |
>37 |
>40.5 |
37-43 |
Mean ± SD birth weight, g |
3710 ± 452 |
3670 ± 446 |
NA |
3683 ± 458 |
NA |
Birth weight, g |
NA |
NA |
2000-5500 |
NA |
NA |
Birth weight >4000 g, % |
26 |
23 |
25 |
24 |
15 |
Source: Nahum, 2000. [58] |
|||||
Several recent studies have reevaluated the accuracy of 2-dimensional ultrasonography for the purpose of estimating fetal weight. [145, 148, 149, 150] Despite their more contemporary status, these studies are generally in agreement with the findings of previous investigations as long ago as 2 decades. [151]
In the study of Scioscia et al, the accuracy of 35 2-dimensional ultrasonographic formulas for estimating birth weight was assessed prospectively according to the type of fetal biometric parameters that they incorporated. [148] Only patients who delivered within 48 hours were considered for analysis (n=441).
Twenty-nine of the formulas (83%) provided an overall mean absolute percentage error of ≤10%, with overall predictions within ±10% and ±15% of actual birth weight in 69.2% and 86.5% of cases, respectively. Twenty formulas (57%) showed good accuracy (bias ≤0.50) and low variability (mean standard deviation 1.2). Formulas based on head-abdomen-femur measurements showed the lowest mean absolute percentage error. Upon stratification for birth weight, the group of formulas that relied on abdomen and femur measurements performed the best for fetuses weighing >3,500 g (P< .01). All of the sonographic algorithms that were evaluated underestimated the weight of large fetuses.
In the study by Anderson et al, the sources of error in the ultrasonographic assessment of fetal weight were investigated. The study was conducted in 1991 (72 deliveries) and again in 2000 (208 deliveries) using 12 published ultrasound equations in a mixed-risk pregnancy population and fetal weight was estimated within 7 days of delivery. [145] The 95% limits of agreement ranged from -4.4% to +3.3% for inter- and intraobserver estimates of fetal biometric measurements by sonography, but were -18.0% to +24.0% for the differences between sonographically-estimated and actual birth weights.
In 2000, only 6 of the 12 published ultrasonographic formulae had overall bias within 7% and precision within 15%. There was no change in the accuracy of birth weight predictions between 1991 and 2000, suggesting that improvements in ultrasound technology did not improve the accuracy of estimating fetal weight. The authors concluded that observer error is a relatively minor component of the inaccuracy in estimating fetal weight and that the error due to the ultrasonographic prediction equations themselves is much larger.
In the study by Colman et al, 1,177 term infants at ≥37 weeks of gestation that were delivered between 1998-2005 with an obstetrical ultrasound performed within 7 days of delivery had their birth weight predicted using a locally modified version of the Woo formula. [134, 149] The mean absolute error and mean signed error (±SD) of ultrasound fetal weight estimations were 7.0±5.7% and -0.2±9.0%, respectively. Seventy-five percent of estimates were within 10% of the actual birth weight. Ultrasound predictions tended to overestimate the weight of small fetuses < 2500 g (mean signed error +3.5%).
Prevalence of fetal macrosomia was higher in this group than for the other study groups.
Predicting fetal weight by using algorithms derived from parental and pregnancy-specific characteristics
New and theoretically defensible equations to prospectively predict individual birth weights from maternal and pregnancy-specific characteristics have been developed. The predictive efficacy of 59 scientifically justifiable terms was evaluated simultaneously to eliminate any confounding covariation and to determine which predictors could independently account for variations in birth weight. [59] Aside from maternal race, 7 maternal and pregnancy-specific variables were independently important in predicting birth weight for otherwise healthy pregnant women. One additional paternal factor (paternal height) was independently predictive of birth weight. [72] Table 5 shows the first-order correlations of various predictors with fetal weight.
By using these routinely recorded variables, an equation based on maternal and pregnancy-related characteristics alone was developed to predict birth weight based on the following factors (see Equation 1 below).
-
Maternal height
-
Maternal weight at 26 weeks' gestation
-
Maternal weight gain rate during the third trimester
-
Maternal hemoglobin concentration during the third trimester
-
Parity
-
Fetal sex
-
Gestational age at delivery
These prospectively measurable variables account for >36% of the variance in term birth weight and can be used to accurately predict fetal weight to within ±267-288 g (±7.6-8.4%) of individual birth weights. In addition, 68-75% of newborn weights can be estimated to within ±10% of the actual birth weights by using this method. [54, 55, 56, 59, 72, 140]
Equation 1 is one maternal-characteristics equation that has been generated and validated for this purpose. It is as follows:
Birth weight (in grams) = = -3044 + gestational (in days) X {[23.6 + (0.243 X fetal sex)
+ (0.000281 X material height in centimeters X maternal weight at 26 wk in kilograms)
+ (3.11 X maternal weight-gain rate in kilograms per day X [parity + 1])
- (0.318 X maternal hemoglobin concentration in grams per deciliter)},
where
fetal sex = +1 for male, -1 for female, or 0 for unknown, and
gestational age = days since the onset of the last normal menses, which equals the conception age (in days) + 14. [56, 59]
Prospective use of this maternal-characteristics equation yields a correlation of 0.59 between predicted and actual birth weights, with a mean absolute prediction error of 275 ±229 g (8.0% ±7.1 of actual birth weight). In 86% of cases, the birth weight predictions were accurate to within ±15%, and in 70% of cases, they were accurate to within ±10% of actual birth weight. [110, 152] The accuracy of this new method was recently tested by an independent group of investigators from the Czech Republic, who confirmed that its accuracy is comparable to that of the widely-used ultrasonographic prediction equation of Shepard. [110, 152]
For these types of parental-characteristics prediction equations for estimating fetal weight, the overall findings are as follows:
-
The image below shows the trade-off between sensitivity and specificity for the prediction of fetal macrosomia >4000 g.
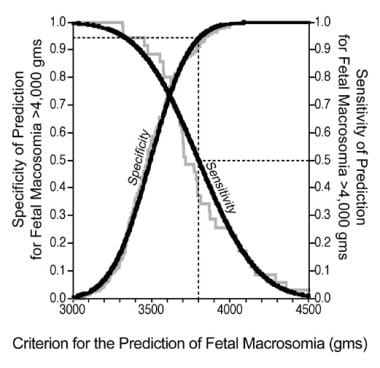 Sensitivity and specificity for the prediction of fetal macrosomia greater than 4000 g by using Equation 1. Jagged lines represent results obtained from raw data; curved lines represent smoothed values.
-
The image below shows the trade-off between the positive and negative predictive value for the prediction of birth weight >4000 g.
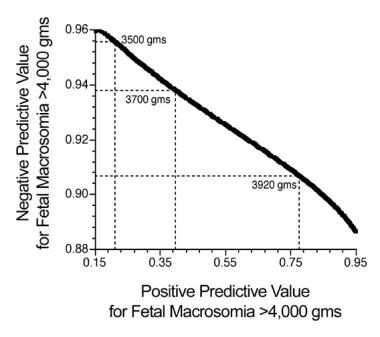 Curve delineating the trade-off between positive and negative predictive values by using Equation 1.
-
The image below shows the receiver operating characteristic curve depicting the overall accuracy of the equation for predicting fetal macrosomia. The area under the curve is 0.82.
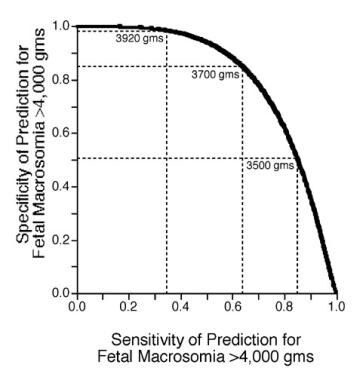 Receiver operating characteristics curve for the prediction of fetal weight of greater than 4000 g using Equation 1. Dashed lines represent the sensitivity and specificity associated with prediction equation cutoff values of 3500 g, 3700 g, and 3920 g, respectively.
-
By using a cutoff value of 3775 g, the sensitivity for predicting fetal macrosomia >4000 g is 54%, the specificity is 92%, the positive predictive value is 52%, and the negative predictive value is 93%.


Which of the methods for predicting fetal weight is the most accurate?
The accuracy of the different methods for predicting fetal weight depends on the gestational age and the range of birth weights under study. Again, for this purpose, dividing fetuses into the three birth weight categories of < 2500 g, 2500-4000 g, and >4000 g is useful. Table 17 shows the relative accuracy of clinical palpation versus obstetric sonographic fetal biometry for these ranges. With reference to the clinically significant birth weight ranges of < 2500 g and >4000 g, the accuracy of sonographic fetal biometry appears to be superior to clinical palpation for predicting fetuses weighing < 2500 g, whereas the 2 techniques appear to have comparable predictive accuracy for fetuses weighing 2500 g or more.
Table 17. Accuracy of Clinical Palpation vs Sonographic Fetal Biometry for Predicting Birth Weight (Open Table in a new window)
Birth Weight, g |
Clinical Palpation |
Ultrasonographic Fetal Biometry |
||
Absolute Error, %† |
Within 10% of Actual Weight, % |
Absolute Error, % |
Within 10% of Actual Weight, % |
|
< 2500 |
13.7-19.8 |
40-49 |
10.5-11 |
56-63 |
2500-4000 |
7.2-10.4 |
60-75 |
7-10.5 |
58-71 |
>4000 |
9.1-9.5 |
53-61 |
8.1-9.5 |
59-62 |
Adapted from Chauhan et al, 1998, [122] and Sherman et al, 1998. [153] |
||||
A study that directly compared the 4 methods of fetal-weight prediction in normal term pregnancies found no difference between the accuracy of the clinical methods (eg, clinical palpation, use of parental-characteristics prediction equations, and maternal self-estimation) and ultrasonographic fetal biometry. Eight representative ultrasonographic algorithms were assessed for this purpose. The mean birth weight for newborns was 3445 ± 458 g, with a range of 2485-4790 g.
Table 18 summarizes the results.
Table 18. Comparison of Results From Methods of Predicting Term Birth Weight (Open Table in a new window)
Method |
Correlation Coefficient With Actual Birth Weight |
Mean Absolute Error, g |
Mean Absolute Error, % |
Within 15% of Actual Birth Weight, % |
Clinical |
||||
Maternal characteristics prediction equation |
0.55 |
312 |
9.8 |
86 |
Leopold maneuvers |
0.60 |
336 |
9.9 |
83 |
Maternal self-estimation |
0.45 |
402 |
11.5 |
67 |
Ultrasonographic |
||||
Hadlock equation 1 |
0.61 |
292 |
8.4 |
88 |
Combs equation |
0.60 |
285 |
8.3 |
82 |
Hadlock equation 3 |
0.60 |
325 |
9.4 |
83 |
Hadlock equation 2 |
0.58 |
328 |
9.4 |
78 |
Campbell equation |
0.42 |
368 |
10.3 |
79 |
Warsof equation 2 |
0.63 |
370 |
10.3 |
61 |
Warsof equation 1 |
0.40 |
359 |
10.9 |
72 |
Shepard equation |
0.52 |
402 |
11.4 |
63 |
Source: Nahum, 2002. [109] |
||||
Ten other studies have been performed to directly compare the accuracy of clinical palpation to ultrasonographic fetal biometry in the same group of pregnant women, and 4 more that were performed compared clinical palpation to self-estimates of fetal weight after 37 weeks' gestation. [106, 107, 108, 109, 117, 118, 119, 120, 122, 123, 124, 153]
Two studies have also been conducted to compare clinical palpation to ultrasonographic fetal biometry and self-estimations of fetal weight (see Table 7). [106, 109] All of the methods have significant predictive errors in fetal-weight estimations for term fetuses in the range of 288-560 g, and no consistent or clear superiority of ultrasonographic fetal biometry over the other techniques was found.
The most common method currently used to estimate fetal weight before delivery is clinical palpation. However, recently Fox et al published a study confirming what many clinicians have suspected for decades: fetal weight estimations by clinicians are quick, inexpensive, and inaccurate. [154]
Even more disturbing, especially in developed countries where maternal obesity has reached epidemic proportions, the accuracy of clinical palpation for estimating fetal weight decreases significantly with increasing BMI: for women with a term BMI of ≥35, the accuracy of fetal weight prediction has a mean absolute error of ±315 grams (±11 ounces) or ±9.7%, and only 3 of 5 women (61%) have their baby’s weight predicted accurately to within ±10 of actual birth weight.
This poor performance can lead practitioners to institute obstetrical interventions for suspected deviations in fetal size that are not present or, alternatively, to have a false sense of reassurance regarding the normality of fetal size when it is not warranted. Both types of errors point to a need for using alternative and more accurate methods to estimate fetal weight.
The most accurate method of birth-weight prediction
Equations to predict fetal weight based on maternal characteristics alone can be successfully applied to new sets of pregnant women with absolute prediction accuracies of ±275-288 g (±8.0-8.4%) at term. [56, 55] Ultrasonographic prediction equations, which depend exclusively on fetal biometric information, have absolute prediction accuracies of ±263-646 g (±7.5-18.8%) at term. [129, 140]
In head-to-head comparisons, sonographic techniques to predict birth weight in term patients were no more accurate than methods that depend exclusively on the quantitative analysis of parental and pregnancy-specific characteristics (see the image below).
Direct comparison of the predictive accuracy of 25 ultrasonographic fetal biometric equations for predicting birth weight, with a single maternal-characteristics prediction equation.
By combining the information from ultrasonographic fetal biometry with that from the quantitative analysis of parental and pregnancy-specific characteristics, it is possible to derive combination prediction algorithms to optimize the accuracy of fetal-weight estimations. [155] Both types of information can produce approximately equivalent accuracies in predicting birth weight and fetal macrosomia. Because these types of data are fundamentally different, their combination is synergistic and results in improvements in accuracy compared to either technique alone for estimating fetal weight before delivery.
A set of 61 unique prediction algorithms was developed with selection logic for maternal races and combinations of available ultrasonographic, laboratory, and parental data. All of the information needed for their use is routinely available from standard prenatal patient charts, and ultrasonographic fetal biometric information can be collected up to 11 weeks before delivery. [155]
The combination prediction algorithms can be categorized into 4 groups. They require different parental characteristics information, and they incorporate additional fetal biometric information of 1 of the following types:
-
Ultrasonographic AC measurement within 11 weeks of delivery
-
Ultrasonographic HC measurement within 11 weeks of delivery, but without an AC measurement available
-
Ultrasonographic FL measurement within 11 weeks of delivery, but without either an AC or HC measurement available
-
Ultrasonographic BPD measurement within 11 weeks of delivery, but without an AC, HC, or FL measurement available
Because the choice of an optimal prediction algorithm depends on the availability of information concerning a particular patient and her pregnancy, the combination method can be implemented as a computer program that automatically chooses the proper algorithm for the patient-specific information and the ultrasonographic fetal biometric data that are available. One tool to estimate fetal weight and/or the risk of fetal macrosomia as a function of gestational age is available at Baby Weight Finder. Ultrasonographic information is not required to obtain results, but if it is available, it can be input to supplement the parental and pregnancy-specific information to obtain more accurate fetal weight estimates.
Equation 2 shows an example of a combination prediction algorithm that incorporates fetal AC and the interval from the time the sonographic study was performed to the date of delivery, as follows:
Birth weight in grams = -1627 + (13.18 X fetal AC) + (16.23 X delta US)
+ [0.00009966 X gestational age in days X maternal height in centimeters X maternal weight at 26 wks in kilograms]
+ [3.173 X gestational age in days X maternal third trimester weight-gain rate in kilograms per day) X (parity + 1)],
where
AC = fetal abdominal circumference
delta US = elapsed time in days between the acquisition of ultrasonographic fetal biometric measurements and the delivery date, and
gestational age = days since the onset of the last normal menses, which equals the conception age (days) + 14. [155]
By adding ultrasonographic fetal biometric parameters to different types of parental characteristics equations, 78% of the variance in term birth weight can be explained and the predictive accuracy is better than ±6.0% (±213 g). These fetal weight estimates are superior to what can be obtained by using either parental characteristics or ultrasonographic fetal biometry alone and can be made up to 11 weeks before delivery. [155]
In addition, by using this combined method, up to 90% of newborns can be properly classified as normal weight or macrosomic. The sensitivity for fetal macrosomia >4000 g can be increased to 83%, with an associated positive predictive value of 65% and a negative predictive value of 95%. The risk of fetal macrosomia as a function of gestational age can then be expressed as a simple percentage (1-99%), and individualized patient risk assessments can be made long in advance of delivery. Furthermore, if ultrasonographic fetal biometric data are not available, the system can be used as a tool to screen for patients who should undergo ultrasonography to make prospective fetal weight estimates optimally reliable.
When combination prediction algorithms of this type are compared directly with standard ultrasound-only prediction equations for term birth weight prediction, the combination algorithms are more accurate. Equation 3, which is the best-performing such combination algorithm that has been developed to date, is shown below.
Equation 3:
Birth weight in grams = -3468 + (10.95 X fetal AC) + (28.83 X fetal BPD) + (19.86 X delta US)
+ (0.00007464 X gestational age in days X maternal height in centimeters X maternal weight at 26 wk in kilograms)
+ (3.336 X gestational age in days X maternal third trimester weight gain rate in kilograms per day X [parity + 1])
where
AC = fetal abdominal circumference
BPD = fetal biparietal diameter
delta US = elapsed time in days between the acquisition of ultrasonographic fetal biometric measurements and the delivery date, and
gestational age = days since the onset of the last normal menses, which equals the conception age (days) + 14. [155]
When the birth weight predictions of Equation 3 were compared head-to-head with the predictions made by 3 standard Hadlock ultrasonographic equations, the results shown in Table 19 were obtained.
Table 19. Comparison of Performance of Combination Eq. (3) vs Hadlock Ultrasonographic Prediction Equations for Predicting Birth Weight and Fetal Macrosomia >4000 g Using Ultrasound Data Obtained up to 3 weeks Before Delivery* (Open Table in a new window)
Ultrasound Variables Included in Equation |
Mean Absolute Prediction Error, g; % |
Correctly Predicted Within ± 15%, % |
Sensitivity for >4000 g, % |
Positive Predictive Value for >4000 g, % |
Negative Predictive Value for >4000 g, % |
Specificity for >4000 g, % |
Likelihood Ratio |
Overall Classification Accuracy, % |
Combined Equations, Equation 3 |
||||||||
AC, BPD |
269; 7.9 |
88 |
75 |
67 |
95 |
93 |
10.3 |
90 |
Hadlock Ultrasound Equations |
||||||||
AC |
344; 10.0 |
80 |
44 |
50 |
89 |
92 |
5.1 |
84 |
AC, BPD |
319; 9.3 |
79 |
50 |
53 |
90 |
92 |
5.9 |
85 |
AC, FL |
361; 10.4 |
77 |
31 |
33 |
87 |
88 |
2.6 |
79 |
AC, BPD, FL |
340; 9.9 |
81 |
38 |
43 |
88 |
90 |
3.8 |
82 |
Source: Nahum, 2007. [155] * Mean interval (±SD) between fetal ultrasound examination and delivery = 10 ± 7 days; n = 98 with 16.3% of newborns weighing >4000 g at birth. |
||||||||
As shown in Table 19, not only is the mean absolute prediction error improved by combining ultrasonographic information together with maternal demographic and pregnancy-specific information in Equation 3, but the sensitivity, specificity, positive predictive value, and negative predictive value for the prediction of fetal macrosomia (birth weight >4,000 g) is also markedly improved.
Diagnosing Significant Deviations in Fetal Weight and Management Options
Diagnosis of fetal macrosomia
In the United States, the prevalence of neonatal weight >4,000 g has ranged from 9-10% during the past decade. [156] Prior to 37 completed weeks of gestation, a fetal weight >4,000 g is a rarity and occurs in < 1% of cases. [12] Although the overall rate of birth weight >4,000 g has recently trended downward, this is likely due to 2 distinct factors: (1) improved glycemic control in women with gestational diabetes, and (2) the rising overall rate of preterm delivery.
Because of the increased risks to both mothers and newborns associated with term fetal macrosomia (fetal weight >4,000 g) (see Table 1 and Table 2), the antenatal diagnosis of term fetal macrosomia is of particular clinical importance. Although no single diagnostic approach yields a perfect sensitivity and specificity for making a diagnosis prior to delivery, some methods are of systematically superior value than others. In the case of obstetrical ultrasonography, its utility for diagnosing fetal weight >4,000 g before birth has been shown to be limited. [157]
In a recent systematic quantitative review of the subject by Coomarasamy et al, the predictive value of ultrasonographically estimated fetal weight and abdominal circumference measurement for the prediction of macrosomia was investigated. [158] Fifty-one studies evaluating the accuracy of estimated fetal weight and 12 evaluating the accuracy of fetal abdominal circumference for predicting a birth weight >4,000 g were reviewed (a total of 19,117 subjects).
The summary ROC area obtained by using the estimated fetal weight as the predictor was not different from the area obtained by using fetal abdominal circumference (0.87 vs 0.85, P = 0.91). Using a Hadlock AC+FL equation to estimate fetal weight ultrasonographically, the summary likelihood ratios were 5.7 (95% CI, 4.3-7.6) for a positive test result and 0.48 (95% CI, 0.38-0.60) for a negative test result that predicts a birth weight >4,000 g. [112] For a fetal abdominal circumference of 36 cm, the respective likelihood ratios for predicting a birth weight >4,000 g were 6.9 (95% CI, 5.2-9.0) and 0.37 (0.30-0.45). The authors concluded that there is no difference in accuracy between using the ultrasonographic estimated fetal weight or fetal abdominal circumference for the prediction of a macrosomic baby at birth, and that a positive test is more accurate for ruling in macrosomia than a negative test result for ruling it out.
Given these significant limitations associated with obstetrical ultrasonography alone for the purpose of predicting term fetal macrosomia >4,000 g, other methods of prediction must also be considered. The most recent advance for algorithms that incorporate ultrasonographically-measured fetal biometric parameters to make predictions are combination prediction algorithms of the type shown in Equation 2 and Equation 3. When such algorithms are used, the sensitivity (75%), specificity (93%), positive predictive value (67%), negative predictive value (95%), and likelihood ratio (10.3) for the prediction of fetal macrosomia (birth weight >4,000 g) shows major improvement. [155]
Developing a consensus of indicators
All techniques for estimating fetal weight have significant degrees of inaccuracy. Therefore, a reasonable strategy for estimating fetal weight is to use several estimates based on different sources of clinical and ultrasonographic information. If this strategy is applied, the following practical and semiquantitative schema for making an antenatal diagnosis of fetal weight in the clinical setting can be suggested.
Assess maternal risk factors for predispositions to deviations in fetal growth at the initial prenatal visit and at the start of the third trimester. Any pregnant woman who has 1 or more of the following conditions should be considered at high risk for abnormal fetal growth and should undergo further assessment with other techniques to estimate the fetal weight:
-
Poorly controlled diabetes mellitus (any class, including gestational diabetes)
-
Abnormal 1-hour glucose screening test result (>135 mg/dL)
-
Single abnormal value on 3-hour oral glucose tolerance testing
-
Obesity
-
Abnormally tall or short stature
-
Excessive or inadequate pregnancy weight gain
-
High parity
-
Preterm gestation
-
Postdate pregnancy
-
Chronic hypertension
-
Preeclampsia (including pregnancy-induced hypertension and hemolysis, elevated liver enzyme levels, and low platelet count [HELLP syndrome])
-
Microvascular disease
-
Cigarette smoking
-
Residence at high altitude
After a pregnant woman is thought to be at risk for either excessive fetal growth or IUGR, use all applicable modalities to determine which method (if any) might suggest that the fetus has a weight outside of the normal reference range for its gestational age.
-
Standard fetal weight for comparison can be obtained from the 50th percentile of published fetal-growth curves derived from patient populations that are well matched to the particular patient under consideration.
-
Clinical palpation and ultrasonographic fetal biometry can be used to estimate fetal size regardless of gestational age.
-
Prediction equations based on parental characteristics can be used to estimate the fetal weight in healthy pregnant women of all races at or near term.
-
If results of any 2 modalities suggest that the fetal weight is abnormal for gestational age (ie, >2 SDs from the expected mean or 50th percentile), presume that the fetus is growing at an abnormal rate.
-
If so, consider obtaining a more reliable estimate of fetal weight by using a combination prediction algorithm that integrates parental characteristics with pregnancy-specific and ultrasonographic fetal biometric information. One such tool is available at Baby Weight Finder.
-
Order serial assessments of fetal growth to determine the velocity of ongoing fetal weight gain.
-
If both fetal weight for gestational age and the velocity of fetal weight gain are abnormal, the evidence for a clinically significant abnormality in fetal growth becomes more compelling. Manage the pregnancy accordingly, with the presumption that the fetal size is outside the normal reference range of expected values.
Option for suppression of labor in women carrying undersized fetuses
In general, the case can be made to attempt labor suppression in women carrying preterm fetuses weighing < 2000-2500 g before term gestation is reached. As stressed previously, most cases of low birth weight are associated with preterm gestations. However, any recommendation in this circumstance regarding tocolysis presupposes the following: (1) that no immediate fetal or maternal indications mitigate toward the timely delivery of the undersized fetus and (2) that the undersized fetus will continue to grow along an acceptable growth curve if the gestation is allowed to continue.
In many cases, both of these assumptions are invalid. For instance, many women who deliver preterm neonates are allowed to do so because of compelling fetal or maternal medical conditions that warrant timely delivery (eg, intrauterine infection, severe uteroplacental insufficiency, or severe preeclampsia). If fetal infection or IUGR is present, the preterm delivery of an underweight fetus may be indicated for fetal indications.
In many of these circumstances, the increased risk of morbidity and mortality to both the fetus and mother by allowing the pregnancy to continue may outweigh the increased risk of perinatal complications associated with the delivery of an underweight fetus. In addition, in some circumstances, the inadequate velocity of fetal growth might mandate a decision for delivery. In such cases, the presumption is that extrauterine growth and development in the neonatal nursery would be superior to that achieved in utero. Clinical judgment is of paramount importance in deciding when to affect delivery and when to attempt labor suppression. Detailed considerations in this decision are beyond the scope of this article.
Option for labor induction in women carrying oversized fetuses
In fetuses delivered before 37 weeks' gestation, fetal macrosomia is a rarity (see Table 4) [12] ; >99% of macrosomic fetuses are the product of term gestations. In general, nearly 95% of fetuses gain 12.7 ± 2.8 g/day from 37-42 weeks' gestation, indicating that an average fetus gains an additional 445 ± 98 g (1 lb ± 3 oz) during this period. [45] If a patient is thought to have a term fetus weighing >4000 g and if she is willing to undergo labor induction, effecting vaginal delivery rather than awaiting spontaneous labor and an increased average birth weight at delivery is often reasonable.
In studies designed to examine this question, labor induction has not conclusively decreased fetal and maternal risks of intrapartum complications. Data from several studies suggested that the cesarean-delivery rate increased, whereas the rate seemed unchanged in others. The difficulty in interpreting these results are the considerable differences among the predicted and actual birth weights for patients examined, and the power of the studies has been insufficient to conclusively demonstrate statistically significant differences in adverse fetal outcomes among different groups. [159, 160, 161, 162]
As with the case of preterm delivery of underweight fetuses, many considerations, including the size of the maternal pelvis and the weight of previously delivered fetuses, should be considered when fetuses are too large. Clinical judgment in these circumstances is paramount in deciding whether labor induction is indicated to minimize excessive fetal weight at delivery.
Conclusions
Both low birth weight (< 2500 g) and high birth weight (>4000 g) are fetal conditions associated with increased risks of peripartum morbidity and mortality. Although the absolute risk that fetuses with birth weights of 2000-2500 g or 4000-4500 g will have major peripartum complications is not overwhelming, the risk substantially increases with decreasing and increasing birth weight relative to these limits. Therefore, birth weight and gestational age are both important determinants of peripartum outcome. From this standpoint, the optimal range of newborn weight is generally thought to be 3000-4000 g (6 lb 10 oz to 8 lb 13 oz). As always, the problem is knowing the fetal weight with sufficient accuracy in advance of delivery.
Many factors that directly affect birth weight are not modifiable. These include maternal race, height, parity, paternal height, and fetal sex. Modifiable factors with potentially important effects on birth weight are pre-pregnancy weight, pregnancy weight gain, glucose control in patients with diabetes or glucose intolerance of pregnancy, maternal hemoglobin concentration, the degree of exercise during pregnancy, and gestational age at delivery.
Although the delivery of fetuses that weigh 2000-2499 g is typically not associated with an overwhelming increase in neonatal complications compared with normal-weight neonates, fetuses weighing < 2000 g at birth are at increased risk for perinatal complications that is commensurate with their weight.
Although allowing a trial of a vaginal delivery for a fetus estimated to weigh 4000-4500 g may be reasonable in many circumstances, many sources suggest that fetuses with estimated weights of 4500 g or greater (or >4250 g in women with gestational diabetes) should be delivered by means of cesarean section to avoid the increased intrapartum risks associated with the vaginal delivery of a macrosomic fetus. This recommendation is especially true in gestational diabetes, when the fetal conformation may be altered to reflect an enlarged shoulder girdle or HC ratio compared with that of the offspring of mothers without diabetes.
In the case of macrosomic fetuses, attempts to predict birth weight from fetal measurements on ultrasonography have been unsuccessful in improving clinical outcomes. Many researchers have concluded that ultrasonographic fetal biometric assessments are no more predictive of fetal macrosomia than clinical assessments of fetal size by means of simple external abdominal palpation. Both ultrasonography and manual assessment of fetal size have sensitivities of < 60% for fetal macrosomia, with false-positive rates >40%. Likewise, for small fetuses < 1800 g, ultrasonographic estimates of fetal weight are often inaccurate by as much as 25%.
By using birth-weight prediction equations based on parental and pregnancy-specific characteristics alone, fetal weight at and near term can be predicted with a high degree of accuracy (±7.6-8.4%). In healthy pregnant women, this approach is at least as reliable as clinical palpation and ultrasonographic fetal biometry in predicting fetal macrosomia; neither palpation nor ultrasonographic fetal biometry can be used with any degree of certainty in advance of delivery.
Direct comparison of the predictive accuracy of 25 ultrasonographic fetal biometric equations for predicting birth weight, with a single maternal-characteristics prediction equation.
Such a quantitative assessment of maternal characteristics serves to objectively quantify most previously recognized clinical variables that have long been used in subjective clinical assessments and that are thought to be predictive of fetal weight.
By contrast, clinical palpation is a subjective method that must be applied at or near the date of delivery, and its success depends on both the patient and the clinician. This method is less accurate in obese than in non-obese pregnant women, and predictions of birth weight have considerable interobserver variations even among experienced clinicians.
The disadvantages of ultrasonographic fetal biometry are that the method is complicated, labor intensive, and potentially limited by suboptimal visualization of fetal structures. It also requires costly sonographic equipment and specially trained personnel. Although such expensive imaging equipment is widely available in the United States and in other industrialized countries, it is generally not available in developing nations, where medical resources are often scarce.
By combining the different methods of fetal-weight prediction, overall accuracy can be improved. Quantitative combinations of parental and pregnancy-specific information (of the type incorporated in Equation 1) with the independent information obtained on ultrasonographic fetal biometry (with AC, FL, BPD, and HC) to generate algorithms of the type presented in Equation 2 and Equation 3 substantially improve fetal-weight prediction.
A set of 61 such algorithms has been developed with the necessary selection logic to optimize the accuracy of fetal weight predictions in women of all races and sizes and to optimize the detection of fetal macrosomia. The mean absolute percentage error in fetal-weight predictions by using this new combinatorial technique is ±6.0% (±213 g at term) and significantly better than the accuracy attainable by using any other method. In the case of excessive fetal size, combining these methods results in an 83% positive predictive value for fetal macrosomia >4000 g, with a sensitivity of 65% and specificity of 95%. The area under the receiver operating characteristic curve for predicting fetal macrosomia is increased to 0.92.
For pregnant women at high risk for fetal macrosomia, the approach of using a birth-weight prediction algorithm that incorporates parental characteristics, pregnancy-specific factors, and ultrasonographic fetal biometric measurements can be used to most accurately estimate fetal weight and the risk of fetal macrosomia.
The advent of 3-dimensional fetal sonography and MRI has generated optimism that these new technologies can improve estimations of fetal weight, but the advantages of these techniques have not yet been demonstrated. [163, 164, 165] Because all current 3-dimensional imaging methods rely on volumetric reconstructions that depend on standard 2-dimensional sections, they theoretically have the same limitations as standard 2-dimensional fetal imaging, and major improvements in accuracy are unlikely to be forthcoming.
As a result of recent improvements in the accuracy of fetal-weight predictions, practicing obstetricians can now undertake prospective interventions more confidently than before, with the aim of minimizing intrapartum and peripartum risks for both fetuses and mothers. [166]
-
Photograph of a macrosomic newborn soon after birth.
-
Influence of maternal hemoglobin concentration on term birth weight.
-
Direct comparison of the predictive accuracy of 25 ultrasonographic fetal biometric equations for predicting birth weight, with a single maternal-characteristics prediction equation.
-
Sensitivity and specificity for the prediction of fetal macrosomia greater than 4000 g by using Equation 1. Jagged lines represent results obtained from raw data; curved lines represent smoothed values.
-
Curve delineating the trade-off between positive and negative predictive values by using Equation 1.
-
Receiver operating characteristics curve for the prediction of fetal weight of greater than 4000 g using Equation 1. Dashed lines represent the sensitivity and specificity associated with prediction equation cutoff values of 3500 g, 3700 g, and 3920 g, respectively.
-
Neonatal Mortality by Birth Weight among Singleton Livebirths in the United States from 1995-2000 (n = 5,049,104, analyzed in 250-g categories). A nadir occurs at approximately 3,900 g and rises sharply thereafter. Data for all livebirths [dotted line] and livebirths at 40 weeks of gestation [solid line]). Adapted from Basso O, Wilcox AJ, Weinberg CR. Birth Weight and Mortality: Causality or Confounding? Am J Epidemiol 2006;164(4):303-11.
Tables
- Table 1. Newborn and Maternal Complications Associated With a Birth Weight Greater Than 4000 g [6, 7, 8, 9, 10, 11, 12, 13, 14, 15, 22, 23, 24]
- Table 2. Adjusted Risk of Shoulder Dystocia-Related Permanent Fetal Injury as a Function of Increasing Birth Weight
- Table 3. Term Birth-Weight Percentiles for Singleton Live Births at 40 Weeks' Gestation
- Table 4. Rates of Fetal Macrosomia (>4000 g) as a Function of Gestational Age
- Table 5. Routinely Measurable Parental and Pregnancy-Specific Demographic Factors That Influence Fetal Weight [54, 55, 56, 59, 72]
- Table 6. Clinical Risk Factors and Odds Ratios for Fetal Weight Greater Than 4000 g [7, 8, 11, 12, 13, 14, 22, 23, 75, 76, 77, 78, 104, 105]
- Table 7. Comparison of the Accuracy of Birth-Weight Prediction for Pregnancies at More Than 37 Weeks' Gestation*
- Table 8. Accuracy of Clinical Palpation for Predicting Term Birth Weight by Type of Clinician
- Table 9. Correlations of Ultrasonographic Fetal Measurements With Term Fetal Weight
- Table 10. Accuracy of Ultrasonographic Algorithms for Predicting Fetal Weight at 37 Weeks’ Gestation or Later (n = 74)
- Table 11. Comparison of the Most Accurate Ultrasonographic Algorithms That Incorporate Different Ultrasonographic Parameters to Predict Term Fetal Weight (n = 74)
- Table 12. Comparison of the Accuracy of Methods for Predicting Term Birth Weight (n = 82)
- Table 13. Comparison of the Absolute Accuracy of Equations and Methods for Predicting Term Birth Weight (n = 82)
- Table 14. Direct Comparison of the Accuracy of Methods for Predicting Fetal Weight >4000 g (n = 60)
- Table 15. Accuracy of Sonographic Fetal Biometry for Detecting Clinically Relevant Deviations in Fetal Weight
- Table 16. Accuracy of Obstetric Ultrasonography for Predicting Fetal Macrosomia of More Than 4000 g at More Than 37 Weeks’ Gestation
- Table 17. Accuracy of Clinical Palpation vs Sonographic Fetal Biometry for Predicting Birth Weight
- Table 18. Comparison of Results From Methods of Predicting Term Birth Weight
- Table 19. Comparison of Performance of Combination Eq. (3) vs Hadlock Ultrasonographic Prediction Equations for Predicting Birth Weight and Fetal Macrosomia >4000 g Using Ultrasound Data Obtained up to 3 weeks Before Delivery*
Complication |
Relative Risk |
Attributable Risk, % |
Shoulder dystocia |
2-38 |
2-18 |
Brachial plexus palsy |
16-216 |
0.2-8 |
Bony injuries/fracture |
1.4-97 |
0.2-6 |
Prolonged labor |
2.2-3.2 |
2-7 |
Birth asphyxia/low Apgar scores |
1.7-5.6 |
0.6-6 |
Forceps/vacuum extraction |
1.5-3.6 |
8-14 |
Birth canal/perineal lacerations |
1.6-5.1 |
3-7 |
Postpartum hemorrhage |
1.6-5.2 |
2-5 |
Cephalopelvic disproportion |
1.9-2.2 |
4-5 |
Cesarean delivery |
1.2-2.9 |
4-14 |
Note: Data compiled from 13 studies of the relative and attributable risk of complications associated with the birth of macrosomic fetuses. Reported ranges reflect the differences among studies in the patient populations and differences in the criteria used for the diagnosis of each complication. Relative and attributable risks are for fetuses weighing 4000 g or more at delivery compared with control subjects weighing less than 4000 g. P values associated with each relative risk are less than .001 in all cases, except for birth canal/perineal lacerations, for which P is less than .05. |
||
Birth Weight, g |
Total Births in the US in 1998, % |
Cases with Permanent Fetal Injuries, % |
Absolute Risk of Fetal Damage |
95% CI for Fetal Damage (Upper Bound) |
< 3000 |
24 |
2 |
1: 12,000 |
1: 6,000 |
3000-3249 |
17 |
2 |
1: 8,500 |
1: 4,150 |
3250-3499 |
20 |
4.5 |
1: 4,444 |
1: 2,740 |
3500-3749 |
16 |
12 |
1: 1,333 |
1: 994 |
3750-3999 |
13 |
9.5 |
1: 1,368 |
1: 977 |
4000-4249 |
5.5 |
20 |
1: 275 |
1: 222 |
4250-4499 |
3 |
14 |
1: 214 |
1: 165 |
4500-4749 |
0.8 |
14 |
1: 57 |
1: 43 |
4750-4999 |
0.3 |
8 |
1: 37 |
1: 25 |
5000-5249 |
0.2 |
8 |
1: 25 |
1: 18 |
=5250 |
0.2 |
6 |
1: 33 |
1: 23 |
Adapted from Iffy, 2008 [25] |
||||
Author |
Location |
No. of Newborns |
10th Percentile |
50th Percentile |
90th Percentile |
Maternal Race |
|
Alexander et al, 1996 |
United States |
3,134,879 |
2929 |
3495 |
4060 |
NA |
|
Amini et al, 1994 |
Ohio |
56,728 |
2785 |
3320 |
3910 |
53% White, 44% Black, 3% Other |
|
Wilcox et al, 1993* |
Great Britain |
41,718 |
3000 |
3520 |
4100 |
93% White, 3% Black, 4% Other |
|
Ott et al, 1993* |
St Louis, Mo |
5757 |
2988 |
3638 |
4216 |
NA |
|
Dombrowski et al, 1992 |
Detroit, Mich |
33,073 |
2820 |
3345 |
3935 |
19% White, 81% Black |
|
David et al, 1983 |
North Carolina |
190,830 |
2830 |
3380 |
3960 |
76% White, 23% Black, 1% Other |
|
Brenner et al, 1976 |
Ohio |
30,772 |
2750 |
3280 |
3870 |
53% White, 46% Black, 1% Other |
|
Cheng et al, 1972 |
Singapore |
26,000 |
2660 |
3180 |
3710 |
100% Chinese |
|
Babson et al, 1970 |
Portland, Or |
39,895 |
2880 |
3448 |
4045 |
95% White, 5% Other |
|
Gruenwald et al, 1966 |
Baltimore, Md |
13,327 |
2720 |
3260 |
3850 |
NA |
|
Lubchenco et al, 1963 |
Denver, Co |
5635 |
2630 |
3230 |
3815 |
100% White |
|
NA = not applicable *Ultrasonographically dated |
|||||||
Completed Gestational Week |
Fetal Macrosomia, % |
37 |
2.1 |
38 |
4.8 |
39 |
8.2 |
40 |
12.3 |
41 |
15.8 |
42 |
21 |
Adapted from Boyd, 1983 [12] |
|
Parental or Pregnancy-Specific Factor |
First-Order Correlation With Birth Weight* |
Gestational age at delivery |
0.27-0.41 |
Maternal weight at 26 weeks |
0.30-0.39 |
Maternal weight at term |
0.36-0.37 |
Maternal prepregnancy weight |
0.23-0.27 |
Maternal pregnancy weight gain |
0.15-0.31 |
Maternal height |
0.22-0.26 |
Maternal body mass index (BMI) |
0.16-0.27 |
Maternal age |
0.01-0.14 |
Parity |
0.01-0.19 |
Maternal hemoglobin concentration |
-0.15 to -0.17 |
Paternal height |
0.14-0.23 |
Fetal sex |
0.13-0.19 |
1-h 50-g glucose screening result |
0.04-0.09 |
* Ranges represent findings from 5 peer-reviewed studies. All first-order correlations with term birth weight were statistically significant at the P less than .05 level, except for the 1-h 50-g glucose result. Patients with diabetes mellitus were excluded from all analyses. |
|
Risk Factor |
Patients With Macrosomic Fetuses With Presence of Risk Factors, % |
Presence of Risk Factor Compared With Controls Greater Than 4000 g, Odds Ratio |
Maternal diabetes mellitus* |
2-30 |
1.6-3 |
Abnormal 1-h 50-g oral glucose-screening result without gestational diabetes mellitus |
15-27 |
1.8-2.1 |
Abnormal single 3-h 100-g oral glucose-tolerance result |
8-34 |
1.9-2.4 |
Prolonged gestation, >41 wk |
19-35 |
5.5-5.9 |
Maternal obesity |
16-37 |
1.7-4.4 |
Pregnancy weight gain >35 lb |
21-56 |
1.5-2.2 |
Maternal height >5 ft 3 in |
20-24 |
1.5-2 |
Maternal age >35 y |
12-21 |
1.3-2.3 |
Multiparity |
64-93 |
1.2-1.3 |
Male fetal sex |
62-69 |
1.2-1.4 |
Caucasian maternal race |
45-94 |
1.1-2.5 |
Note: Data compiled from 14 studies of the prevalence of risk factors for fetal macrosomia among women delivering fetuses weighing 4000 g or more and control subjects with birth weights of less than 4000 g. * All classes, including gestational diabetes mellitus. The wide range of values reflects differences among studies in criteria for screening and diagnosis, prevalence of disease in the populations under study, and the generally good (but variable) success of glucose control during pregnancy. |
||
Author |
Clinical Palpation |
Sonographic Fetal Biometry* |
Self-Estimates |
|
|
Mean Absolute Error, %; Predictions Within 10% of Actual Weight, % |
Mean Absolute Error, %; Predictions Within 10% of Actual Weight, % |
Mean Absolute Error, %; Predictions Within 10% of Actual Weight, % |
|
Watson et al, 1988 |
7.9; 67 |
8.2; 66 |
NA; NA |
|
Chauhan et al, 1992 |
9.0; 66 |
15.6; 42 |
8.7; 70 |
|
Chauhan et al, 1993 |
9.1; 65 |
10.7; 56 |
NA; NA |
|
Chauhan et al, 1994 |
9.1; 70 |
12.1; 48 |
NA; NA |
|
Chauhan et al, 1995 |
7.5; 65 |
NA; NA |
9.2; 67 |
|
Chauhan et al, 1995 |
9.9; 54 |
11.4; 51 |
NA; NA |
|
Sherman et al, 1998 |
7.2; 73 |
8.1; 69 |
NA; NA |
|
Chauhan et al, 1998 |
10.3; 61 |
10; 60 |
NA; NA |
|
Herrero et al, 1999 |
9.5; 61 |
NA; NA |
9.5; 62 |
|
Hendrix et al, 2000 |
10.6; 58 |
16.5; 32 |
NA; NA |
|
Dar et al, 2000 |
8.5; 61 |
5.9; 83 |
NA; NA |
|
Nahum et al, 2002 |
9.9; 51 |
8.3; 71 |
11.5; 55 |
|
Total |
7.2-10.6; 51-73 |
5.9-16.5; 32-83 |
8.7-11.5; 55-70 |
|
* Sonographic prediction algorithms used to estimate fetal weight were those of Shepard, [110] Hadlock, [111, 112] Sabbagha, [113] and Warsof, [114, 115] in addition to the best of 8 algorithms based on various combinations of abdominal circumference (AC), femoral length (FL), biparietal diameter (BPD), and head circumference (HC), both singly and in combination. |
||||
Healthcare Professional |
Mean Absolute Error, g (P Value .06); % (P Value .05) |
Within 10% of Actual Weight, % (P Value .05) |
Obstetric-Gynecologic Residents |
261; 7.5 |
71 |
Medical Students |
388; 11.5 |
38 |
Source: Nahum, 2002 [55] |
||
Correlation With Birth Weight |
BPD |
HC |
AC |
FL |
First order |
0.64 |
0.67 |
0.75 |
0.56 |
Second order |
0.64 |
0.67 |
0.75 |
0.55 |
Third order |
0.64 |
0.67 |
0.74 |
0.55 |
Adapted from Nahum 2003. [129] |
||||
Method |
Correlation With Actual Birth Weight* |
Mean Absolute Error, g; % |
Birth Weight Estimates Within ± 10% of Birth Weight, % |
Birth Weight Estimates Within ± 15% of Birth Weight, % |
AC |
0.73-0.75 |
295-498; 8.8-14.7† |
38-69† |
54-82† |
FL |
0.52 |
390; 11.1 |
49 |
70 |
AC and FL |
0.73-0.75 |
355-427; 9.8-12.3† |
54-65† |
73-80† |
AC and BPD |
0.75-0.77 |
324-520; 9.5-15.0† |
31-65† |
57-82† |
AC and HC |
0.71-0.79 |
323-327; 9.4-9.5† |
66 |
77 |
AC, BPD, and FL |
0.76-0.77 |
312-363; 9.0-10.6† |
58-68† |
77-85† |
AC, HC and FL |
0.78 |
297-333; 8.6-9.7† |
64-66† |
78-84† |
AC, BPD, HC, and FL |
0.75-0.77 |
334-364; 9.7-10.5† |
59*-70† |
77-80† |
Simply guessing |
NA |
449; 13.6 |
42 |
64 |
Source: Nahum 2003. [129] * All comparisons with actual birth weight were calculated by adding to the predicted ultrasonographic birth-weight rate of 12.4 g/d (for females) or 13.0 g/d (for males) for the time elapsed between the date of ultrasonographic fetal biometric assessment and the actual date of delivery. [45] † Results for the ultrasonographic prediction equation were statistically superior to those obtained by guessing the mean term birth weight at P < .05. Comparisons were made by using the Student t test for mean absolute errors and mean absolute percentage errors and by means of x2 analysis for the percentage of birth weight predictions within ±10% and ±15% of actual birth weight. ‡ The Shinozuka equation has been modified from its original published form by substituting the fetal AC measurement for the abdominal transverse and anteroposterior diameters in the original equation; Combs et al have recalculated its coefficients. [137, 139] |
||||
Parameters in Equation |
Mean Absolute Error, g; % |
Estimates Within ± 10% of Birth Weight, % |
Estimates Within ± 15% of Birth Weight, % |
Sensitivity for Fetal Weight >4000 g, %* |
Positive Predictive Value for Fetal Weight >4000 g, %* |
|
AC |
295-337; 8.8-9.8 |
62-69 |
82 |
25-67 |
53-60 |
|
AC, FL |
339; 9.8 |
65 |
80 |
58 |
41 |
|
AC, BPD |
324-338; 9.5-9.8 |
62-65 |
78-82 |
42-75 |
43-55 |
|
AC, BPD, FL |
312-353; 9.0-10.3 |
58-68 |
80-85 |
42 |
50-56 |
|
AC, HC, FL |
298-333; 8.6-9.7 |
64-66 |
78-84 |
25-42 |
60-63 |
|
AC, BPD, HC, FL |
334; 9.7 |
70 |
80 |
42 |
50 |
|
Source: Nahum 2003. [140] *Calculations were made by adding to the predicted ultrasonographic birth weight 12.4 g/d (for females) or 13.0 g/d (for males) for the time elapsed between the date of ultrasonographic fetal biometric assessment and the actual date of delivery. [45] † The Shinozuka equation has been modified from its original published form by substituting the fetal AC measurement for the abdominal transverse and anteroposterior diameters in the original equation; Combs et al have recalculated its coefficients. [137, 139] |
||||||
Correlation With Birth Weight |
Mean Absolute Error ±95% CI, g |
Mean Absolute Error ±95% CI, % |
Predictions Within ±10%, % |
Predictions Within ±15%, % |
|
Ultrasonographic Algorithms Based on Only AC |
|||||
0.76-0.77 |
263-375 ± 53-67 |
7.5-10.6 ± 1.5-1.9 |
54-74 |
79-88 |
|
Ultrasonographic Algorithms Based on Only FL |
|||||
0.44 |
419 ± 75 |
11.7 ± 2.0 |
55 |
71 |
|
Ultrasonographic Algorithms Based on AC and FL |
|||||
0.76-0.78 |
299-646 ± 56-87 |
8.6-18.8 ± 1.6-2.6 |
23-70 |
44-88 |
|
Ultrasonographic Algorithms Based on AC and BPD |
|||||
0.77-0.79 |
284-437 ± 50-74 |
7.9-12.8 ± 1.4-2.1 |
50-71 |
70-89 |
|
Ultrasonographic Algorithms Based on AC, BPD, and FL |
|||||
0.76-0.78 |
278-300 ± 51-54 |
7.9-8.6 ± 1.5-1.6 |
67-74 |
85-88 |
|
Ultrasonographic Algorithms That Use AC, HC, and FL† |
|||||
0.79 |
276-284 ± 58-65 |
7.5-7.8 ± 1.4-1.5 |
70-78 |
88-90 |
|
Ultrasonographic Algorithms Based on AC, BPD, and HC, With or Without FL+ |
|||||
0.78-0.79 |
283-322 ± 59-67 |
7.7-8.8 ± 1.5-1.8 |
68-78 |
82-85 |
|
Nonultrasonographic Method Based on Maternal Characteristics Alone |
|||||
0.60 |
353 ± 62 |
10.4 ± 1.9 |
57 |
79 |
|
Source: Nahum 2003. [140] *The Shinozuka equation has been modified from its original published form by substituting the fetal AC measurement for the abdominal transverse and anteroposterior diameters in the original equation; Combs et al have recalculated its coefficients. [137, 139] † n = 60 for ultrasonographic equations that incorporate fetal HC as a predictive variable |
|||||
Method |
AC |
AC, BPD, and FL |
AC and BPD |
AC and FL |
Maternal Characteristics |
AC, BPD, and FL |
NS |
NS |
NS |
NS |
NS |
AC and BPD |
NS |
NS |
NS |
NS |
NS |
AC and FL |
NS |
NS |
NS |
NS |
NS |
Maternal characteristics |
NS |
NS |
NS |
NS |
NS |
FL |
P = .01 |
P = .01 |
P = .02 |
NS |
NS |
Source: Nahum 2003. [140] Note: P values are listed when the mean absolute error for the method in the column is significantly smaller (after the Bonferroni correction) than the mean absolute error for the method in the row. NS = No significant difference. All comparisons were made by using 2-tailed t tests. |
|||||
Sensitivity, % |
Specificity, % |
Positive Predictive Value, % |
Negative Predictive Value, % |
Overall Classification Accuracy, % |
Likelihood Ratio* |
|
Best Ultrasonographic Algorithms Based on Only AC |
||||||
82-100 |
51-65 |
31-35 |
94-100 |
60-68 |
2.0-2.4 |
|
Ultrasonographic Algorithm Based on Only FL |
||||||
18 |
84 |
20 |
82 |
72 |
1.1 |
|
Best Ultrasonographic Algorithms Based on AC and FL |
||||||
0.91 |
61 |
34 |
97 |
67 |
2.3 |
|
Best Ultrasonographic Algorithms Based on AC and BPD |
||||||
91 |
59-78 |
33-48 |
97 |
65-80 |
2.2-4.1 |
|
Best Ultrasonographic Algorithms Based on AC, BPD, and FL |
||||||
91-100 |
63-69 |
37-40 |
97-100 |
70-73 |
2.6-3.0 |
|
Ultrasonographic Algorithms Based on AC, HC, and FL |
||||||
64-91 |
73-82 |
38-44 |
72-92 |
73-78 |
2.7-3.5 |
|
Ultrasonographic Algorithms Based on AC, BPD, and HC, With or Without FL |
||||||
100 |
67-71 |
41-44 |
100 |
73-77 |
3.1-3.5 |
|
Nonultrasonographic Method Based on Maternal Characteristics Alone |
||||||
55 |
90 |
55 |
90 |
83 |
5.4 |
|
Source: Nahum, 2003. [140] Note: Values calculated by using an optimal ultrasonographic prediction cutoff of 3711 g. [140] *The likelihood ratio was used to compare the probability of having a positive result (ie, prediction of >4000 g) in a woman carrying a truly macrosomic fetus with the probability of having a positive result in a woman carrying a fetus with a true weight of < 4000 g. The utility of the test for assisting in clinical decision making can be categorized as follows: >10, very useful; 5-10, often useful; 2-5, sometimes useful; and 1-2, not generally useful. [147] † The Shinozuka equation has been modified from its original published form by substituting the fetal AC measurement for the abdominal transverse and anteroposterior diameters in the original equation; Combs et al have recalculated its coefficients. [137, 139] |
||||||
Actual Birth Weight |
Sensitivity, % |
Specificity, % |
Positive Predictive Value, % |
Negative Predictive Value, % |
Deliveries >37 wk |
||||
≥4500 g (prevalence, 2.9%) |
58 |
98 |
44 |
99 |
≥4000 g (prevalence, 11.6%) |
71 |
92 |
55 |
96 |
< 2500 g (prevalence, 5.1%) |
62 |
96 |
47 |
98 |
Deliveries < 37 wk |
||||
< 2500 g (prevalence, 70%) |
90 |
69 |
87 |
74 |
< 1500 g (prevalence, 26%) |
93 |
95 |
86 |
97 |
Adapted from Chauhan et al. |
||||
Accuracy |
Chervenak et al (1989) |
Pollack et al (1992) |
Wikstrom et al (1993) |
O’Reilly-Green and Divon (1997) |
Chauhan et al (1998) |
No. of subjects |
317 |
519 |
425 |
445 |
661 |
Sensitivity, % |
60 |
56 |
59 |
85 |
71 |
Specificity, % |
91 |
91 |
82 |
72 |
92 |
Positive predicted value, % |
69 |
64 |
52 |
49 |
55 |
Negative predicted value, % |
87 |
87 |
86 |
94 |
96 |
Gestational ages, wk |
41-43 |
>41 |
>37 |
>40.5 |
37-43 |
Mean ± SD birth weight, g |
3710 ± 452 |
3670 ± 446 |
NA |
3683 ± 458 |
NA |
Birth weight, g |
NA |
NA |
2000-5500 |
NA |
NA |
Birth weight >4000 g, % |
26 |
23 |
25 |
24 |
15 |
Source: Nahum, 2000. [58] |
|||||
Birth Weight, g |
Clinical Palpation |
Ultrasonographic Fetal Biometry |
||
Absolute Error, %† |
Within 10% of Actual Weight, % |
Absolute Error, % |
Within 10% of Actual Weight, % |
|
< 2500 |
13.7-19.8 |
40-49 |
10.5-11 |
56-63 |
2500-4000 |
7.2-10.4 |
60-75 |
7-10.5 |
58-71 |
>4000 |
9.1-9.5 |
53-61 |
8.1-9.5 |
59-62 |
Adapted from Chauhan et al, 1998, [122] and Sherman et al, 1998. [153] |
||||
Method |
Correlation Coefficient With Actual Birth Weight |
Mean Absolute Error, g |
Mean Absolute Error, % |
Within 15% of Actual Birth Weight, % |
Clinical |
||||
Maternal characteristics prediction equation |
0.55 |
312 |
9.8 |
86 |
Leopold maneuvers |
0.60 |
336 |
9.9 |
83 |
Maternal self-estimation |
0.45 |
402 |
11.5 |
67 |
Ultrasonographic |
||||
Hadlock equation 1 |
0.61 |
292 |
8.4 |
88 |
Combs equation |
0.60 |
285 |
8.3 |
82 |
Hadlock equation 3 |
0.60 |
325 |
9.4 |
83 |
Hadlock equation 2 |
0.58 |
328 |
9.4 |
78 |
Campbell equation |
0.42 |
368 |
10.3 |
79 |
Warsof equation 2 |
0.63 |
370 |
10.3 |
61 |
Warsof equation 1 |
0.40 |
359 |
10.9 |
72 |
Shepard equation |
0.52 |
402 |
11.4 |
63 |
Source: Nahum, 2002. [109] |
||||
Ultrasound Variables Included in Equation |
Mean Absolute Prediction Error, g; % |
Correctly Predicted Within ± 15%, % |
Sensitivity for >4000 g, % |
Positive Predictive Value for >4000 g, % |
Negative Predictive Value for >4000 g, % |
Specificity for >4000 g, % |
Likelihood Ratio |
Overall Classification Accuracy, % |
Combined Equations, Equation 3 |
||||||||
AC, BPD |
269; 7.9 |
88 |
75 |
67 |
95 |
93 |
10.3 |
90 |
Hadlock Ultrasound Equations |
||||||||
AC |
344; 10.0 |
80 |
44 |
50 |
89 |
92 |
5.1 |
84 |
AC, BPD |
319; 9.3 |
79 |
50 |
53 |
90 |
92 |
5.9 |
85 |
AC, FL |
361; 10.4 |
77 |
31 |
33 |
87 |
88 |
2.6 |
79 |
AC, BPD, FL |
340; 9.9 |
81 |
38 |
43 |
88 |
90 |
3.8 |
82 |
Source: Nahum, 2007. [155] * Mean interval (±SD) between fetal ultrasound examination and delivery = 10 ± 7 days; n = 98 with 16.3% of newborns weighing >4000 g at birth. |
||||||||

What would you like to print?
- Practice Essentials
- Importance of Antenatal Fetal Weight Estimation
- Standard Fetal Growth Curves
- What is the Normal Range for Human Birth Weight?
- Definitions of Deviations in Fetal Growth
- Factors Contributing to Differences in Fetal Weight
- Diagnosis of Deviations in Fetal Weight
- Accuracy of Fetal Weight Prediction by Using Different Methods
- Additional Comparisons of Fetal Weight Prediction Methods
- Diagnosing Significant Deviations in Fetal Weight and Management Options
- Show All
- Media Gallery
- Tables
- References