Practice Essentials
Neuroblastoma is the most common extracranial pediatric neoplasm and the third most common pediatric malignancy after leukemia and central nervous system (CNS) tumors. In the first year of life, neuroblastoma accounts for 50% of all tumors. [1] Neuroblastoma is associated with a favorable prognosis, with most patients considered to be at low or intermediate risk for recurrence of the disease. [2] However, 50% of patients are classified as having high-risk disease due to older age (>18 mo) and metastatic disease or having locally advanced tumors with MYCN amplifications. The prognosis for high-risk patients is less favorable. [3]
Incidence of neuroblastoma is approximately 10 cases per million children younger than 15 years. About half of the tumors arise from the adrenal gland; other sites include the organ of Zuckerkandl or along the paravertebral ganglia from the neck to the pelvis. [4, 5, 6, 7]
Staging according to the International Neuroblastoma Risk Group Staging System (INRGSS) is as follows [5, 8, 9] :
-
L1: Localized tumor limited to 1 body compartment with no image-defined risk factors (IDRFs)
-
L2: Locoregional tumor with 1 or more IDRFs
-
M: Distant metastatic disease (except stage MS)
-
MS: Metastatic disease in children younger than 18 months with metastases
Neuroblastomas can arise from anywhere along the sympathetic chain. They have been associated with a number of disorders, such as Hirschsprung disease, fetal alcohol syndrome, DiGeorge syndrome, Von Recklinghausen disease, and Beckwith-Wiedemann syndrome. Neuroblastoma is present in approximately 50% of children with opsoclonus-myoclonus-ataxia syndrome (OMAS). [10]
CT scanning is the modality most commonly used to diagnose and stage neuroblastomas. [11] About 80-90% of neuroblastomas show stippled calcifications on CT. Intraspinal extension of neuroblastomas can be seen on radiographs. Intravenous pyelography (IVP) and excretory urography were widely used in the past to evaluate patients with adrenal neuroblastomas before the advent of CT, MRI, and ultrasonography. [12] MRI has some advantages over CT, [13] such as no need for ionizing radiation; multiplanar imaging capabilities; and, often, the elimination of the need for IV contrast enhancement. [14] Obstetric ultrasonography can depict fetal neuroblastomas as early as 19 weeks' gestation. Most of the cases identified during obstetric ultrasonography are diagnosed during the third trimester (around 36 weeks).
CT scanning was found to be better than MRI in identifying imaging-defined risk factors (IDRFs) after chemotherapy to ensure safe surgery, according to a retrospective study by Burnand et al. Compared to CT, MRI underestimated IDRFs in 13 of 24 children (54%) with abdominal neoblastoma, and operative findings had 100% correlation with CT imaging. [15]
(The radiologic characteristics of neuroblastomas are demonstrated in the images below.)
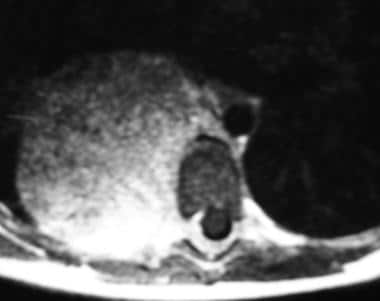
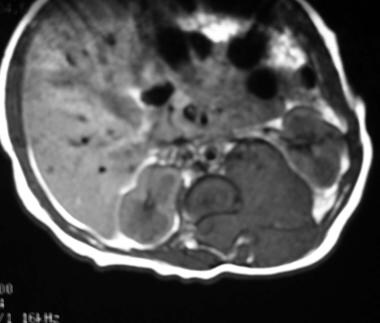 Axial nonenhanced T1-weighted MRI shows a hypointense mass in the retroperitoneum originating from the left adrenal gland. The mass displaces the left kidney in an anterolateral direction, it extends through the neuroforamen into the spinal canal, and it displaces the spinal cord to the right. The exact site of origin of large masses can be difficult to determine. Sympathetic-chain primaries supposedly invade the spinal canal with greater frequency than do adrenal primaries.
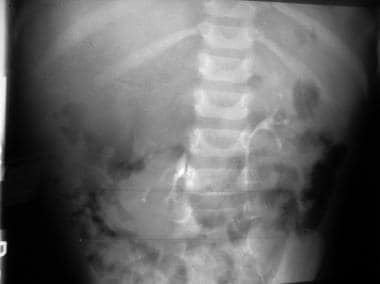 An intravenous pyelogram (IVP) shows an inferiorly displaced kidney on the right. Above the right kidney are stippled calcifications. These findings are consistent with those of a neuroblastoma.
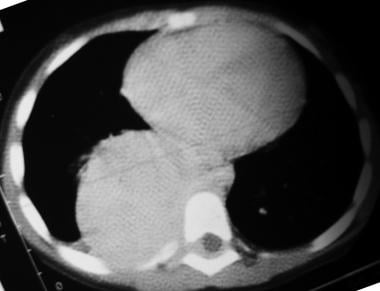 Nonenhanced axial CT scan of the chest in a patient with a thoracic neuroblastoma shows a large, right posterior mediastinal mass extending into the spinal canal and displacing the cord laterally to the left.
Radiography
Plain radiographs of the abdomen may show a flank mass. Stippled calcifications are present on up to 30% of radiographs. Hepatomegaly may occur secondary to metastatic involvement. Plain images of the chest often show a posterior mediastinal mass. Splaying of the ribs and rib erosion have been seen in patients with thoracic neuroblastomas due to the primary tumor.
(See the images below.)
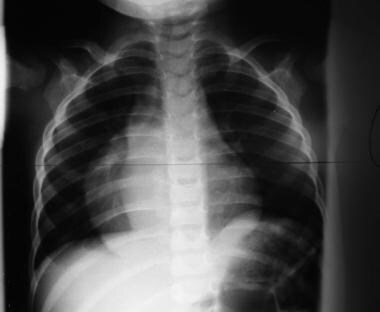 Frontal view of the chest shows a mass in the right thorax behind the heart. Posterior rib changes and the lateral view (seen in the next image) confirm that this is a posterior mediastinal mass. Note splaying and thinning of the ribs in the lower rib cage on the right. This was a thoracic neuroblastoma.
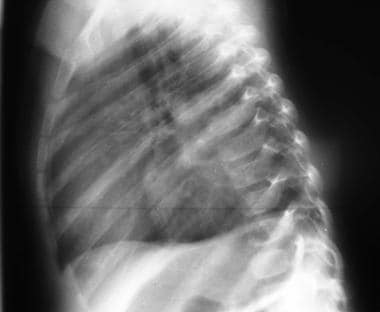 Lateral view of the chest in the same patient as in the previous image confirms the posterior mediastinal mass.
Pleural effusions and pleural nodules have been seen on chest radiographs. Lung parenchymal metastases are rarely seen on radiographs but are often detected on autopsy. Widening of the paraspinal line can be seen secondary to retrocrural extension of retroperitoneal neuroblastomas.
Bone metastases (seen in the images below) usually occur in the long bones and typically present as irregular lucencies or lytic lesions in the metaphysis or submetaphyseal bone.
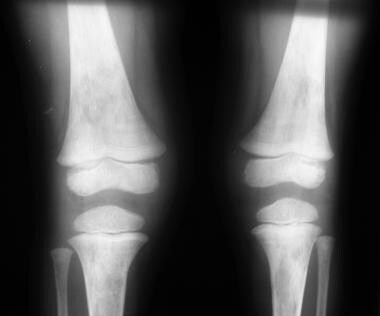 Anteroposterior (AP) views of both knees show irregular lucencies in both distal femoral and proximal tibial metaphyses; these represent relatively symmetrical metastatic disease.
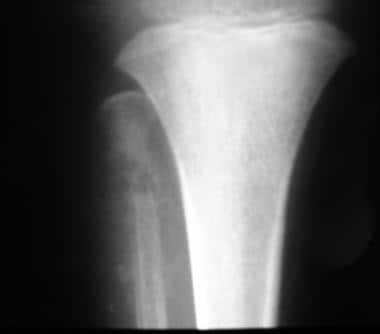 Image shows a destructive metastatic lesion involving the proximal fibular metaphysis with periosteal reaction in the proximal fibular diaphysis.
Lytic lesions may be seen in skull, ribs, and pelvis. Sclerotic lesions have been seen and may be secondary to tumor infarction. Periosteal reaction is common. Widening of the cranial sutures secondary to dural metastasis (demonstrated in the first 2 images below) can be seen in neuroblastoma. The classic hair-on-end appearance (seen in the third image below), albeit unusual in neuroblastoma, can be seen in the skull in destructive lesions.
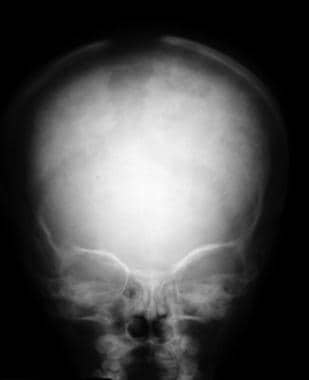 Anteroposterior (AP) or preorbital view of the skull shows widening of the sagittal and lambdoid sutures. This finding is due to dural metastases.
 Lateral view of the skull shows widening of the coronal sutures and multiple lucencies in the parietal and frontal bones of the skull in this patient with metastatic neuroblastoma.
Intraspinal extension of neuroblastomas can be seen on radiographs. Lateral views of the spine may show widening of the neuroforamina. Vertebral body scalloping, erosion of the pedicles, and scoliosis have also been seen in patients with intraspinal involvement. Intraspinal involvement may be present in the absence of these findings, and magnetic resonance imaging (MRI) is far superior in evaluating for intraspinal involvement.
Intravenous pyelography (IVP) and excretory urography were widely used in the past to evaluate patients with adrenal neuroblastomas before the advent of CT, MRI, and ultrasonography. [12] Adrenal neuroblastomas typically displace the ipsilateral kidney laterally and downward, producing the classic drooping-lily sign on excretory urograms (as seen in the image below). The drooping-lily sign is also caused by an obstructed upper moiety of a duplex collecting system.
 Intravenous pyelogram (IVP) shows a classic drooping-lily sign involving the right kidney. This patient had a known right adrenal neuroblastoma.
Computed Tomography
CT scanning is the modality most commonly used to diagnose and stage neuroblastomas. [11] CT can show the organ of origin, extent of the tumor, lymphadenopathy, metastases, and calcifications. About 80-90% of neuroblastomas show stippled calcifications on CT. [16, 14]
(See the images below.)
Nonenhanced axial CT scan of the chest in a patient with a thoracic neuroblastoma shows a large, right posterior mediastinal mass extending into the spinal canal and displacing the cord laterally to the left.
 This patient has enhancing dural metastases near the frontal and occipital lobes. This finding could result in widening of the sagittal suture on plain images of the skull.
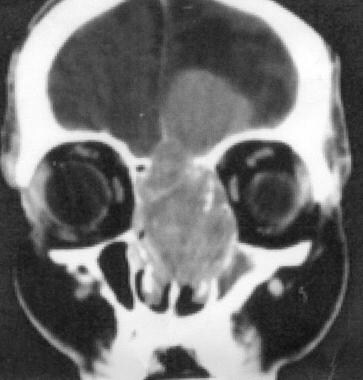
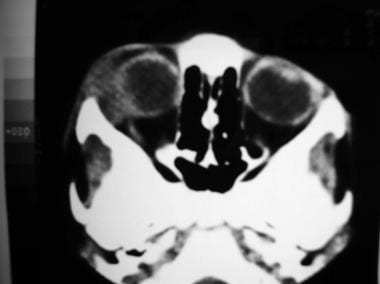 Axial CT scan of the orbits shows a heterogeneous-appearing, metastatic soft-tissue mass in the right orbit that displaces the globe and lateral rectus muscle medially. This patient presented with proptosis of the right eye.
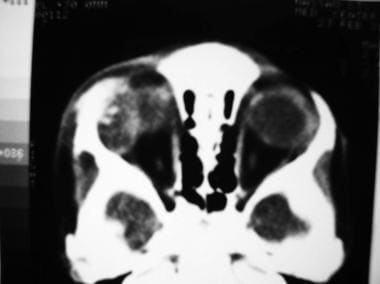 Axial CT scan of the orbits in the same patient as in the previous image, obtained a few millimeters cephalic, shows calcifications in the left orbital mass.
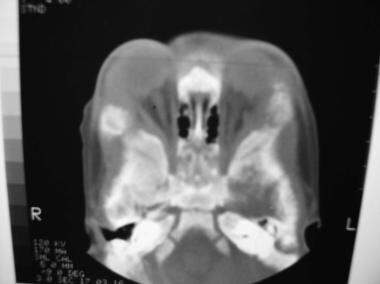 Bone window in a patient with bilateral proptosis shows osseous destruction involving both lateral orbital walls (left to right).
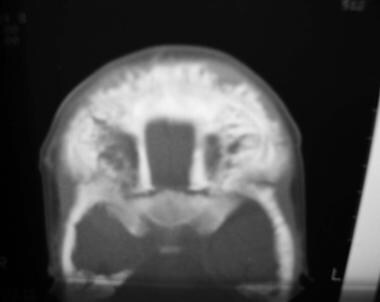 Bone-window axial CT study of the orbits (same patient as in the previous image) shows extensive bony destruction involving both frontal bones.
 Coronal CT scan of the orbits and sinuses shows a large, enhancing, and expansile mass occupying the ethmoid air cells that is invading the cribriform plate and breaking through to the left anterior cranial fossa. This entity is known as an esthesioneuroblastoma. Image courtesy of Michael Lev, MD.
Neuroblastomas often encase or compress adjacent blood vessels. Vessels that are commonly engulfed are the inferior vena cava, the renal veins and arteries, the splenic vein, the aorta, the celiac artery, and the superior mesenteric artery. Neuroblastomas rarely invade into the lumen of blood vessels.
The tumors often appear lobulated and typically have a heterogeneous appearance on contrast-enhanced CT. There are areas of low attenuation in the mass secondary to necrosis and hemorrhage. CT is good for detecting lung metastases and focal liver metastases (which appear as focal hypoattenuating and poorly enhancing masses). [17] Bone-window settings should always also be examined to assess for skeletal metastases.
False positives/negatives
Diffuse liver metastases may be missed on CT. Cerebral metastases can appear as enhancing meninges secondary to dural metastases, which can simulate meningitis. Sometimes, brain metastases can appear as cystic lesions with peripheral enhancement, which can mimic an abscess. CT is poor for detecting metastatic disease to the bone and is limited in evaluating extradural extension of tumor into the spinal canal without the aid of intrathecal contrast material (CT myelography).
Magnetic Resonance Imaging
MRI has a number of advantages over CT. [13] One is that MRI does not use ionizing radiation. Other advantages include the multiplanar imaging capabilities of MRI and, often, the elimination of the need to use intravenous contrast enhancement. [14]
MRI is superior to CT in evaluating extradural extension of the tumor and bone marrow involvement and in identifying diffuse hepatic metastases. MRI can show displacement of the spinal cord and/or nerve root displacement or compression and epidural spread of neuroblastoma exceptionally well. MRI results are well correlated with findings from bone marrow biopsy.
MRI utilizes the intrinsic tissue characteristics on T1- and T2-weighted imaging. Neuroblastomas are typically hypointense on T1-weighted images and hyperintense on T2-weighted images. [18] When contrast material is administered, the tumor exhibits inhomogeneous enhancement. Calcifications appear as signal voids on MRIs. Hemorrhagic areas often appear bright on T1-weighted images.
Bone marrow disease appears bright (hyperintense) and heterogeneous on T2-weighted images and dark (hypointense) on T1-weighted images. Diffuse liver metastases appear bright on T2-weighted MRIs. [19]
In a prospective study by Solimon et al of whole-body (WB) MRI versus FDG-PET/CT in the detection of neuroblastoma bone marrow metastasis in 20 patients, WB MRI correctly identified true positives and true negatives in all cases, with a sensitivity of 100%, versus 86.7% for FDG-PET/CT. [20]
(The characteristics of neuroblastomas on T1- and T2-weighted MRI scans are demonstrated in the images below.)
Axial nonenhanced T1-weighted MRI shows a hypointense mass in the retroperitoneum originating from the left adrenal gland. The mass displaces the left kidney in an anterolateral direction, it extends through the neuroforamen into the spinal canal, and it displaces the spinal cord to the right. The exact site of origin of large masses can be difficult to determine. Sympathetic-chain primaries supposedly invade the spinal canal with greater frequency than do adrenal primaries.
 Axial T2-weighted MRI in the same patient as in the previous image again demonstrates extradural extension into the spinal canal. The tumor appears hyperintense. Spinal cord displacement is better demonstrated on T2-weighted images than on other images.
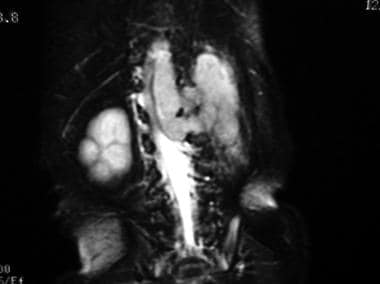
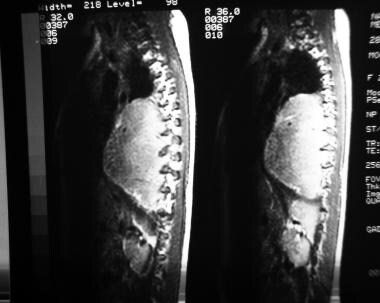
 Sagittal T2-weighted MRI in the same patient as in the previous 2 images shows a hyperintense extradural mass in the lower thoracic spine. Axial and coronal images confirm that this is extradural extension of a neuroblastoma of the left adrenal gland.
 Coronal T2-weighted MRI in the same patient as in the previous 3 images shows a hyperintense mass in the left adrenal gland. The mass is extending cephalad into the spinal canal via the neuroforamen.
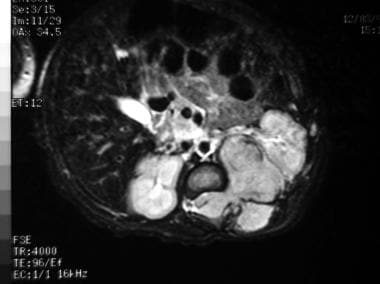
 Axial T2-weighted chest MRI in a patient with a thoracic neuroblastoma shows a large, right posterior mediastinal mass extending into the spinal canal and displacing the cord laterally to the left. The mass is hyperintense on T2-weighted images.
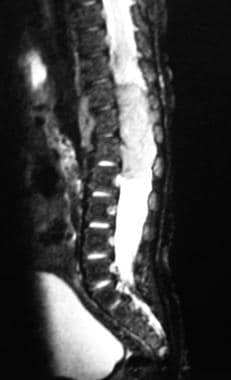
 Sagittal T2-weighted MRI in a patient with a thoracic neuroblastoma shows a large, hyperintense, right posterior mediastinal mass extending into the spinal canal through multiple neuroforamina.
Ultrasonography
Neuroblastomas appear as an inhomogeneously echogenic mass on sonograms (see the image below). Calcifications typically appear as focal brightly echogenic areas in the mass. In masses with fine calcifications, images show diffuse, increased echogenicity. Acoustic shadowing from the calcifications may or may not be present. Hemorrhagic or necrotic areas in the tumor appear as hypoechoic or anechoic areas.
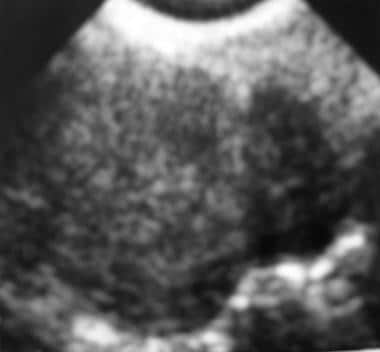 Transverse sonogram of the left renal area was obtained in a toddler who presented with abdominal pain and a palpable mass in the left flank. Sonogram shows an inhomogeneously hyperechoic, extrarenal mass that laterally displaces the kidney (which appears as a relatively hypoechoic structure).
Ultrasonography can be used as a screening tool for detecting abdominal or pelvic masses in children. Doppler ultrasonography can be used to identify blood flow through blood vessels encased or compressed by the tumor. Increased vascularity of neuroblastomas has been reported on Doppler sonograms, although typically most lesions show reduced vascularity.
Obstetric ultrasonography can depict fetal neuroblastomas as early as 19 weeks' gestation. Most of the cases identified during obstetric ultrasonography are diagnosed during the third trimester (around 36 weeks).
Ultrasonography is used to differentiate adrenal hemorrhage from neuroblastoma. Adrenal hemorrhage is the most common cause of adrenal mass in the neonatal population. It typically appears echogenic in the newborn, as neuroblastomas do, but gradually becomes anechoic and avascular and often becomes smaller on serial sonograms as it regresses.
Sonograms can depict liver metastases, but they are limited in assessing the extent of metastatic disease to the liver. This is better evaluated with CT scanning or MRI, although all of these techniques may be complementary (eg, a metastasis may be visible on sonograms but not on CT scans, or vice versa).
Nuclear Imaging
Bone scans obtained by using technetium-99m methylene diphosphate (99mTc MDP) (see the image below) are performed in many patients with neuroblastoma to assess metastatic disease. Approximately 74% of primary tumors in neuroblastoma take up 99mTc MDP. Uptake may be seen in liver and lung metastases as well.
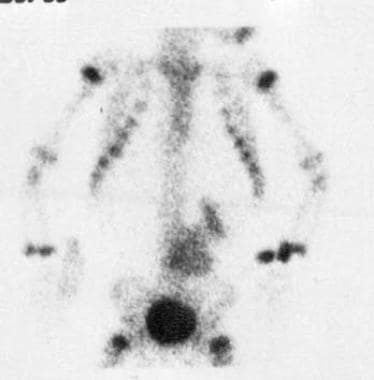 Technetium-99m methylene diphosphate (MDP) bone scan shows a focus of intense activity in the left lower quadrant of the abdomen adjacent to the spine, above the bladder. This finding corresponds to a neuroblastoma in this location. Image shows activity in the dilated renal calyces on the left, which suggests partial obstruction of the left ureter by the mass. No evidence of metastatic disease is observed.
Tc-99m MDP scans cannot be used to differentiate between cortical and bone marrow metastases; this limits their usefulness in accurately staging the disease, particularly in differentiating stage 4 from stage 4s neuroblastomas in the Evans classification system. In stage 4, distant metastases are present. Stage 4s occurs in infants who have a localized tumor that does not cross the midline, with metastatic disease confined to the liver, skin, and bone marrow and with no evidence of cortical bone involvement observed. [21]
Iodine-131 (131I) metaiodobenzylguanidine (MIBG) and iodine-123 (123I) MIBG [22] are used to identify sites of primary neuroblastomas. [23, 24, 25] Tumors that contain sympathetic tissue, such as neuroblastomas, ganglioneuroblastomas, ganglioneuromas, medullary thyroid carcinomas, pheochromocytomas, and carcinoids, take up MIBG. However, MIBG scanning cannot be used to differentiate these lesions. In the age group in which neuroblastoma (and its more benign forms, ganglioneuroblastoma and ganglioneuroma) is prevalent, the other tumors are rare. In patients with high-risk neuroblastoma, Papathanasiou et al found that 123I MIBG was superior to fluorine-18-fluorodeoxyglucose positron emission tomography (FDG-PET) in assessing extent of disease. [26, 27, 28, 29, 30]
MIBG has also been used to follow up the response to treatment in neuroblastoma patients. One of the drawbacks of using MIBG is that up to 30% of neuroblastomas may not take up MIBG, although 95% of neuroblastomas secrete catecholamines. Also, up to 50% of recurrent neuroblastomas do not take up MIBG even if they did so before therapy. [31]
I-131 MIBG has a high principal proton energy (364 KeV). It emits beta particles, thus giving a large dose of radiation to the patient. I-123 MIBG has a lower principal photon energy (159 KeV). It also does not emit beta particles, giving less radiation dose to the patient. I-123 MIBG has a shorter half-life (13 hr) than that of 131I MIBG (8 days), and it must be used the day it is produced, making it more expensive and less readily available.
In a retrospective study of 28 patients with neuroblastoma, PET/CT was found to be superior to 131I MIBG scintigraphy in detecting lymph node and bone/bone marrow lesions. Sensitivity, specificity, positive predictive value, negative predictive value, and accuracy of F-FDG PET/CT were 100%, 60%, 92%, 100%, and 92.80%, respectively; and those of 131I MIBG were 95.65%, 60%, 91.67%, 75%, and 89.20%, respectively. In these patients, PET/CT detected 107 lesions, and 131I MIBG scintigraphy detected 74 lesions. [32]
Another isotope that can be used to detect primary neuroblastomas is indium-111 (111In) pentetreotide, which is a somatostatin analogue. Studies have shown that it is as sensitive as MIBG in detecting neuroblastoma and other catecholamine-secreting tumors. In-111 pentetreotide has 2 principal photon energies (174 and 245 KeV), both of which are lower than that of 131I MIBG. It also does not emit beta particles, giving a lower radiation dose to the patient. In-111 pentetreotide also requires less patient preparation and produces images with better resolution than MIBG images have on gamma scintillation cameras, but it is not widely used in pediatric oncology imaging.
F18-Metafluorobenzylguanidine (18F MFBG) is a novel positron emission tomography (PET) tracer that has been reported to have a biodistribution similar to that of 123I MIBG. In a study by Wang et al of 34 patients with a history of neuroblastoma, 18F MFBG PET/CT had a higher lesion detection rate, identifying 784 lesions versus 532 lesions detected by 123I MIBG SPECT/CT. [33]
In a meta-analysis by Li et al of PET-CT for neuroblastoma, specificity was 78%, positive likelihood ratio 4.07, negative likelihood ratio 0.12, and diagnostic odds ratio (DOR) 27.43. For primary neuroblastoma, sensitivity was 86%, specificity 82%, positive likelihood ratio 4.90, negative likelihood ratio 0.17, and global DOR 25.427. [34]
-
Axial nonenhanced T1-weighted MRI shows a hypointense mass in the retroperitoneum originating from the left adrenal gland. The mass displaces the left kidney in an anterolateral direction, it extends through the neuroforamen into the spinal canal, and it displaces the spinal cord to the right. The exact site of origin of large masses can be difficult to determine. Sympathetic-chain primaries supposedly invade the spinal canal with greater frequency than do adrenal primaries.
-
Axial T2-weighted MRI in the same patient as in the previous image again demonstrates extradural extension into the spinal canal. The tumor appears hyperintense. Spinal cord displacement is better demonstrated on T2-weighted images than on other images.
-
Sagittal T2-weighted MRI in the same patient as in the previous 2 images shows a hyperintense extradural mass in the lower thoracic spine. Axial and coronal images confirm that this is extradural extension of a neuroblastoma of the left adrenal gland.
-
Coronal T2-weighted MRI in the same patient as in the previous 3 images shows a hyperintense mass in the left adrenal gland. The mass is extending cephalad into the spinal canal via the neuroforamen.
-
Intravenous pyelogram (IVP) shows a classic drooping-lily sign involving the right kidney. This patient had a known right adrenal neuroblastoma.
-
An intravenous pyelogram (IVP) shows an inferiorly displaced kidney on the right. Above the right kidney are stippled calcifications. These findings are consistent with those of a neuroblastoma.
-
This intravenous pyelogram (IVP) was obtained in a toddler who presented with abdominal pain and a palpable mass in the left flank. A drooping-lily sign is present on the left. The patient was referred for further workup.
-
Transverse sonogram of the left renal area was obtained in a toddler who presented with abdominal pain and a palpable mass in the left flank. Sonogram shows an inhomogeneously hyperechoic, extrarenal mass that laterally displaces the kidney (which appears as a relatively hypoechoic structure).
-
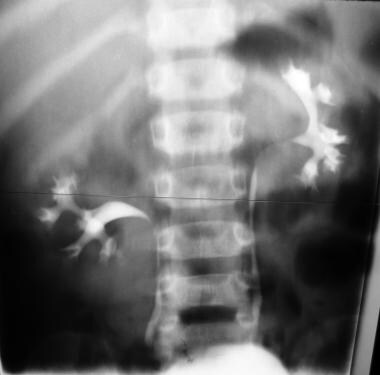
Anteroposterior (AP) views of both knees show irregular lucencies in both distal femoral and proximal tibial metaphyses; these represent relatively symmetrical metastatic disease.
-
Image shows a destructive metastatic lesion involving the proximal fibular metaphysis with periosteal reaction in the proximal fibular diaphysis.
-
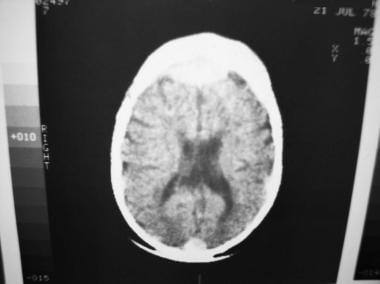
This patient has enhancing dural metastases near the frontal and occipital lobes. This finding could result in widening of the sagittal suture on plain images of the skull.
-
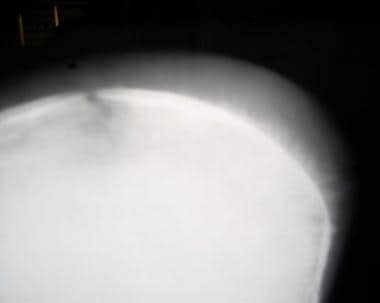
Classic hair-on-end appearance of a destructive metastatic lesion of the skull.
-
Frontal view of the chest shows a mass in the right thorax behind the heart. Posterior rib changes and the lateral view (seen in the next image) confirm that this is a posterior mediastinal mass. Note splaying and thinning of the ribs in the lower rib cage on the right. This was a thoracic neuroblastoma.
-
Lateral view of the chest in the same patient as in the previous image confirms the posterior mediastinal mass.
-
Nonenhanced axial CT scan of the chest in a patient with a thoracic neuroblastoma shows a large, right posterior mediastinal mass extending into the spinal canal and displacing the cord laterally to the left.
-
Axial T2-weighted chest MRI in a patient with a thoracic neuroblastoma shows a large, right posterior mediastinal mass extending into the spinal canal and displacing the cord laterally to the left. The mass is hyperintense on T2-weighted images.
-
Sagittal T2-weighted MRI in a patient with a thoracic neuroblastoma shows a large, hyperintense, right posterior mediastinal mass extending into the spinal canal through multiple neuroforamina.
-
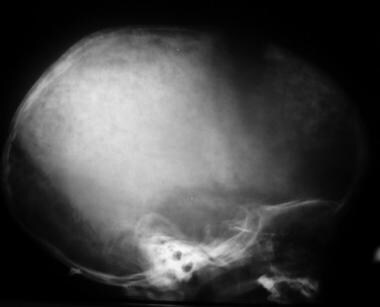
Anteroposterior (AP) or preorbital view of the skull shows widening of the sagittal and lambdoid sutures. This finding is due to dural metastases.
-
Lateral view of the skull shows widening of the coronal sutures and multiple lucencies in the parietal and frontal bones of the skull in this patient with metastatic neuroblastoma.
-
Axial CT scan of the orbits shows a heterogeneous-appearing, metastatic soft-tissue mass in the right orbit that displaces the globe and lateral rectus muscle medially. This patient presented with proptosis of the right eye.
-
Axial CT scan of the orbits in the same patient as in the previous image, obtained a few millimeters cephalic, shows calcifications in the left orbital mass.
-
Bone window in a patient with bilateral proptosis shows osseous destruction involving both lateral orbital walls (left to right).
-
Bone-window axial CT study of the orbits (same patient as in the previous image) shows extensive bony destruction involving both frontal bones.
-
Coronal CT scan of the orbits and sinuses shows a large, enhancing, and expansile mass occupying the ethmoid air cells that is invading the cribriform plate and breaking through to the left anterior cranial fossa. This entity is known as an esthesioneuroblastoma. Image courtesy of Michael Lev, MD.
-
Technetium-99m methylene diphosphate (MDP) bone scan shows a focus of intense activity in the left lower quadrant of the abdomen adjacent to the spine, above the bladder. This finding corresponds to a neuroblastoma in this location. Image shows activity in the dilated renal calyces on the left, which suggests partial obstruction of the left ureter by the mass. No evidence of metastatic disease is observed.