Practice Essentials
Ewing sarcoma is a highly malignant primary bone tumor that is derived from red bone marrow. It was first described by James Ewing in 1921. [1] This tumor is most frequently observed in children and adolescents aged 4-15 years and rarely develops in adults older than 30 years. The 2 most common malignant bone tumors in children are osteosarcoma and Ewing sarcoma. [2, 3, 4, 5, 6]
Ewing sarcoma accounts for approximately 5% of biopsy-analyzed bone tumors and approximately 33% of primary bone tumors. [2] This disease is the second most common malignant bone tumor in young patients, and it is the most lethal bone tumor. [4] An association exists between Ewing sarcoma and primitive peripheral neuroectodermal tumor (PNET). [7, 8, 9, 10]
It can be difficult to differentiate between Ewing sarcoma and osteomyelitis on CT and ragiographs. In most patients, MRI provides more specific information than CT scanning. Hence, MRI is the test of choice for staging in cases of suspected Ewing sarcoma. [11, 5, 12]
(Radiologic characteristics of Ewing sarcoma are seen in the images below.)
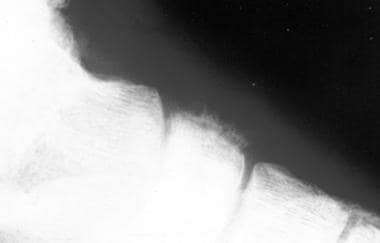 Radiograph of Ewing sarcoma of the os naviculare, a rare location for the tumor. This image depicts a significant periosteal reaction.
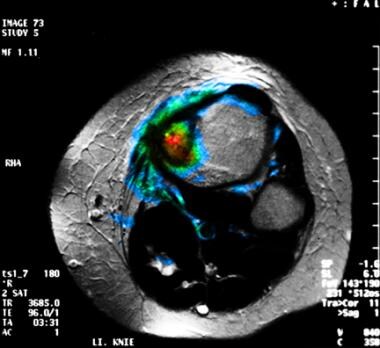 Fusion magnetic resonance imaging (MRI) and positron emission tomography scan studies obtained with fluorodeoxyglucose (FDG) in a patient with a Ewing sarcoma of the left tibia. This image demonstrates the tumor is primarily confined to the bone, with a small periosteal fraction. The MRI findings matched those of the PET images obtained with FDG scanning.
Preferred examination
No single morphologic or functional imaging method provides findings for a specific diagnosis of Ewing sarcoma, but the results do contribute to tumor staging. Therefore, obtaining a histologic specimen of the lesion in all patients is essential in planning therapy. Because the clinical symptoms of Ewing sarcoma are nonspecific and because they frequently mimic osteomyelitis or other malignant tumors, such as leukemia, an initial conventional radiographic and/or magnetic resonance imaging (MRI) examination is performed. [13, 14, 11, 5]
These studies may reveal the classic signs of Ewing sarcoma. The appearance of Ewing sarcoma may vary from that of pure lysis to sclerosis. Although plain radiographs may show typical signs of Ewing sarcoma, MRI provides more accurate information about tumor size. MRI is also superior to computed tomography (CT) scanning in delineating the extent of the neoplasms and their relation to the surrounding structures. [12, 15] MRI findings alone may not be conclusive for a malignant lesion, but MRIs do help show the full extent of tumor spread.
Sharma et al concluded that 18F-FDG PET/CT demonstrated high accuracy in diagnosing the recurrence of primary skeletal Ewing sarcoma. [16, 17] PET scanning with FDG can be recommended as the most sensitive method for the detection of early changes in tumor metabolism as a result of therapeutic effects. Some preliminary results in bone tumors suggest that FDG kinetics are modulated by the expression of chemoresistant genes MDR1 and MRP. A low FDG uptake is more frequently observed in resistant tumors. [18]
Lee et al examined FET, FLT, and FDG to differentiate tumor from inflammation and found that FET selectively localized in tumor tissues but not in inflammation. Tsuji et al found similar results. FET has been shown to have specific uptake in the cells through LAT1 and LAT2 amino acid transporters, and Ewing sarcoma has been shown to have increased LAT1 transporter expression at the cell surface. [19, 20, 21]
Guidelines
The National Comprehensive Cancer Network (NCCN) guidelines for bone cancer recommend that all patients younger than 40 years with abnormal radiographs be referred to an orthopedic oncologist for further workup that includes biopsy. For patients 40 years of age or older, the recommended workup includes the following [22] :
-
Computed tomography (CT) of the chest, abdomen and pelvis
-
Bone scan
-
Mammogram and other imaging studies as clinically indicated
The European Society for Medical Oncology (ESMO) guidelines for bone cancer recommend follow-up of an abnormal radiograph with MRI of the whole compartment with adjacent joints. CT scanning is recommended only in the case of diagnostic problems or doubt, so as to provide clearer visualization of calcification, periosteal bone formation, or cortical destruction. [23]
Both the NCCN and ESMO guidelines agree that biopsy is required to confirm the diagnosis before any surgical procedure. [22, 23]
Staging
Staging for bone cancer includes local imaging to reveal the full extent of tumor prior to therapy, as well as evaluation of the patient for distant metastases. Local imaging usually includes MRI and CT scanning. When bone is involved, these are complimentary techniques, but for soft-tissue lesions, MRI should be adequate in most cases. The evaluation for metastases should include bilateral bone marrow biopsies, chest CT scanning, and radionuclide total body scanning, such as technetium-99m scanning. Many centers are now using FDG-PET scanning or total-body MRI to look for occult metastases. Although these techniques often produce false-positive results that require biopsy, some findings suggest that locating occult metastases and providing local therapy (radiation or surgery) improves survival. [22, 23, 24, 6, 25]
ESMO guidelines recommend specifying the tumor type and subtype according to the World Health Organization (WHO) classification. Under the WHO classification system, tumors are further classified as benign, intermediate, or malignant. Bone sarcomas are classified by group (eg, chondrogenic, osteogenic, fibrohistiocytic, Ewing sarcoma) and further subtyped within each group. [23, 24]
Radiography
Both long and flat bones are affected in Ewing sarcoma, because no bone is immune to tumor development. In the long bones, the tumor is almost always metaphyseal or diaphyseal. Most commonly, radiographs show a long, permeative lytic lesion in the metadiaphysis and diaphysis of the bone, with a prominent soft-tissue mass extending from the bone.
Ewing sarcoma is vascular, and the extent of spread through the medullary cavity is usually greater than that indicated on plain radiographs. Therefore, MRI is recommended in addition to conventional radiography as the preferred imaging means for staging the tumor. MRI provides information about the true extent of the lesion, as well as the involvement of critical adjacent structures.
The typical periosteal reaction of Ewing sarcoma may be difficult to differentiate from infection or other malignant tumors of bone. Osteomyelitis is the most common differential diagnosis. Occasionally, a sclerotic Ewing sarcoma may be mistaken for an osteosarcoma, whereas a telangiectatic osteosarcoma may be mistaken for a Ewing sarcoma.
Benign, solitary bone lesions usually do not cause false-positive or false-negative results. Vertebral manifestations of Ewing sarcoma may mimic those of hemangiomas. Other malignant tumors such as chondrosarcoma, fibrosarcoma, and soft-tissue sarcomas must be included in the differential diagnosis, although these usually occur in patients older than those with Ewing sarcoma.
(See the images below.)
Radiograph of Ewing sarcoma of the os naviculare, a rare location for the tumor. This image depicts a significant periosteal reaction.
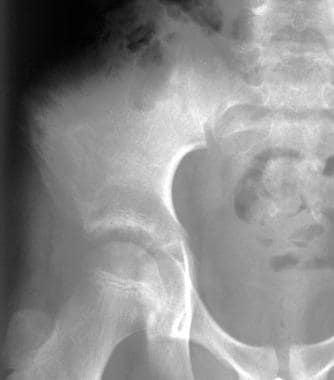 Radiograph from an 11-year-old boy with a large Ewing sarcoma in the right pelvic area. Destruction of the bone structure resulted from tumor involvement.
Sclerotic lesions are less common but may occur in approximately 25% of cases. Plain radiographs of the long bones may show a lesion with poorly defined margins that is destroying the bone. The lesion may invade the cortical bone, although Ewing sarcoma may also traverse the haversian system and cause a large soft-tissue mass outside the bone despite the absence of cortical destruction. This phenomenon is noted in approximately 50% of patients with Ewing sarcoma. A periosteal reaction is usually present, and it often has an onion-skin or sunburst pattern, which indicates an aggressive process.
In some patients, Codman triangles may be present at the margins of the lesion. These result from the elevation of the periosteum and central destruction of the periosteal reaction caused by the tumor. In rare cases, a lesion is not visible on plain radiographs.
Computed Tomography
CT scanning helps define the bone destruction that is associated with Ewing sarcoma. [26] Tumor size can be evaluated with contrast-enhanced CT scanning, which may be used in follow-up evaluation during chemotherapy. However, the preferred method for staging and following up Ewing sarcoma is still MRI. [27, 28]
A low rate of false-negative results is reported for both CT scan and MRI studies, which have an accuracy of approximately 90%. [15] Although CT scanning provides accurate information about tumor size, differentiating Ewing sarcoma from acute osteomyelitis, fibrosarcoma, osteosarcoma, and other conditions is difficult with this modality.
Magnetic Resonance Imaging
MRI is essential to elucidate soft-tissue involvement (see the image below), because the tumor has low signal intensity on T1-weighted images, as compared to the normal high signal intensity of the bone marrow. On T2-weighted images, the tumor is hyperintense compared to muscle. These images should be obtained with fat saturation, if possible. Otherwise a short-tau (τ) inversion recovery (STIR) sequence is recommended as a substitute.
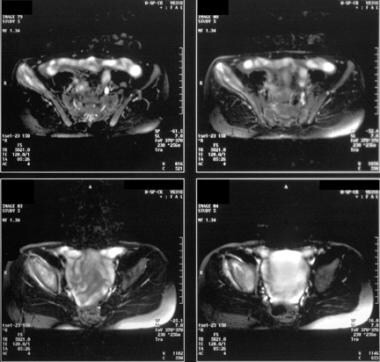 Magnetic resonance images from an 11-year-old boy with a right pelvic Ewing sarcoma. The tumor in the right iliac bone has the typical hyperintense appearance and extends to the hip. Significant involvement of the soft-tissue structures is depicted.
The use of gadolinium-based contrast agents does not add significant value to the MRI evaluation of Ewing sarcoma. On T1-weighted images, the tumor has low signal with heterogeneous gadolinium enhancement, whereas signal intensity on T2-weighted images varies after contrast enhancement.
Gadolinium-based contrast agents have been linked to the development of nephrogenic systemic fibrosis (NSF) or nephrogenic fibrosing dermopathy (NFD). The disease has occurred in patients with moderate to end-stage renal disease after being given a gadolinium-based contrast agent to enhance MRI or MRA scans.
After treatment, osteosarcomas and Ewing sarcomas may have the reduced signal intensity similar to that of the bone marrow, which may be isointense with muscle. These tumors may also have a well-defined margin. However, the changes in signal intensity reflect changes in the bone marrow structure and nonspecific changes such as fibrosis. The change in signal intensity is helpful in noting a therapeutic effect, but it sometimes causes difficulties in detecting residual tumor tissue. [29]
Erlemann et al evaluated the value of MRI for treatment follow-up and noted that static MRI has little value in assessing the response to treatment. [14] The authors reported that on T2-weighted images, a reduction in the signal intensity of soft-tissue masses indicated a response with a sufficient degree of accuracy (71%) but low sensitivity. An increase in signal intensity after the administration of gadolinium-diethylenetriaminepentaacetic acid (Gd-DTPA) indicated zones of viable tissue, with low specificity. Erlemann et al found that dynamic MRI, on the other hand, proved to have a high degree of accuracy (85.7%) relative to scintigraphy.
The accuracy of MRI—that is, the positive predictive value plus the negative predictive value—has been reported to be 90.3% in one study. [15, 30] In most patients, MRI seems to provide more specific information than CT scanning. Hence, MRI is the test of choice for staging in cases of suspected Ewing sarcoma. CT scanning and MRI are problematic in the differentiation among osteosarcomas, fibrosarcomas, and other malignant tumors, as well as osteomyelitis. However, Ewing sarcoma occurs in patients of a particular age group, and its diagnosis is usually apparent. Differentiating Ewing sarcoma from closely related diseases such as neuroblastoma and PNET tumors may be difficult.
Ultrasonography
Ultrasonography (US) is not routinely used to stage the primary tumor in Ewing sarcoma. However, US can help delineate the extraosseous part of the tumor, particularly in follow-up care during treatment. In addition, US may be used to guide a biopsy of a lesion and to help exclude metastases in the liver.
In the pelvic and abdominal area, US may be used to delineate extraosseous soft-tissue masses. US findings, however, are not specific for the diagnosis of Ewing sarcoma.
Although US may help delineate the size of an extraosseous mass in the abdomen, the differential diagnosis of soft-tissue masses in the abdominal area include those with a variety of histologic features.
Nuclear Imaging
With static bone scintigraphy, the primary tumor of Ewing sarcoma is usually depicted as a focal area of increased radionuclide activity. Whole-body bone scans can provide information about the primary lesion and depict skip lesions. Also, bone scintigraphy can be used to localize distant metastases during tumor staging. Three-phase dynamic bone scintigraphy (TPBS) can help in the assessment of treatment effects, with a reported accuracy of 88%. [31] In cases that respond to treatment, a reduction of both flow and tracer uptake can be observed.
In addition to technetium-99m (99mTc), other tracers, such as thallium-201 (201Tl), are used to assess the therapeutic response. However, 201Tl may cause an overestimation of tumor viability. Gallium-67 (67Ga) scanning was introduced for use in monitoring therapeutic responses; however, positron emission tomography (PET) scanning with fluorodeoxyglucose (FDG) is currently used instead (see the images below). [32, 18]
Fusion magnetic resonance imaging (MRI) and positron emission tomography scan studies obtained with fluorodeoxyglucose (FDG) in a patient with a Ewing sarcoma of the left tibia. This image demonstrates the tumor is primarily confined to the bone, with a small periosteal fraction. The MRI findings matched those of the PET images obtained with FDG scanning.
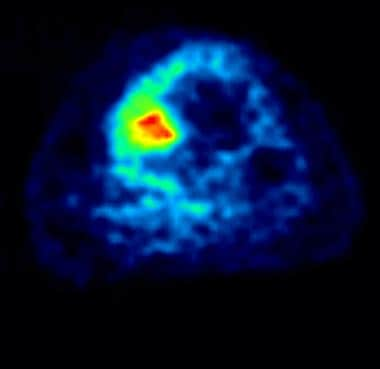 Positron emission tomogram obtained with fluorodeoxyglucose (FDG) scanning at the level of the magnetic resonance image in the previous image. This image shows high FDG accumulation in the lesion, which indicates high tumor viability. Moderate FDG accumulation in the periosteum and soft tissue resulted from tumor involvement.
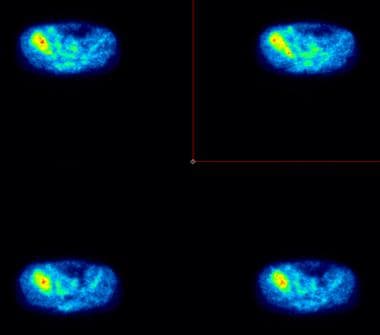 Cross-sectional positron emission tomograms obtained after the administration of fluorodeoxyglucose (FDG), in an 11-year-old boy with a right pelvic Ewing sarcoma. These tomograms depict increased metabolic activity in the tumor, as well as in the surrounding soft-tissue area.
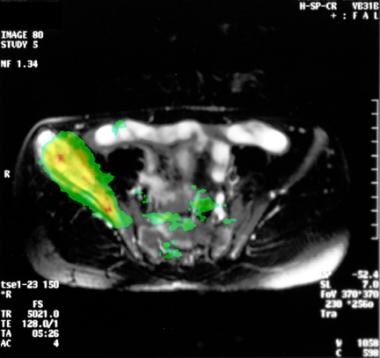 Cross-sectional fusion magnetic resonance image (MRI) and positron emission tomographic image of a Ewing sarcoma. The highest metabolic activities match the MRI findings. Note the soft-tissue involvement resulting from the large tumor.
FDG is used as a marker of tumor viability, and it may help to detect lesions that are not depicted on conventional bone scans. In addition, PET scanning is the most sensitive modality for therapeutic follow-up, and this modality can reveal early changes in tumor metabolism, which is an indicator of the therapeutic effect. [33] The area of necrosis is correlated with the change in FDG uptake, and a poor response is associated with a decrease in FDG accumulation (ie, tumor-nontumor ratios) of less than 30%. Bone marrow scanning is of limited use because of the availability of MRI. [34, 35, 36, 37, 21]
PET scanning with FDG can be recommended as the most sensitive method for the detection of early changes in tumor metabolism as a result of therapeutic effects. Some preliminary results in bone tumors suggest that FDG kinetics are modulated by the expression of chemoresistant genes MDR1 and MRP. A low FDG uptake is more frequently observed in resistant tumors. [18]
The radiotracer 18F-fluoroethyl tyrosine (FET) in FET PET/CT has been shown to be useful in diagnosing recurrence or residual Ewing sarcoma from infective pathology and to be helpful in monitoring response to therapy. [38]
Lee et al examined FET, FLT, and FDG to differentiate tumor from inflammation and found that FET selectively localized in tumor tissues but not in inflammation. Tsuji et al found similar results. FET has been shown to have specific uptake in the cells through LAT1 and LAT2 amino acid transporters, and Ewing sarcoma has been shown to have increased LAT1 transporter expression at the cell surface. [19, 20, 21]
Degree of confidence
Bone scans typically indicate changes in osteoid formation, and as such, the findings are nonspecific. As a result, false-positive findings caused by a number of diseases may suggest the presence of metastases or a tumor at the primary site. False-negative results are uncommon. Compared with conventional scintigraphy, PET scanning with FDG is more sensitive and provides a higher spatial resolution. However, high FDG uptake is also observed in other bone tumors and inflammatory processes such as osteomyelitis.
-
Radiograph of Ewing sarcoma of the os naviculare, a rare location for the tumor. This image depicts a significant periosteal reaction.
-
Fusion magnetic resonance imaging (MRI) and positron emission tomography scan studies obtained with fluorodeoxyglucose (FDG) in a patient with a Ewing sarcoma of the left tibia. This image demonstrates the tumor is primarily confined to the bone, with a small periosteal fraction. The MRI findings matched those of the PET images obtained with FDG scanning.
-
Positron emission tomogram obtained with fluorodeoxyglucose (FDG) scanning at the level of the magnetic resonance image in the previous image. This image shows high FDG accumulation in the lesion, which indicates high tumor viability. Moderate FDG accumulation in the periosteum and soft tissue resulted from tumor involvement.
-
Radiograph from an 11-year-old boy with a large Ewing sarcoma in the right pelvic area. Destruction of the bone structure resulted from tumor involvement.
-
Magnetic resonance images from an 11-year-old boy with a right pelvic Ewing sarcoma. The tumor in the right iliac bone has the typical hyperintense appearance and extends to the hip. Significant involvement of the soft-tissue structures is depicted.
-
Cross-sectional positron emission tomograms obtained after the administration of fluorodeoxyglucose (FDG), in an 11-year-old boy with a right pelvic Ewing sarcoma. These tomograms depict increased metabolic activity in the tumor, as well as in the surrounding soft-tissue area.
-
Cross-sectional fusion magnetic resonance image (MRI) and positron emission tomographic image of a Ewing sarcoma. The highest metabolic activities match the MRI findings. Note the soft-tissue involvement resulting from the large tumor.